Journal of Applied Biosciences 128: 12901 -12919
ISSN 1997-5902Plant reproductive phenology following selective
logging in a semideciduous tropical forest in the East
Region of Cameroon
Seraphine Ebenye MOKAKE1,2*, George Bindeh CHUYONG1,Andrew Enow EGBE1, Pascal Tabi TABOT3,
Blaise JUMBAM1, Bruno Jacques NGOTTA BIYON2, and Siegfried Didier DIBONG2
1Department of Botany and Plant Physiology, Faculty of Science, University of Buea, P.O Box 63, Buea Cameroon. 2Department of Plant Biology, Faculty of Science, University of Douala, P.O Box 24157, Douala, Cameroon. 3Department of Agriculture, HTTTC Kumba, University of Buea, P.O. Box 249 Kumba, Cameroon
*Corresponding author: [email protected]
Original submitted in on 20th April 2018. Published online at www.m.elewa.org on 31st August 2018 https://dx.doi.org/10.4314/jab.v128i1.4
ABSTRACT
Objective: Changing forest composition and structure caused by selective logging may affect forest phenology either alone or in combination with other environmental factors. The present study aims to analyze the phenological pattern of some exploitable timber tree species in two forest types.
Methodology and Results: Eleven economically important tree species were selected for monitoring at three DBH size classes using the crown density method originally devised by Koelmeyer (1959). Quantitative monthly data were collected from September 2011 to December 2014 for the timing, duration and frequency of flowering, and fruiting. A total of 58 individuals were observed in both forest types.
There was a significant difference between forest types and species for flowering (p≤0.001) and fruiting (p≤0.001). However, there was no significant difference in flowering and fruiting between individuals of the same species in both forest types. Flowering occurred during the light wet season and fruiting during the heavy wet season to ensure the availability of seeds to germinate into seedlings.
Conclusions and application of findings: Phenology was mainly constrained by the biotic determinants of phenology. However while the determinants of phenology are intact in the unlogged forest types, they are destabilized by selective logging causing an alteration in plant species. Thus, activities that are specifically designed to enrich selectively logged sites are necessary in order to promote the natural regeneration of timber species after selective logging.
Keywords: Forest type, Flowering, Fruiting, Plant size, Proximate factors, Ultimate factors. INTRODUCTION
Phenology is the study of the timing of recurring seasonal biological events in the animal and plant world, the causes of their timing concerning biotic and abiotic forces, and the interrelation among phases of the same or different species (Forest and Miller-Rushing, 2010). Phenology is an area of study,
which can unravel the web of interactions making it possible to predict the future more accurately. For plants, these include reproductive events such as bud formation and flowering, fruiting and seed germination together with vegetative processes like leaf flushing, and shedding. The timing of many
phenological events results proximately from a complex interplay among an organism’s genes (ultimate or biotic factors) and several external environmental factors (proximate or abiotic factors). These environmental factors include temperature, precipitation or photoperiod (Ausı´n et al., 2005; Forrest and Miller-Russhing, 2010). The flowering synchrony of individuals may well be related to the timing of first flowering and the shape and duration of the flowering curve of the plants in a population. All these are potentially heritable characters indicating the ultimate factors. In general, plant species in their native ranges have coupled their sensitive phenological period to the optimal climatic conditions through natural selection, in order to maximize their reproductive success. The seasonal cycle of plant’s phenology is influenced to the greatest extent by temperature, photoperiod and precipitation (Morellato and Haddad, 2000; Keatley, 2000). In tropical regions, where seasonal fluctuation in mean temperature is often insignificant, and in the East region of Cameroon where the climate seasonality is well pronounced with a dry season often lasting 4 – 5 months, periodic changes in rainfall often determines seasonality (Van Schaik et al., 1993, Murali and Sukumar, 1994). Identification of the trigger to phenology is considered to be important for evaluating roles of climatic conditions as a determinant of phenology, and to assess why community-wide masting phenomenon does not occur in other tropical regions. Such information is essential for the management and conservation of an endangered ecosystem helping to explore the effects of climate changes on forest regeneration. The duration of flowering and fruiting mainly will determine the phenological behaviour in tropical trees species. Selectively logged forests experience higher rates of forest fires (Cochrane, 2003; Matricardi et al., 2005), tree fall (Young and Hubbell, 1991), changes in microclimate (Ray et al., 2005), soil compaction and erosion (Olander et al., 2005). Such changes in forest function will definitely be expressed by changes in forest phenology. Changes in the forest composition and age class structure may affect forest phenology either alone or in combination with other environmental factors (Young and Hubbell, 1991; Ray et al., 2005). In selectively
logged sites, soil compaction and erosion could also affect water and nutrient availability, which will eventually affect phenological processes independent of crown closure. In other words, analysis of gap dynamics and phenological changes in the logged forests are generally not equivalent. Herrerias-Diego et al. (2006) found that fragmentation shifted the flowering period of a perennial tree species by 15 – 20 days for at least three years after the disturbance. A 2 –3 week delay could impact fruit maturation. In addition, gap opening in the forests would mean more visibilities of the flower (Frankie et al., 1983), and more pollinators requiring more resources for pollinator satiation. The main phenological aspects, which include leafing, flowering and fruiting in tropical tree species have been, studied extensively (Singh and Singh, 1992; Sun et al., 1996) and the proximate factors of phenology have been the subject of controversy over the last decades. However, very few studies have examined the possible functional significance of an interrelationship between flowering and fruiting phenophases in tropical trees (Van Schaik et al., 1993). In addition, few reports are available on the reproductive phenological studies in forest ecosystems of the East region and little or no attention has been given to the frequency and the duration of the various phenophases of tropical forests. Furthermore, the timing, duration and frequency of the various phenophases have been examined in isolation from one another, whereas there are reasons to assume that these three parameters interact with each other to shape the diversity of various ecosystems observed in nature. The frequency of flowering ranges from several times a year to once in several years (Appanah, 1993; Sakai et al., 1999). Plant size is usually considered an environmentally influenced characteristic, determined by plant age and growing conditions, though not often tested (Waller, 1988). Plant size is usually correlated with total flower production and the largest plants in a community are usually the most fecund (Herrera, 1993). Yet coexisting species vary considerably in their timing of flowering (Janzen, 1967; Bawa, 1983). However individual level patterns are often not useful in phenology (Visser et al., 2010) but understanding
them is essential for making sense of many population level pattern because it represents the integrated activity schedules of many individuals. Few studies have addressed the relationships between the different components of an individual’s phenology, variation in plant size and individual reproductive success. More so, little or no information exists on the impacts of selective logging on phenological dynamics in general and in the East region in particular. Therefore, the present study
would shed light on the effects of selective logging on the plant phenological pattern of tree species in the tropical forests of the Eastern region of Cameroon aiding the understanding of the response of the tree species to climatic factors, seasonality and forest disturbance. The main objective of this study was to determine if selective logging changes the phenological dynamics of the forest in the East region of Cameroon.
MATERIALS AND METHODS
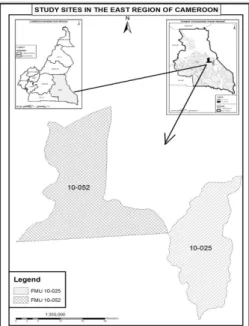
Study site: This study was carried out in two logging concessions in the East region of Cameroon. The East region with an area of 109,011 km² stretches between latitudes 3°49’59N and longitude 14010’0E. It is bordered
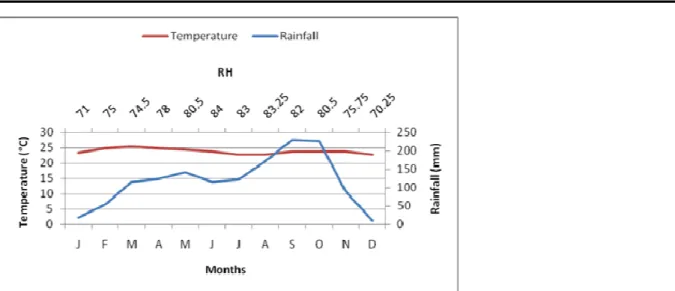
to the East by the Central African Republic, to the South by the Republic of Congo, to the North by the Adamawa Region, and to the West by the Centre and South Regions of Cameroon (Fig. 1). The soil is predominantly ferrallitic, rich in iron and red in colour (Fitzpatrick, 2002). The East region has a wet equatorial climate, with a mean temperature of 24˚ C and an annual rainfall range of 1500-2000mm except in the extreme East and Northern portions, which have less proportion. It has a bimodal rainfall pattern with a long dry season from December to May, a light wet season from May to June, a short dry season from July to October, and a heavy wet season
from October to November. The humidity and cloud cover are relatively high and the relative humidity is highest in the month of June (Fitzpatrick, 2002) (Fig. 2). Each forest concession in Cameroon is made up of a number of Forest Management Units (FMU); which are subsequently divided into Annual Allowable Cuts (AAC) where selective logging is carried out in a specific year. This study was carried out in two FMUs mainly FMU 10052 and FMU 10025. FMU 10052 belonging to concession 1058 covers an area of 70,912 ha situated between latitudes 3°44’28,21’’ and 4°06’54,95’’ North and longitudes 14°27’24,84’’ and 14°48’44,84’’ East. FMU 10025 belonging to concession 1070 covers an area of 49,595 ha, is situated at latitudes 3°55’3,30’ North and longitudes 14°45’and 15°00’ East (Fig. 1).
Figure 2: Environmental parameters of the study site in the East region of Cameroon. Plot selection and establishment: Two plots traversing
different Annual Allowable Cuts (AAC) with different characteristics were selected for sampling from September 2011 to December 2014 (40 months) for each FMU. Plot 1: logged forest with two years’ post-logging activities (exploited in 2010) (FMU 10052). Plot 2: unlogged forest (exploited in 2015 after the study period) allowed the monitoring of samples under undisturbed
natural conditions (FMU 10025). In each forest type, a plot of 5000 x 50m was established (Fig. 3a-b). Three individuals of eleven commercial tree species exploited by the timber company were selected for monitoring at points where the nearest conspecifics were at least 200m apart (Table 1). The selected species were assessed monthly for flowering and fruiting.
a b
Figure 3 a and b: Localization of individuals of economically important species in logged and unlogged forest types respectively. Abale = Petersianthus macrocarpus, Ayous = Triplochyton scleroxylon, Bete=Mansonia altissima, Emien= Alstonia boonei, Eveuss= Klainedoxa gabonensis, Eyong= Eribroma oblongum, Frake=Terminalia superba, Padouk= Pterocarpus soyauxii, Sapelli= Entandrophragma cylindricum, Tali= Erythrophleum sauveolens
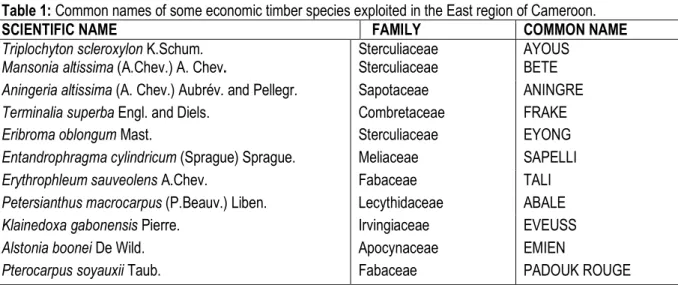
Table 1: Common names of some economic timber species exploited in the East region of Cameroon.
SCIENTIFIC NAME FAMILY COMMON NAME
Triplochyton scleroxylon K.Schum. Sterculiaceae AYOUS
Mansonia altissima (A.Chev.) A. Chev. Sterculiaceae BETE
Aningeria altissima (A. Chev.) Aubrév. and Pellegr. Sapotaceae ANINGRE
Terminalia superba Engl. and Diels. Combretaceae FRAKE
Eribroma oblongum Mast. Sterculiaceae EYONG
Entandrophragma cylindricum (Sprague) Sprague. Meliaceae SAPELLI
Erythrophleum sauveolens A.Chev. Fabaceae TALI
Petersianthus macrocarpus (P.Beauv.) Liben. Lecythidaceae ABALE
Klainedoxa gabonensis Pierre. Irvingiaceae EVEUSS
Alstonia boonei De Wild. Apocynaceae EMIEN
Pterocarpus soyauxii Taub. Fabaceae PADOUK ROUGE
Three individuals of each species selected were in the following diameter size class; 20-49cm, 50-79cm, and ≥ 80cm. In total, phenology data was collected for 58 individuals across both forest types with each forest type having 29 individuals. The reproductive phenology was recorded using the crown density method originally devised by Koelmeyer (1959). Quantitative monthly data were recorded for the timing, duration and frequency of flowering and fruiting. Three sides of a tree were assessed as having 0, 0-25%=1, 26-50%=2, 51-75%=3, 76-100%=4 of the maximum cover possible. Flowering was the period when flowers were open and apt for pollination. The synchronization of flowering between species was determined. Observations were made by the use of binoculars for the presence or absence of flower buds for the various timber species in order to determine flowering. Fruiting included the initial, growth and mature fruits.
Data analyses: Data on the time, duration and frequency included the monthly percentage of the plant on which each phenophase was observed. Percentage occurrences of each phenophase for each month were averaged for each species. These data were converted to degrees for each month in which an event was observed.
In this process, January is equivalent to 15° and December equivalent to 345 °. Data were subjected to Circular Vector Analysis in the Oriana Version 4 software (Kovach, 2011). Circular Vector Analysis was done for each species and independently for each phenophase. The Raleigh Test (z) was conducted to test for shifts in phenophases with time. Data was also subjected to Kruskal-Wallis Non-parametric Analysis of variance to determine differences in phenological patterns across forest types. All tests were conducted at α = 0.05. The phenophases of each species were then correlated with temperature, rainfall and relative humidity data of the study site. Synchrony indices for the flowering phenophase were calculated as the ratio between the marked individual’s mean duration of a phenological phase and the overall duration of the phase. The higher the ratio, the greater the coincidence in phenophases between different individuals of a species (i.e. at ratio 1.0 perfect synchrony will occur, and as the ratio decreases from 1.0 asynchrony will increase). Value of synchrony index was subtracted from 1.0 to get the asynchrony index. Reproductive success was calculated as modified from Singer and Sazima (2001):
RESULTS
Studied species: A total of 58 individuals were studied in both forest types with 29 individuals per forest type. All species appeared in both forest types except Aningeria altissima, which was present only in the unlogged forest.
Generally, a majority of the species flowered between January-June and September-December and produced fruits between September-May. Most species in both forest types did not have individuals in all the DBH
classes except Terminalia superba, Erythrophleum sauveolens, and Petersianthus macrocarpus in the logged forest that had individuals in all DBH classes. Flowering phenology: Flowering pattern and magnitude was significantly asynchronous between species (p ≤ 0.001). However, within individuals of the same species, flowering phenology was synchronous. The Circular Vector Analysis indicated that, Pterocarpus soyauxii, Entandrophragma cylindricum, Eribroma oblongum and Triplochyton scleroxylon started flowering from December-March; Terminalia superba, Erythrophleum sauveolens, Klainedoxa gabonensis, Aningeria altissima
and Petersianthus macropcarpus flowering from March-June; while Mansonia altissima and Alstonia boonei started flowering from June-August (Fig. 4). The peak of flowering occurred in Pterocarpus soyauxii, Triplochyton scleroxylon, Entandrophragma cylindricum and Petersiantus macropcarpus from December – March, Terminalia superba, Erythrophleum sauveolelns, Klainedoxa gabonensis and Aningeria altissima from March- June and Mansonia altissima, Alstonia boonei and Eribroma oblongum from June-December. Flowering also occurred just once in a year in all the species (Fig. 5a-l).
Pterocarpus soyauxii Taub. 0°
90°
180° 270°
Triplochyton scleroxylon K.Schum. 0° 90° 180° 270° Terminalia superba 0° 90° 180° 270° Mansonia altissima 0° 90° 180° 270°
Alstonia boonei De Wild. 0°
90°
180° 270°
Eribroma oblogum Mast. 0° 90° 180° 270° Entandrophragma cylindricum 0° 90° 180° 270° Erythropleum sauveolens 0° 90° 180° 270° Klainedoxa gabonensis 0° 90° 180° 270° Aningeria altissima 0° 90° 180° 270° Petersianthus macrocarpus 0° 90° 180° 270°
Figure 4: Flowering phenology of some economically important species in the East region of Cameroon. A year is converted to 3600 thus four months indicates 900. The lines (black and red) above the circle indicate the period and
Figure 5 a-l: Reproductive phenology of some economically important species in logged and unlogged forests in the East region of Cameroon
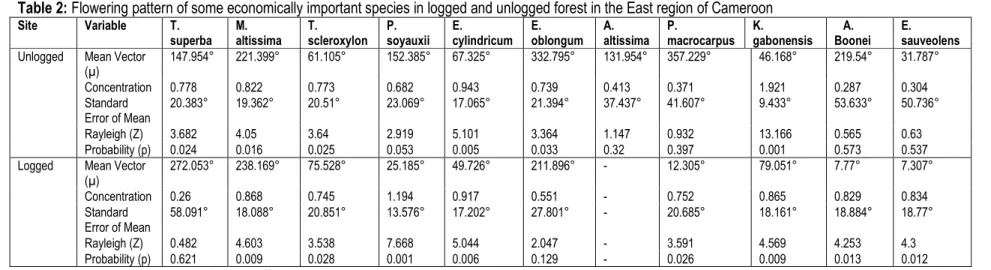
Flowering pattern and magnitude was significantly different between forest types (p ≤ 0.001) with flowering being higher in the unlogged than in the logged forest in most species except Terminalia superba, Mansonia altissima, Triplochyton scleroxylon, and Klainedoxa gabonensis that had more flowers in the logged forest. Raleigh’s test indicated a significant shift in the timing of flowering between species (p≤0.05) and an insignificant difference (p≥0.05) within individuals of the same species between both forest types except in Pterocarpus soyauxii, Alstonia boonei and Erythrophleum sauveolens where there was a significant shift in the time of flowering (Table 2).
Flowering synchronization: Flowering however was synchronous within individuals of the same species. The synchronization index was almost 01 in most species except Erythrophleum sauveolens, Alstonia boonei and Petersianthus macrocarpus in 2014 where there was asynchronization (Table 3). The highest synchronization index was in Erythrophleum sauveolens in 2012 (0.94).
Fruiting phenology: Fruiting was significantly different between species (p ≤ 0.001). However, within individuals of the same species, there were no significant differences in both forest types. Circular Vector Analysis results showed that Entandrophragma cylindricum, Mansonia altissima, Aningeria altissima, Eribroma oblongum, Klainedoxa gabonensis, and Terminalia superba would typically fruit from September-December; while Pterocarpus soyauxii, Alstonia boonei, Erythrophleum sauveolens, Petersianthus macrocarpus and Triplochyton scleroxylon fruited from December to March (Fig. 6). Maximum fruiting occurred in Erythrophleum sauveolens, Pterocarpus soyauxii, Alstonia boonei, and Triplochyton scleroxylon in January; Petersianthus macrocarpus in February; Aningeria altissima and Terminalia superba in August; Mansonia altissima in October; and Entandrophragma cylindricum and Eribroma oblongum in December (Fig. 5a-l).
Entandrophragma cylindricum 0° 90° 180° 270° Aningeria altissima 0° 90° 180° 270° Mansonia altissima 0° 90° 180° 270°
Eribroma oblogum Mast. 0°
90°
180° 270°
Klainedoxa gabonensis Pierre. 0° 90° 180° 270° Terminalia superba 0° 90° 180° 270°
Pterocarpus soyauxii Taub. 0° 90° 180° 270° Erythropleum sauveolens 0° 90° 180° 270°
Alstonia boonei De W ild. 0° 90° 180° 270° Petersianthus macrocarpus 0° 90° 180° 270°
Triplochyton scleroxylon K.Schum. 0°
90°
180° 270°
Figure 6: Fruiting phenology of some economically important species in the East region of Cameroon. A year is divided into 3600 thus four months indicates 900. The lines (black and red) above the circle indicate the period and duration of the
phenophase.
Fruiting was significantly different between forest types (p ≤ 0.001) with fruiting being higher in the logged forest than in the unlogged forest except in Terminalia superba, Pterocarpus soyauxii and Entandrophragma cylindricum. Species that did not fruit yearly included Erythrophleum sauveolens, Eribroma oblongum Petersianthus macrocarpus, Pterocarpus soyauxii, Klainedoxa gabonensis, and Triplochyton scleroxylon. However, Mansonia altissima, and Terminalia superba produced fruits yearly in the unlogged forest as compared to the logged forest. Erythrophleum sauveolens, Klainedoxa gabonensis and Petersianthus macrocarpus did not produce fruits yearly in both forest types. The Raleighs test also indicated that there were no significant shifts in the timing of the phenophase between both forest types. However, this pattern was not the same for all the years
as most of the species did not produce fruits yearly. Over time, fruiting patterns shifted significantly in Triplochyton scleroxylon and Pterocarpus soyauxii in both forest types (Raleigh p≤0.05). In other species such as Alstonei boonei, and Klainedoxa gabonensis, shifts in fruiting phenology occurred in the unlogged forest but not in the logged forest (Table 4).
Reproductive success: The reproductive success depends on the number of individuals that produced fruits and this varied depending on the site and the year. At the end of 40 months, the reproductive success was highest in the unlogged forest compared to the logged forest. Most species produced fruits in 2012 and 2013. However, the greatest reproductive success was observed in 2012 in the logged forest where approximately all the individuals (29) had matured fruits (Table 5).
Table 5: Reproductive success of logged and unlogged forest types in the East region of Cameroon.
PLOT 2011 2012 2013 2014
Logged Number of individuals without fruits 16 0 8 15
Number of individuals with fruits 13 29 21 14
Reproductive success (%) 44.8 100 72.4 48.3
Unlogged Number of individuals without fruits 18 1 3 8
Number of individuals with fruits 11 28 26 21
Table 2: Flowering pattern of some economically important species in logged and unlogged forest in the East region of Cameroon Site Variable T. superba M. altissima T. scleroxylon P. soyauxii E. cylindricum E. oblongum A. altissima P. macrocarpus K. gabonensis A. Boonei E. sauveolens Unlogged Mean Vector
(µ) 147.954° 221.399° 61.105° 152.385° 67.325° 332.795° 131.954° 357.229° 46.168° 219.54° 31.787° Concentration 0.778 0.822 0.773 0.682 0.943 0.739 0.413 0.371 1.921 0.287 0.304 Standard Error of Mean 20.383° 19.362° 20.51° 23.069° 17.065° 21.394° 37.437° 41.607° 9.433° 53.633° 50.736° Rayleigh (Z) 3.682 4.05 3.64 2.919 5.101 3.364 1.147 0.932 13.166 0.565 0.63 Probability (p) 0.024 0.016 0.025 0.053 0.005 0.033 0.32 0.397 0.001 0.573 0.537 Logged Mean Vector
(µ) 272.053° 238.169° 75.528° 25.185° 49.726° 211.896° - 12.305° 79.051° 7.77° 7.307° Concentration 0.26 0.868 0.745 1.194 0.917 0.551 - 0.752 0.865 0.829 0.834 Standard Error of Mean 58.091° 18.088° 20.851° 13.576° 17.202° 27.801° - 20.685° 18.161° 18.884° 18.77° Rayleigh (Z) 0.482 4.603 3.538 7.668 5.044 2.047 - 3.591 4.569 4.253 4.3 Probability (p) 0.621 0.009 0.028 0.001 0.006 0.129 - 0.026 0.009 0.013 0.012 -= absent, those in bold are significantly different.
Table 3: Synchronization index for the different species across the years
E. oblongum T. superba E. cylindricum E. sauveolens P. soyauxii K. gabonensis P. macrocarpus M. altissima A. boonei T. scleroxylon 2012 0.73 0.81 0.91 0.94 0.83 0.68 0.92 0.76 0.83 0.93
2013 0.85 0.63 0.93 0.8 0.87 0.81 0.87 0.72 0.67 0.83
2014 0.81 0.67 0.89 0 0.92 0.9 0 0.92 0 0.75
Table 4: Fruiting pattern of some economically important species in the East region of Cameroon Site Variable T. superba M. altissima T. scleroxylon P. soyauxii E. cylindricum E. oblongum altissi ma P. macrocarpus K. gabonensis A. Boonei E. sauveolens Unlogged Mean Vector (µ) 147.954° 221.399° 61.105° 152.385° 67.325° 332.795° 131.954 357.229° 46.168° 219.54° 31.787°
Concentration 0.778 0.822 0.773 0.682 0.943 0.739 0.413 0.371 1.921 0.287 0.304 Standard Error of Mean 20.383° 19.362° 20.51° 23.069° 17.065° 21.394° 37.437° 41.607° 9.433° 53.633° 50.736° Rayleigh (Z) 3.682 4.05 3.64 2.919 5.101 3.364 1.147 0.932 13.166 0.565 0.63 Probability (p) 0.024 0.016 0.025 0.053 0.005 0.033 0.32 0.397 0.001 0.573 0.537 Logged Mean Vector (µ) 272.053° 238.169° 75.528° 25.185° 49.726° 211.896° - 12.305° 79.051° 7.77° 7.307°
Concentration 0.26 0.868 0.745 1.194 0.917 0.551 - 0.752 0.865 0.829 0.834 Standard Error of Mean 58.091° 18.088° 20.851° 13.576° 17.202° 27.801° - 20.685° 18.161° 18.884° 18.77° Rayleigh (Z) 0.482 4.603 3.538 7.668 5.044 2.047 - 3.591 4.569 4.253 4.3 Probability (p) 0.621 0.009 0.028 0.001 0.006 0.129 - 0.026 0.009 0.013 0.012 -= no activity, those in bold are significantly different
Reproductive Phenology with respect to size classes: The oldest individuals produced more fruits than the younger ones. However, individuals in the 50-79 DBH size class produced fruits for a longer period than plants
of other size classes in both forest types. Flowering and fruiting occurred for a longer period in the unlogged compared to the logged forests (Fig. 7).
Flowering
ABALE 13873
0 90 180 270FRAKE 13851
0 90 180 270TALI 5230
0 90 180 270 loggedABALE 18868
0 90 180 270FRAKE 8606
0 90 180 270 TALI 18819 0 90 180 270 Unlogged FruitingABALE 13873
0 90 180 270FRAKE 13851
0 90 180 270TALI 5230
0 90 180 270 LoggedABALE 18868
0 90 180 270FRAKE 8606
0 90 180 270TALI 18819
0 90 180 270 unlogged Figure 7: Reproductive phenology pattern across the 50-79 cm DBH class. A year is divided into 3600 thus four monthsindicates 900. The lines (black and red) above the circle indicates the period and duration of the phenophase.
Petersianthus macrocarpus Petersianthus macrocarpus Terminalia superba Terminalia superba Terminalia superba Erythrophleum sauveolens Erythrophleum sauveolens Erythrophleum sauveolens Terminalia superba Erythrophleum sauveolens Petersianthus macrocarpus
The effect of the environmental factors on phenology between forest types: According to the Circular Vector Analysis, Pterocarpus soyauxii, Entandrophragma cylindricum, Eribroma oblongum and Triplochyton scleroxylon flowered during the beginning of the long dry season; Terminalia superba, Erythrophleum sauveolens, Klainedoxa gabonensis, Aningeria altissima and Petersianthus macropcarpus flowered during the period of the light rainy season; while Mansonia altissima and Alstonia boonei flowered during the period of the short dry season. Thus, most of the species began flowering at the end of the long dry season to the beginning of the short
dry season. This corresponds to the period of the light wet season. Flowering thus occurred when rainfall was lowest and there was a slight drop in temperature (Table 6). Most species correlated positively to rainfall in both forest types except Klainedoxa gabonensis and Mansonia altissima, which correlated negatively to rainfall in both forest types. However, Terminalia superba correlated negatively in the logged forest and positively in the unlogged forest to rainfall. Alstonia boonei and Erythrophleum sauveolens correlated positively in the logged forest and negatively in the unlogged forest to rainfall.
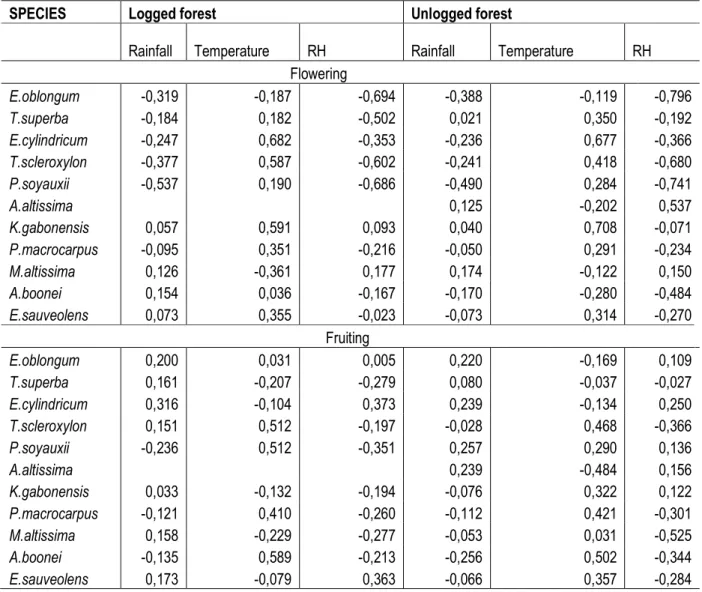
Table 6: Correlation of flowering and fruiting phenology of some economically important species with environmental parameters in the logged and unlogged plots of the forests of East Cameroon.
SPECIES Logged forest Unlogged forest
Rainfall Temperature RH Rainfall Temperature RH Flowering E.oblongum -0,319 -0,187 -0,694 -0,388 -0,119 -0,796 T.superba -0,184 0,182 -0,502 0,021 0,350 -0,192 E.cylindricum -0,247 0,682 -0,353 -0,236 0,677 -0,366 T.scleroxylon -0,377 0,587 -0,602 -0,241 0,418 -0,680 P.soyauxii -0,537 0,190 -0,686 -0,490 0,284 -0,741 A.altissima 0,125 -0,202 0,537 K.gabonensis 0,057 0,591 0,093 0,040 0,708 -0,071 P.macrocarpus -0,095 0,351 -0,216 -0,050 0,291 -0,234 M.altissima 0,126 -0,361 0,177 0,174 -0,122 0,150 A.boonei 0,154 0,036 -0,167 -0,170 -0,280 -0,484 E.sauveolens 0,073 0,355 -0,023 -0,073 0,314 -0,270 Fruiting E.oblongum 0,200 0,031 0,005 0,220 -0,169 0,109 T.superba 0,161 -0,207 -0,279 0,080 -0,037 -0,027 E.cylindricum 0,316 -0,104 0,373 0,239 -0,134 0,250 T.scleroxylon 0,151 0,512 -0,197 -0,028 0,468 -0,366 P.soyauxii -0,236 0,512 -0,351 0,257 0,290 0,136 A.altissima 0,239 -0,484 0,156 K.gabonensis 0,033 -0,132 -0,194 -0,076 0,322 0,122 P.macrocarpus -0,121 0,410 -0,260 -0,112 0,421 -0,301 M.altissima 0,158 -0,229 -0,277 -0,053 0,031 -0,525 A.boonei -0,135 0,589 -0,213 -0,256 0,502 -0,344 E.sauveolens 0,173 -0,079 0,363 -0,066 0,357 -0,284
Most species correlated positively to temperature in both forest types except Eribroma oblongum and Mansonia altissima that correlated negatively in both forest types. However, Alstonia boonei was positively correlated in the logged forest and negatively in the unlogged forest to temperature. Relative humidity on the other hand was negatively correlated in most species in both forest types except Klainedoxa gabonensis and Mansonia altissima that were positively correlated in both forest types (Table 6). Maximum fruiting on the other hand occurred in Entandrophragma cylindricum, Mansonia altissima, Aningeria altissima, Eribroma oblongum, Klainedoxa gabonensis, and Terminalia superba during the heavy wet season; while Pterocarpus soyauxii, Alstonia boonei, Erythrophleum sauveolens, Petersianthus macrocarpus and Triplochyton scleroxylon fruited during the beginning of the long dry season. Thus, most species produced fruits at the beginning of the short dry season and ended at the beginning of the long dry season. Fruiting occurred during the period of increased moisture as most of the species were positively correlated to rainfall (Table 6). Eribroma oblongum, Terminalia superba, and Entandrophragma cylindricum were positively correlated to rainfall in both forest types. Petersianthus macrocarpus and Alstonia boonei were negatively correlated to rainfall in both forest types. However, Klainedoxa gabonensis, Mansonia altissima and Erythrophleum sauveolens were positively correlated in the logged forest and negatively correlated in the unlogged to rainfall. Triplochyton scleroxylon, Pterocarpus soyauxii, Petersianthus macrocarpus, Alstonia boonei were positively correlated to temperature in both forest types. Terminalia superba and Entandrophragma cylindricum were negatively
correlated to temperature in both forest types. Exceptionally, Eribroma oblongum was positively correlated in the logged forest and negatively correlated to temperature in the unlogged forest. Klainedoxa gabonensis, Mansonia altissima and Erythrophleum sauveolens were negatively correlated in the logged forest and positively in the unlogged forest to temperature. Most species were negatively correlated with relative humidity in both forest types except Eribroma oblongum and Entandrophragma cylindricum, which were positively correlated in both forest types. Pterocarpus soyauxii and Klainedoxa gabonensis were negatively correlated in the logged forest and positively correlated in unlogged forest to relative humidity. Erythrophleum sauveolens was positively correlated in the logged forest and negatively correlated in unlogged forest to relative humidity (Table 6). Thus, generally, an increase in rainfall and relative humidity lead to an increase in flowering and fruiting in the logged forest and a decrease in the unlogged forest inErythrophleum sauveolens. In addition, Alstonia boonei and Eribroma oblongum increased in flowering and fruiting respectively with an increase in temperature in the logged forest and decreased in the unlogged forest. Flowering in Terminalia superba increased with a decrease in rainfall in the logged forest and increase in rainfall in the unlogged forest. Klainedoxa gabonensis, Mansonia altissima and Erythrophleum sauveolens decreased in fruiting with an increase in temperature in the logged forest and increase in unlogged forest. An increase in relative humidity in fruiting of Pterocarpus soyauxii and Klainedoxa gabonensis decreased in logged forest and increased in unlogged forest.
DISCUSSION
To the best of our knowledge, there have been very little or no comparable studies documenting the effects of selective logging on the phenology of timber species in the semi-deciduous tropical forest in the East region of Cameroon. The phenology of trees in the tropics is mainly determined by the duration and intensity of seasonal drought. The degree of drought to which trees are exposed varies widely, depending on temperature and availability of soil moisture and tree characteristics such as rooting depth. These characteristics are altered by selective logging. Our results indicate firstly that the period of flowering of each species was similar between forest types with different drought intensities and durations, suggesting that fixed precipitation levels and temperature did trigger flowering in these species. Secondly, fruiting was triggered by both proximate (such
as temperature, rainfall and relative humidity) and ultimate factors (such as competition for pollinators and pollinator attraction). According to Borchert, (1980), the reproductive growth of tropical species was primarily determined by endogenous periodic processes and in secondary plan, by adaptation to environmental changes. Several phenological studies have concluded that changes in water availability from shifts in precipitation regimes and soil moisture are the essential proximate causes affecting phenological patterns (Borchert 1980, 1983, 1994).
General flowering patterns in relation to environmental parameters: The significant difference in flowering between species has substantially different consequences for pollinators and other species that rely on these plants. This would lead to pollinator
specifications to particular species and satiation. Flowering started from the long dry season to the short dry season corresponding to the end of leaf flush and to a slight drop in temperature. This is due to the fact that flowering may be partly or wholly dependent on leafing activity (Van Schaik et al., 1993). Also Kikim and Yadava (2001) indicated in a subtropical forest that, in evergreen species, flowering mostly occurs after leaf flushing but deciduous and semi-deciduous species exhibited four basic patterns of flowering in relation to leaf flushing: (i) flowering before leaf flushing, ii) simultaneous flowering and leaf flushing as with Entandrophragma cylindricum (iii) flowering immediately after leaf flushing showed by a majority of the species such as Alstonia boonei and Terminalia superba (iv) flowering later after the leaf flushing as in Pterocarpus soyauxii and Triplochyton scleroxylon. Janzen (1967) indicated that the wet season is the major period for vegetative growth for most tropical species. This allows for temporal separation of reproductive activity and vegetative growth. According to Sakai et al. (2006), water stress is a major proximate cue for flowering during the dry season. If these factors postulated by Janzen (1967) and Sakai et al. (2006) are operating, then more species would flower during the periods of low rainfall than during the wet season. Fenner (1998) indicated that reproductive events generally occur during the period of low photosynthetic activities or after the period of high rates of reserve accumulation. Bawa et al. (2003) observed similar results in a tropical rainforest in Costa Rica; and Sakai et al. (2006) in seasonal tropical forests in Asia. A slight drop in temperature, which preceded flowering when rainfall was lowest, is an indication that temperature triggers flowering. Sakai et al. (1999) indicated that a proximal cue of the general flowering was suggested to be a drop of 2°C in daily temperature in a lowland Dipterocarp forest in Malaysia. However, species like Pterocarpus soyauxii, Entandrophragma cylindricum and Triplochyton scleroxylon flowered during heavy wet season (October-November). This was similar to results obtained by Batalha and Mantovani (2000) in a tropical forest in Brazil; Kikim and Yadava (2001) in subtropical forests in Manipur; and Frenedozo (2004) in a limestone mining spoil banks in Brazil who recorded flowering during the rainy season. Individual plants had a well-defined flowering peak or peaks. All flowering peaks were preceded by dry periods, and every drought was followed by a flowering. Thus, the main trigger to flowering was drought. This was further confirmed by the correlation between flowering and temperature in both forest types. In addition, the different plant species exhibited similar
patterns of flowering between forest types. This supports the view that they are responding to a common trigger. In the current study, there was strong synchronization between species and over time. Similar results were reported by Lobo et al. (2003) in seasonal forests in Mexico and Costa Rica and Sakai et al. (2006) in seasonal tropical forests in Asia. This may also be because there was no significant difference in the mean temperature over the study. The effects of climate change are usually confirmed after ten years of observation. We could therefore not relate observed phenology patterns to climate change. In addition, some studies have suggested that plant phenology is principally constrained by phylogenetic membership or life form (Wright and Caldero´n, 1995). This hypothesis supports the idea that phylogenetic constraints are stronger than local selective pressure, thus members of the same taxa should have similar phenological patterns regardless of geographical location (Kochmer and Handel, 1986). Results of the current study are consistent with this hypothesis. General fruiting patterns in relation to environmental parameters: Most species produced fruits from the heavy wet season to the beginning of the long dry season corresponding to the period of the end of the flowering, reduced temperature and increased moisture content. This ensures the availability of seeds to germinate into seedlings when there is sufficient moisture required for the natural regeneration of these species. This is similar to the results obtained by Kikim and Yadava (2001) in a subtropical forest in Manipur where the peak fruiting period of some understory and overstorey tress species was in the rainy season. In the current study, most species did not produce fruits yearly. This is characteristic of tropical species. In fact, Miller-Rushing and Inouye (2009) suggested that Delphinium nuttallianum plants that flower and fruit in one year often do not flower and fruit for the next one or two years. In many cases, fluctuations in fruit production are partly or mostly due to fluctuations in flower production. However, flowering occurred in all the years of study. Variation in fruit production may therefore be explained firstly by the lack of pollinators to pollinate the available flowers. Secondly, resource matching for instance plants and crops sizes vary simply in response to environmental variation. In this study, most species were positively correlated to rainfall and temperature. Seghieri et al. (1995) indicated that species with similar leaf phenology often differ in the timing of their flowering and fruiting. This variation in fruit production may also be due to genetic composition and age of the species; taking into consideration that most of the species had individuals but in the 50-79 DBH class. There appears to be ample
variation in reproductive output between individual plants, which, if consistently correlated with flowering time, could result in natural selection (Ollerton and lack, 1998). Thus fruiting was mostly triggered by the ultimate factors (such as genes, pollinator competition and pollinator attraction) and when moisture was highest. This can be further justified by the correlation between fruiting and rainfall in both forest types.
Phenology between forest types: Reproductive phenology was significantly different between forest types. A higher flowering in the unlogged than in the logged might be due to the high wind action prevalent in the logged forest thus destroying some of the flowers. Fruiting however was higher in the logged than in the unlogged forest. Logging reduces the number of trees by creating forest gabs. This increases the visibility of flowers that can easily be pollinated by pollinators. However, a higher reproductive success in the unlogged forest than in the logged forest at the end of the study period is an indication that selective logging had an influence on the phenology. Though fruiting was higher in the logged forest, they could also be easily destroyed by predators, thereby reducing the number of matured fruits. In the unlogged forests, these fruits are protected in the canopy reducing their visibility to predators. Similar results were obtained by Lobo et al. (2003) in seasonal forests in Costa Rica and Mexico. A higher reproductive success and a yearly production of fruits by Terminalia superba and Mansonia altissima in the unlogged forest might be due to less wind action, drought and mortality of these species in the unlogged forest. The high wind action in the logged forest may lead to the destruction of flowers. In addition, there may be lack of enough pollinators to pollinate all the few available flowers to form fruits after logging. Bawa et al. (2003) indicated that most dry-forest tree species are pollinated by a diverse range of bees that are seasonally abundant.
An increase in rainfall and relative humidity; and temperature of Erythrophleum sauveolens; and Alstonia boonei and Eribroma oblongum respectively lead to an increase in flowering and fruiting in the logged forest and
a decrease in the unlogged forest. Due to gab openings in the logged forest, high light intensity reduces the amount of soil moisture available for plant growth. In the unlogged forest, these conditions are already prevalent thus increasing the rainfall and relative humidity would lead to flooding and water saturation. This is confirmed by the fact that Klainedoxa gabonensis, Mansonia altissima and Erythrophleum sauveolens decreased in fruiting with an increase in temperature in the logged forest. However, in the logged forest, environmental conditions are highly unstable over time due to the gab formation. This therefore recommends Alstonia boonei and Eribroma oblongum for enrichment planting in forest gabs. These species are light demanders and have a moisture content of maximum 12% making it easy for these species to sustain dry conditions in the logged forest. Thus, an increase in temperature that is prevalent in the logged forest will increase the plant reproductive phenology. Plant phenology determinants have been previously decided to include abiotic factors such as temperature, rainfall, relative humidity and precipitation and biotic factors such as herbivore, predation, competition, pollination and dispersers (Aide et al., 1995). While these determinants are intact in unlogged forests, they are destabilized by logging.
Phenology between plant sizes: Plant size is usually considered a predominantly environmentally influenced characteristic, determined by plant age and growing conditions, though not often tested (Waller, 1988). It is normally closely correlated with total flower production and the largest plants in a population are usually the most fecund (Weiner 1988; Herrera 1993). Plants with more flowers consistently produced greater numbers of fruit. This is consistent with the results of the current study where the largest individuals produced more fruits than the smaller ones and larger plants flowered for a longer period giving more fruits than the younger individuals (Schmitt, 1983). This is similar with the studies of McIntosh, (2002) in two sister species of Ferocactus; and Ollerton and Lack (1998) in the study of the flowering phenology of Lotus corniculatus.
CONCLUSION
The findings of this study suggest that closely related species might respond quite differently to future climate change, depending on how climate variables change relative to one another. The results also suggest that there is a strong seasonality in phenological pattern of tree species in the tropical forest ecosystems. The phenological timing of most of the species seems to be set during the transition of long dry and heavy wet
seasons so that rainfall facilitates recruitment of plants through germination. Results from this study indicate that while the biotic determinants of phenology are intact in unlogged forests, they are destabilized by selective logging causing an alteration in plant species. This calls for a longer period of phenological observation to better determine to what extent selective logging affects the
phenology of timber species and careful selection of species used for enrichment planting. ACKNOWLEDGEMENT
Funding for the fieldwork was supported by the International Tropical Timber Organization (ITTO) grant, IDEA WILD grant for equipments, Ministry of Higher Education (MINESUP) mobility grant, the Ministry of Higher Education (MINESUP) research modernization allowance and the Fako America Scholarship. We would also like to thank Mr Bekolo Bekolo and Mr Njombe Ewusi
of the National Forestry Agency (ANAFOR) for introducing me to the timber companies, Mr Decolvenaere of SFIL-GVI for allowing us use his forest concessions. I also thank Mr Bounoungou Zibi for field supervision; Mr, Njoh Jean and Mr Nakoe Roger for field assistance and the staff of the forest company SFIL-GVI Ndeng.
REFERENCES
Aide TM, Zimmerman, J.K.; Herrera, L.; Rosario, M. and Serrano, M., 1995. Forest recovery in abandoned tropical pastures in Puerto Rico. Forest ecology and management, 77: 77-86. Appanah S, 1993. Mass flowering of Dipterocarp forests
in the aseasonal tropics. Journal of Biosciences 18: 457-474.
Ausı´n I, Alonso-Blanco C, Martı´nez-Zapater, M, 2005. Environmental regulation of flowering. International Journal of Developmental Biology 49, 689–705. (doi:10.1387/ijdb.052022ia). Batalha MA. and Mantovani, W., 2000. Reproductive
phenology patterns of cerrado plant species at the Pé-de-Gigante Reserve (Santa Rita do Passa Quatro, SP? Brazil): a comparism between the herbaceous and woody floras. Revista. Brasileira De. Biologica. 60, 1-12. Bawa KS, 1983. Patterns of flowering in tropical plants.
Pp. 394–410. In: Jones, C. E. and Little, R. J. (eds), Handbook of Experimental Pollination Biology. Scientific and Academic Editions, U.S.A.
Bawa KS, Kang H, Grayum MH, 2003. Relationships among time, frequency, and duration of flowering in tropical rain forest trees. American Journal of Botany 90(6): 877–887. 2003. Borchert R, 1980. Phenology and ecophysiology of
tropical trees: Erythrina poeppigiana O.F Cook. Ecology, 61 1065-1074.
Borchert R, 1994. Water status and development of tropical trees during seasonal drought. Trees 8:115-125.
Borchert R, 1983. Phenology and control of flowering in tropical trees. Biotropica 15: 81–89.
Cochrane M, 2003. Fire science for rainforests. Nature 421 (6926): 913–919. doi:10.1038/nature01437. Fener M, 1998. The phenology of growth and reproduction in plants. Perspectives in plant
Ecology, Evolution and Systematics Vol1:1 78-91.
Fitzpatrick M, 2002. Cameroon," Lonely Planet West Africa, 5th ed. China: Lonely Planet Publications Pty Ltd.
Forrest J, and Miller-Rushing AJ, 2010. Towards a synthetic understanding of the role of phenology in ecology and evolution. Philosophical. Transactions of the Royal Society Biological
sciences 365, 3101–3112
doi:10.1098/rstb.2010.0145.
Frankie GW, Haber WA, Opler PA, and Bawa KS, 1983. Characteristics and organization of the large bee pollination system in the Costa Rican dry forest. In C. E. Jones and R. J. Little [eds.], Handbook of experimental pollination biology, 411–448. Van Nostrand Reinhold, New York, New York, USA.
Frenedozo R, 2004. Plant Reproductive Phenology and Dispersal Patterns After Natural Regeneration in a Limestone Mining Spoil Banks. Brazilian archives of Biology and technology, 47(2):261-271. ISSN 1516-8913.
Herrera CM, 1993. Selection on floral morphology and environmental determinants of fecundity in a hawk moth-pollinated violet. Ecol. Monogr. 63: 251–275
Janzen D, 1967. Synchronization of sexual reproduction of trees within the dry season in Central America. Evolution 21: 620–637.
Keatley M, 2000. Influences on the flowering phenology of three Australian Eucalyptus. Proceedings of ICB-ICUC’99, Sydney, WMO/TD No 1026, Geneva.
Kikim A and Yadava PS, 2001. Phenology of tree species in subtropical forests of Manipur in north eastern India. Tropical Ecology 42(2): 269-276, 2001. ISSN 0564-3295.
Kochmer JP and Handel SN, 1986. Constraints and competition in the evolution of flowering phenology. Ecological Monographs 56: 303– 325.
Koelmeyer K, 1959. The periodicity of leaf change and flowering in the principal forest communities of Ceylon. Ceylon Forest, 4:157–189.
Kovach WL, 2011. Oriana – Circular Statistics for Windows, ver. 4.Kovach Computing Services, Pentraeth, Wales, U.K.
Lobo JA, Quesada M, Stoner KE, Fuchs EJ, Herreri´AS-Diego Y, Rojas J, Sabori´o G, 2003. Factors affecting phenological patterns of bombacaceous trees in seasonal forests in Costa Rica and Mexico. American Journal of Botany 90(7): 1054–1063. 2003.
Matricardi EA, Skole D, Cochrane M, Qi J, Chomentowski W, 2005. Monitoring selective logging in tropical evergreen forests using Landsat: Multitemporal regional analyses in Mato Grosso, Brazil. Earth Interactions, 9 (25): 1–24. doi:10.1175/EI142.1. McIntosh ME, 2002. Flowering phenology and reproduction output in two sister species of Ferocactus (Cactaceae). Plant Ecology, 159: 1-13.
Miller-Rushing AJ and Inouye DW, 2009. Variation in the impact of climate change on flowering phenology and abundance: an examination of two pairs of closely related wildflower species. American Journal of Botany 96(10): 1821–1829. Morellato LPC, and Haddad FB, 2000. The Brazilian
Atlantic Forest. Biotropica special issue Vol. 32, No 4b. In Parmesan, C., Galbraith H. (2004). Observed Impacts of global climate change in the US., 56pp, Pew Center on Global Climate Change, Arlington, VA.
Murali KS and Sukumar R, 1994. Reproductive phenology of a tropical dry forest in Mudumalai, southern India. Journal of Ecology, 82, 759–767. Olander L, Bustamante M, Asner G, Telles E, Prado Z, Camargo P, 2005. Surface soil changes following selective logging in an Eastern Amazon forest. Earth Interactions 9 (4): 1–19. doi:10.1175/EI135.1.
Ollerton J and Lack A, 1998. Relationships between flowering phenology, plant size and reproductive success in Lotus corniculatus (Fabaceae). Plant Ecology 139: 35–47, 1998.
Ray D, Nepstad D, and Paulo M, 2005. Micrometeorological and canopy controls of fire susceptibility in a forested amazon landscape.
Ecological Applications 15 (5): 1664–1678. doi:10.1890/05-404.
Sakai S, Momose K, Yumoto T, Nagamitsu T, Nagamasu H, Hamid AA, Nakashizuka T, 1999. Plant reproductive phenology over four years including an episode of general flowering in a lowland dipterocarp forest, Sarawak, Malaysia. American Journal of Botany, 86, 1414-1436 Sakai S, Rhett DH, Momose K, Kuraji K, Nagamasu H,
Yasunari T, Chong L, Nakashizuka T, 2006. Irregular droughts trigger mass flowering in aseasonal tropical forests in Asia. American Journal of Botany 93(8): 1134–1139.
Schmitt J, 1983. Individual flowering phenology, plant size, and reproductive success in Linanthus androsaceus, a California annual. Oecologia 59: 135–140.
Seghieri J, Floret C, Pontanier R, 1995. Plant phenology in relation to water availability: herbaceous and woody species in the savannas of northern Cameroon. Journal of Tropical Ecology 11: 237– 254.
Singer BR, and Sazima M, 2001. Flower morphology and pollination mechanism in three sympatric Goodyerinae Orchids from South Brazil. Ann. Bot. 88, 989-997.
Singh JS, and Singh VK, 1992. Phenology of seasonally dry tropical forest. Current Science 63: 684-688. Sun C, Kaplin BA, Kristensen KA, Munyallgoga V, Mvuklyumwami J, Kajonda KK, Moermond TC, 1996. Tree phenology in a tropical montane forest in Rwanda. Biotropica 28: 668-681. Van Schaik CP, Terborgh JW, Wright SJ, 1993. The
phenology of tropical forests: adaptive significance and consequences for primary producers. Annual Review of Ecology and Systematics 24: 353–377.
Visser ME, Caro SP, van Oers K, Schaper SV, Helm B, 2010. Phenology, seasonal timing and circannual rhythms: towards a unified framework. Philosophical Transactions of the Royal Society Biological Sciences 365, 3113– 3127. (doi:10.1098/rstb. 2010.0111)
Waller DM, 1988. Plant morphology and reproduction. Pp. 203– 227. In: Doust, J. L. and Doust, L. L. (eds), Plant Reproductive Ecology – Patterns and Strategies. Oxford University Press, Oxford. Weiner J, 1988. The influence of competition on plant reproduction. Pp. 228-245. In: Doust, J. L. and Doust, L. L. (eds), Plant Reproductive Ecology –
Patterns and Strategies. Oxford University Press, Oxford.
Wright SJ, and Calderon O, 1995. Phylogenetic patterns among tropical flowering phenologies. Journal of Ecology 83: 937–948.
Young T, Hubbell S, 1991. Crown Asymmetry, Treefalls, and Repeat Disturbance of Broad-Leaved Forest Gaps. Ecology 72 (4): 1464–1471. doi:10.2307/1941119