Multi-State Trials of Bt Sweet Corn Varieties for Control of the Corn
Earworm (Lepidoptera: Noctuidae)
A. M. SHELTON,1,2D. L. OLMSTEAD,1E. C. BURKNESS,3W. D. HUTCHISON,3G. DIVELY,4
C. WELTY,5
ANDA. N. SPARKS6
J. Econ. Entomol. 106(5): 2151Ð2159 (2013); DOI: http://dx.doi.org/10.1603/EC13146
ABSTRACT Field tests in 2010 Ð2011 were performed in New York, Minnesota, Maryland, Ohio, and Georgia to compare Bt sweet corn lines expressing Cry1A.105⫹ Cry2Ab2 and Cry1Ab with their non-Bt isolines, with and without the use of foliar insecticides. The primary insect pest in all locations during the trial years was Heliocoverpa zea (Boddie), which is becoming the most serious insect pest of sweet corn in the United States. At harvest, the ears were measured for marketability according to fresh market and processing standards. For fresh market and processing, least squares regression showed signiÞcant effects of protein expression, state, and insecticide frequency. There was a signiÞcant effect of year for fresh market but not for processing. The model also showed signiÞcant effects of H. zea per ear by protein expression. Sweet corn containing two genes (Cry1A.105⫹ Cry2Ab2) and a single gene (Cry1Ab) provided high marketability, and both Bt varieties signiÞcantly outperformed the traditional non-Bt isolines in nearly all cases regardless of insecticide application frequency. For pest suppression of H. zea, plants expressing Bt proteins consistently performed better than non-Bt isoline plants, even those sprayed at conventional insecticide frequencies. Where com-parisons in the same state were made between Cry1A.105⫹ Cry2Ab2 and Cry1Ab plants for fresh market, the product expressing Cry1A.105⫹ Cry2Ab2 provided better protection and resulted in less variability in control. Overall, these results indicate Cry1A.105⫹ Cry2Ab2 and Cry1Ab plants are suitable for fresh market and processing corn production across a diversity of growing regions and years. Our results demonstrate that Bt sweet corn has the potential to signiÞcantly reduce the use of conventional insecticides against lepidopteran pests and, in turn, reduce occupational and environ-mental risks that arise from intensive insecticide use.
KEY WORDS Bt plant, maize, genetic engineering, Lepidoptera, insecticide reduction
Genetically engineered insect-resistant crops have revolutionized insect pest management (Shelton et al. 2002) and have become a major tool for integrated pest management (IPM) programs (Romeis et al. 2008). The commercial production of crops expressing insecticidal crystal (Cry) proteins from Bacillus thu-ringiensis (Bt plants) is rightly considered another form of host plant resistance, which is a cornerstone of IPM (Kennedy 2008). In 2011, Bt Þeld corn and cotton, the only commercialized Bt crops, were grown on⬇70 million ha in 26 countries (James 2012). Bt crops have provided economic beneÞts to growers and reduced the use of other insecticides (Shelton et al. 2002, Qaim et al. 2008, Kathage and Qaim 2012, Lu et
al. 2012), suppressed pest populations on a regional basis (Carrie`re et al. 2003, Wu et al. 2008, Hutchison et al. 2010), conserved natural enemies (Naranjo 2009), and promoted biological control services in agricultural landscapes (Lu et al. 2012). However, it is unfortunate that the beneÞts of Bt crops have largely not been realized for vegetables. With their diverse set of insect pests and the low tolerance for insect injury, vegetables have traditionally been insecticide-inten-sive managed crops. Statistics for insecticide use worldwide are combined for vegetables and fruits (45% of total insecticide value), but if vegetables were conservatively estimated to equal half of this total (22.5%), the insecticide use for vegetables would ex-ceed that for corn (7.6%) plus cotton (14.1%) (Shelton 2012).
Bt vegetables have had a difÞcult and complex his-tory (Shelton 2012), and the only one that is presently commercially available is sweet corn for control of Lepidoptera. The development of Bt sweet corn va-rieties was facilitated because companies had al-ready developed genetically engineered parent lines (events) expressing Bt proteins for Þeld corn, a crop with a much larger market. The Þrst Bt sweet corn
1Department of Entomology, Cornell University, 630 W. North St.,
New York State Agricultural Experiment Station, Geneva, NY 14456.
2Corresponding author, e-mail: [email protected].
3Department of Entomology, University of Minnesota, 1980 Fowell
Ave., St. Paul, MN 55455.
4Department of Entomology, University of Maryland, 8082
Balti-more Ave., College Park, MD 20740.
5Department of Entomology, Ohio State University, 2501 Carmack
Rd., Columbus, OH 43210.
6Department of Entomology, University of Georgia, 4604 Research
Way, Tifton Campus, Tifton, GA 31793.
variety, Attribute, was introduced into the North American market in 1998 by Novartis Seeds and was developed by traditional breeding with event Bt 11 Þeld corn, which expresses Cry1Ab and had already been registered in 1996 (Hellmich et al. 2008). By 1999, Bt sweet corn was grown on⬎30,000 acres in the United States (Plaisted 2003) but then became caught up in the antibiotech fervor and was grown on⬍3,000 acres in 2000. The area planted to Bt sweet corn has since increased and several Attribute hybrids for fresh market and processing are now marketed by Syngenta Seeds. It continues to provide excellent control of the European corn borer, Ostrinia nubilalis (Hu¨bner), but lesser control of the fall armyworm, Spodoptera fru-giperda(Smith), and corn earworm, Helicoverpa zea (Boddie), when they are present in high numbers (see review by Shelton 2012). Lack of control of H. zea is an increasing concern because this migratory insect is arriving earlier and in higher numbers into the north-ern United States where much of the processing and fresh market sweet corn is grown (A.M.S. and D.L.O., unpublished data).
As with Bt cotton and Bt Þeld corn, the trend in Bt crop technology is to use multiple Bt toxins in sweet corn to enhance performance across a range of pest species. For example, trials conducted in Maryland and Minnesota under high H. zea pressure have shown superior control with sweet corn expressing both Cry1Ab (Bt 11 event) and the vegetative insecticidal protein VIP3A (MIR 162 event), compared with an Attribute hybrid based on the Bt 11 event only (Burk-ness et al. 2010). In 2011, MonsantoÕs vegetable seed company (Seminis) received U.S. federal registration for sweet corn varieties concurrently expressing Cry1A.105 and Cry2Ab2 derived by traditional breed-ing with the Þeld corn event MON 89034 (these hy-brids also express resistance to corn rootworm, Dia-broticaspp., because they contain event MON88017). Cry1A.105 is a chimeric protein that consists of do-mains from Cry1Ab, Cry1Ac, and Cry1 F (Hellmich et al. 2008). In 2012, three hybrids for fresh market were commercially sold under the Performance Series trade name.
The objective of the current study was to compare the performance of sweet corn varieties expressing Cry1A.105 and Cry2Ab2 with a variety expressing only Cry1Ab and to compare both with their non-Bt iso-lines with and without the use of foliar insecticides. To provide a more comprehensive comparison, trials were conducted in Þve states over a 2-yr period.
Materials and Methods
Data were collected from study sites in New York (NY), Minnesota (MN), Maryland (MD), Ohio (OH), and Georgia (GA) using similar test protocols and local agronomic practices to test the efÞcacy of newly developed Bt sweet corn varieties against the corn earworm, H. zea, and to compare harvest yields for fresh market and processing uses. Bt sweet corn va-rieties were compared with their non-Bt isolines un-der different insecticide regimes. At harvest, the ears
were measured for marketability, based on insect in-jury caused by H. zea (other Lepidoptera were neg-ligible in the trial, and there was no evidence of injury by Diabrotica spp. or other species). If an ear was undamaged, it was considered suitable for fresh mar-ket sale. The marmar-ket standards for fresh marmar-ket sweet corn require no insect injury or presence of an insect, while injury to the tip of the ear or presence of early instar H. zea may be acceptable for processing sweet corn, as the tip is removed during normal processing. However, if injury to the ear is not conÞned to the tip or includes boring into the ear, the ear will not be allowed for either market. Farmers normally grow sweet corn for one market, and the processing market provides a much lower return to farmers than the fresh market. In this study, the same ears were measured for both markets to help determine which practices would be acceptable to each. If the damage was con-Þned to the tip of the ear, which would be removed regardless of any injury during normal processing, then the entire ear was considered acceptable for processing. Any damage to the middle or butt of the ear was considered unacceptable for either market. In addition to ear damage, the number of H. zea larvae found on the ears was recorded.
Sweet Corn Varieties. Two varieties of Seminis
Per-formance Series sweet corn, each expressing the same Bt proteins Cry1A.105 and Cry2Ab2 (ÔObsession IIÕ and ÔPassion IIÕ), were compared with their respective non-Bt isoline varieties (ÔObsessionÕ and ÔPassionÕ) (Seminis Vegetable Seeds, Inc., St. Louis, MO). A third variety of Bt sweet corn expressing only the Cry1Ab toxin, Attribute Insect Protection (Syngenta Crop Protection, Greensboro, NC), was also compared with Cry1A.105⫹ Cry2Ab2 and non-Bt isoline varieties in certain states and years. In 2010, Bt and non-Bt Passion were planted in GA and MN, while Bt and non-Bt Obsession were planted in MD, NY, and OH. In 2011, Bt and non-Bt Obsession were planted in GA, MD, NY, and OH, while Bt and non-Bt Passion were planted in MN. In 2011, all states except MN and OH planted a second Bt sweet corn variety (Attribute). In 2011, a second Bt line producing only Cry1Ab (BC0805) was added. For the purposes of analysis and discussion, Bt varieties of Obsession and Passion were collectively termed Cry1A.105⫹ Cry2Ab2; Attribute and ÔBC0805⬘ were identiÞed as Cry1Ab, and conventional varieties were referred to as non-Bt isolines.
Study Procedures. This study compared the
perfor-mance of Cry1A.105⫹ Cry2Ab2 and Cry1Ab varieties with non-Bt isoline varieties using “conventional” and “reduced” insecticide application frequencies as well as a “no spray” treatment. Investigators in each state chose the spray frequency and insecticide based on their experience with local conditions and manage-ment practices. For example, a conventional insecti-cide program in NY was deÞned as two maximum label rate applications of a pyrethroid insecticide per week and a reduced rate insecticide program was one max-imum label rate application of a pyrethroid insecticide per week during the silking period. These application parameters are consistent with typical management
practices in NY. Management practices, pest pressure, and growing conditions vary from state to state and investigators deÞned the criteria for each classiÞcation (conventional and reduced) according to their loca-tion. H. zea migrates to the northeast in mid to late summer. For this reason, trials were purposely planted at a later date in the growing season to ensure good infestations in our treatment plots.
Trials in NY were conducted at the Fruit and Veg-etable Research Farm at Cornell UniversityÕs New York State Agricultural Experiment Station, Geneva, NY. In 2010 and 2011, a randomized complete block experimental design with four replications was used. Plots consisted of four rows 4 m in length separated by two untreated rows of non-Bt isoline plants. In 2010, corn was planted on 13 July. Each plot (variety) re-ceived either no insecticidal sprays or Warrior II ( -cyhalothin, Syngenta Crop Protection) applied four (reduced program) or eight times (conventional pro-gram) beginning at the early silk stage at the rate of 140.5 ml/ha. Sprays were applied using a Þve-row CO2
pressurized Hagie 200 High-Boy tractor with three nozzles per row (one over the top and one drop nozzle on each side aimed at the ear zone) equipped with ßat fan 11,003 tips, delivering 397 liters/ha at 2.76 bars and a speed of 3.2 km/h. The adjuvant Dyne-Amic (Hel-ena Chemical Co, Collierville, TN) was added to all treatments at 1.0% vol:vol. Twenty-Þve ears per plot were harvested on 25 October 2010 and measured for lepidopteran feeding. In 2011, the same protocol was used with corn planted on 29 June, and 25 ears per plot were harvested and measured on 29 September 2011. Trials in MN were conducted at the University of Minnesota Rosemount Experiment Station, Rose-mount, MN. In 2010 and 2011, a randomized complete block experimental design with four replications was used. In both years, plots consisted of four rows 7.6 m in length separated by 3 m fallow alleys. In 2010, corn was planted on 28 June and Warrior II was applied four times at a rate of 140.5 ml/ha. Sprays were applied using a CO2backpack sprayer with a 3 m boom and
6-Teejet 8002 ßat fan nozzles, over the top of the rows, delivering 233.8 liters/ha at 2.42 bars and a speed of 3.9 km/h. A second treatment was left unsprayed. Twenty ears per plot were harvested on 3 September 2010 and measured for lepidopteran damage. In 2011, corn was planted on 27 June, and Warrior II was applied four times after silking began using the same protocol for insecticide application as in 2010. A second treatment was left unsprayed. Twenty ears per plot were har-vested on 12 September 2011 and measured for lepi-dopteran damage.
Trials in MD in 2010 were planted on 18 June at the Wye Research and Education Center, Queenstown, MD, and on 12 June at the Lower Shore Research and Education Center, Salisbury, MD. At both locations, two hybrids (Obsession and ÔObsession BtÕ) and three treatment regimens (untreated, 2-d schedule, and 4-d schedule) were measured in a 2 by 3 split-plot design with four randomized blocks. Plots measured four rows 30 m long and were separated by buffer rows of Obsession or bare ground areas. Sprays of Warrior II
(142 ml/ha) plus Lannate (methomyl, DuPont, Wil-mington, DE) (1.8 liters/ha) were applied with a trac-tor-driven hydraulic sprayer at Queenstown, deliver-ing 946 liters/ha at 6.89 bars over the canopy. At Salisbury, treatments were applied with a self-pro-pelled high clearance sprayer delivering 473 liters/ha at 4.17 bars. Samples of 100 ears from each subplot were harvested at both locations in late August to measure ear damage. In 2011, trials were planted in mid-June at the Central Maryland Research and Education Center, Beltsville, MD, and Wye Research and Education Center, Queenstown, MD. At both locations, only one replicate of three hybrids (Obses-sion, Obsession Bt, and BC0805 that produced only Cry1Ab) was established in side-by-side blocks mea-suring 16 rows 50 m long. Each block was split into two subplots, one receiving two to Þve applications after silking began and the other untreated. Warrior II plus Lannate was applied at the same rate, spray volume, and application method used in 2010. Samples of 200 ears from each Bt subplot and 50 ears from the Ob-session subplots were harvested on 26 August at Queenstown and on 6 September at Beltsville for mea-surement of lepidopteran damage.
Trials in OH were conducted at the Ohio Agricul-tural Research and Development Center (OARDC) Research Station at Fremont. In 2010 and 2011, a split-plot design was used with insecticide treatment as the main plot factor, and the Bt trait as the subplot factor, and four replications were used. In 2010, corn was planted on 15 July, and plots were four rows 3.7 m in length. Warrior 1 SC (246 ml/ha) was applied in the conventional treatment Þve times at 4-d intervals after silking began, and in the reduced treatment three times at 6-d intervals, and a third treatment was left unsprayed. Treatments were applied using a Rears model PK200 mounted sprayer with two nozzles per row (8004 VS ßat fan nozzle), straight boom above plants (no drop pipes), 622.9 liters/ha at 6.89 bars. Ten ears were harvested from subplots on 30 September 2010. In 2011, corn was planted in unreplicated large plots on 29 June. Plots were 12 rows by 61 m in length. Coragen (E. I. du Pont de Nemours, Wilmington, DE) and Hero (FMC Corporation, Philadelphia, PA) were applied (225 ml/ha and 411 ml/ha, respectively) twice in Bt plots and Þve times in the isoline plot after silking began. Methylated seed oil (MSO) was added at a 0.5% vol:vol ratio to Coragen and a nonionic surfactant (NIS) was added at a 0.25% vol:vol ratio to Hero. Treatments were applied using a Rears model PK200 mounted sprayer with two nozzles per row (8004 VS ßat fan nozzle), straight boom above plants (no drop pipes), 588.4 liters/ha at 6.89 bars. One hundred ears were harvested from plots on 9 September 2011.
Trials in GA were conducted at the University of Georgia, Tifton Campus Horticulture Farm in 2010 and 2011. In 2011, a second site was added at the Attapulgus Research and Education Center, Attapul-gus, GA. In 2010, a split-plot experimental design with four replications was planted on 9 June. Plots consisted of two rows 4 m in length and separated by two fallow rows. Radiant SC (Dow Agrosciences, Indianapolis,
IN) alone (385 ml/ha) or in combination with Warrior II (280 ml/ha) was used as insecticide treatments and applied Þve or nine times after silking began. A third treatment was left unsprayed. Sprays were applied with a two row tractor-mounted sprayer with three nozzles per row (one over the top and one drop nozzle on each side aimed at the ear zone) equipped with TX-12 hollow cone nozzles, delivering 670 liters/ha at 2.76 bar at a speed of 4.8 km/h. Ten ears were har-vested from plots on 9 August 2010 and measured for caterpillar damage. In 2011, a randomized complete block design with four replications was planted on 18 August (Tifton) and 23 August (Attapulgus). Plots consisted of four rows 9.14 m in length and separated by two fallow rows. In both tests, the three sweet corn varieties were grown with and without insecticide treatments. Warrior II was applied three times on a 7-d schedule after silking began. Sprays in Tifton were applied as in 2010. Sprays in Attapulgus were applied with a two row Lee Spider sprayer with two nozzles per row (broadcast application) equipped with 8,002 nozzles, delivering 140 liters/ha at 2.76 bar at a speed of 5.63 km/h. Twenty-Þve ears were harvested from plots and measured for lepidopteran damage on 24 and 31 October in Tifton and Attapulgus, respectively.
Statistical Analysis. Three separate least-squares
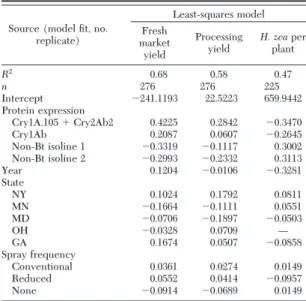
re-gression models (JMP 10.0 for Macintosh, SAS Insti-tute, Cary, SC) were calculated using percent of fresh market yield, percent of processing yield, and H. zea per ear as dependent variables. In each model, inde-pendent variables were Bt protein, year, state, and spray frequency (Table 1). The purpose of using least squares regression in this study was to determine the effect of independent variables on each of the depen-dent variables measured (Table 2). To measure dif-ferences within and between states for fresh market and processing yields and H. zea per ear, analysis of
variance (ANOVA) and Tukey honestly signiÞcant difference (HSD) means separation tests were used (JMP 10.0 for Macintosh, SAS Institute) (Tables 3Ð5). Fresh market yield and processing yield proportions were arcsine square root transformed to achieve nor-mality for least squares regression, ANOVA, and Tukey HSD. Untransformed proportional data con-verted to fresh market and processing yield percent-ages (Tables 3 and 4) and H. zea per ear (Table 5) are reported. Transformation was not necessary for H. zea per ear data.
Results
Fresh Market Harvest. Least squares regression for
fresh market yield resulted in an R2value of 0.68 (n⫽
276), suggesting the factors involved had signiÞcant effects on the model (Table 1). The model showed signiÞcant effects on fresh market corn yields for pro-tein expression (F⫽ 147.66; df ⫽ 3; P ⬍ 0.0001), year (F⫽ 9.62; df ⫽ 1; P ⫽ 0.0021), state (F ⫽ 12.07; df ⫽ 4; P⬍ 0.0001), and insecticide frequency (F ⫽ 7.68; df⫽ 2; P ⫽ 0.0006) (Table 2).
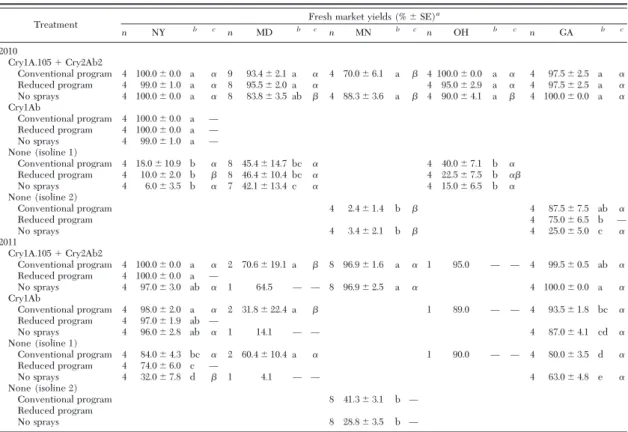
In 2010, Cry1A.105⫹ Cry2Ab2 expression signiÞ-cantly improved yields at all insecticide frequencies in NY, MD, MN, and OH compared with non-Bt isolines at the same insecticide frequency (Table 3). For GA there were signiÞcant differences only for the reduced spray and no-spray programs. Cry1Ab plants were only measured in NY, and they produced signiÞcantly higher yields at all spray frequencies compared with the non-Bt isoline treatments, but were not signiÞ-cantly different from the Cry1A.105 ⫹ Cry2Ab2 plants.
In 2011 in NY, MN, and GA, there were signiÞcant yield improvements regardless of insecticide fre-quency in Cry1A.105 ⫹ Cry2Ab2 plants compared with non-Bt isoline treatments (Table 3). In GA, Cry1Ab plants sprayed at the conventional insecticide frequency had signiÞcantly higher yields than the non-Bt isoline at either conventional spray frequency or no sprays. In Cry1A.105⫹ Cry2Ab2, Cry1Ab, and non-Bt isoline treatments receiving conventional in-secticide intervals in MD, no signiÞcant differences were detected in yield. However, numerically higher Table 1. Least-squares regression parameters for three models
constructed using multi-state data collected from Bt sweet corn trials in 2010 and 2011
Source (model Þt, no. replicate) Least-squares model Fresh market yield Processing yield H. zeaper plant R2 0.68 0.58 0.47 n 276 276 225 Intercept ⫺241.1193 22.5223 659.9442 Protein expression Cry1A.105⫹ Cry2Ab2 0.4225 0.2842 ⫺0.3470 Cry1Ab 0.2087 0.0607 ⫺0.2645 Non-Bt isoline 1 ⫺0.3319 ⫺0.1117 0.3002 Non-Bt isoline 2 ⫺0.2993 ⫺0.2332 0.3113 Year 0.1204 ⫺0.0106 ⫺0.3281 State NY 0.1024 0.1792 0.0811 MN ⫺0.1664 ⫺0.1111 0.0551 MD ⫺0.0706 ⫺0.1897 ⫺0.0503 OH ⫺0.0328 0.0709 Ñ GA 0.1674 0.0507 ⫺0.0858 Spray frequency Conventional 0.0361 0.0274 0.0149 Reduced 0.0552 0.0414 ⫺0.0957 None ⫺0.0914 ⫺0.0689 0.0149
Table 2. Outcome of effects tests within each of three least-squares regression models
Model Statistic Protein Year State Insecticidefrequency
Fresh market yield Pvalue ⬍0.0001* 0.0021* ⬍0.0001* 0.0006* df 3 1 4 2 Sum of squares 32.91 0.71 3.59 7.68 F ratio 147.66 9.62 12.07 7.68 Processing yield Pvalue ⬍0.0001* 0.7380 ⬍0.0001* 0.0016* df 3 1 4 2 Sum of squares 11.21 0.01 4.53 0.65 F ratio 76.22 0.11 23.10 6.62 H. zeaper plant Pvalue ⬍0.0001* ⬍0.0001* 0.1015 0.0917 df 3 1 3 2 Sum of squares 20.91 3.85 0.98 0.75 F ratio 44.84 24.77 2.10 2.42 *SigniÞcant effect.
yields were obtained from unsprayed plants express-ing Cry1A.105⫹ Cry2Ab2 (64.5%) compared with the non-Bt isoline (4.1%). In OH, there were not large numerical differences (i.e., 6.0%) in yields between Cry1A.105 ⫹ Cry2Ab2, Cry1Ab, and non-Bt isoline plants when they were sprayed conventionally.
In 2010 for Cry1A.105⫹ Cry2Ab2 treatments across all states, MN had signiÞcantly lower yields at the conventional insecticide frequency than NY, MD, OH, and GA (Table 3). Plants that received no insecticide sprays had signiÞcantly higher yields in NY and GA compared with MD, MN, and OH. Among non-Bt isoline treatments, reduced sprays in NY produced signiÞcantly lower yields compared with MD (Table 3).
In 2011, yields for Cry1A.105⫹ Cry2Ab2 treatments in a conventional spray program wereⱖ95% for NY, MN, and OH, but MD was signiÞcantly lower at 70.6% (Table 3). Cry1Ab plants producedⱖ96% yield in NY regardless of spray program, but resulted in a signif-icant reduction to 31.8% in MD under a conventional spray program.
Processing Harvest. Least squares regression for
processing yield resulted in an R2value of 0.58 (n⫽
276), suggesting the factors had signiÞcant effects on the model (Table 1). The model showed signiÞcant effects on processing harvest yields for protein (F⫽
76.22; df⫽ 3; P ⬍ 0.0001), state (F ⫽ 23.10; df ⫽ 4; P ⬍ 0.0001), and insecticide frequency (F⫽ 6.62; df ⫽ 2; P⫽ 0.0016) but not year (Table 2).
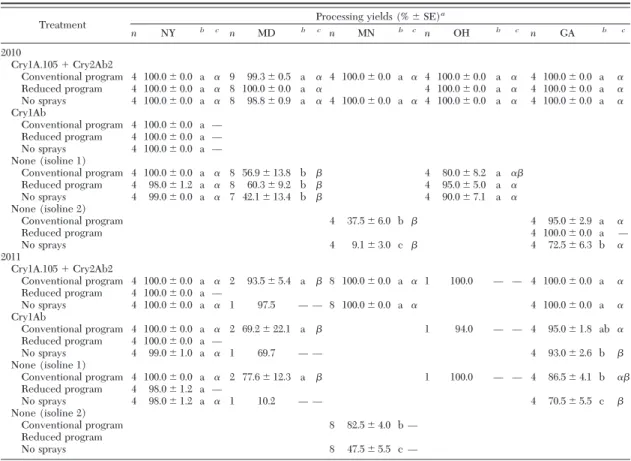
In 2010, yields were not signiÞcantly different be-tween Cry1A.105 ⫹ Cry2Ab2 and non-Bt isolines plants in NY and OH, regardless of spray program, while in MD and MN, there were signiÞcant differ-ences at all spray programs (Table 4). In GA, yields were ⱖ95% for all treatments, except for the non-treated non-Bt isoline, which was signiÞcantly lower at 72.5%. Across all states, there were no differences in the performance of Cry1A.105⫹ Cry2Ab2 regardless of spray program. However, within a spray program for non-Bt isolines, there were signiÞcant differences. In 2011, in MN and GA, Cry1A.105 ⫹ Cry2Ab2 plants signiÞcantly improved yields at both conven-tional insecticide frequencies and without insecti-cides, compared with non-Bt isoline treatments. Cry1Ab plants that received no sprays in GA pro-duced a signiÞcantly lower yield than nonsprayed Cry1.105⫹ Cry2Ab2 plants in NY. No signiÞcant dif-ferences between Cry1A.105⫹ Cry2Ab2 and non-Bt isoline treatments were found in NY or MD, regardless of spray treatment.
Among Cry1A.105⫹ Cry2Ab2 treatments across all states in 2010, there were no statistically signiÞcant Table 3. Comparisons of Bt proteins for fresh market corn production within and between states
Treatment Fresh market yields (%⫾ SE)
a n NY b c n MD b c n MN b c n OH b c n GA b c 2010 Cry1A.105⫹ Cry2Ab2 Conventional program 4 100.0⫾ 0.0 a ␣ 9 93.4⫾ 2.1 a ␣ 4 70.0 ⫾ 6.1 a  4 100.0 ⫾ 0.0 a ␣ 4 97.5⫾ 2.5 a ␣ Reduced program 4 99.0⫾ 1.0 a ␣ 8 95.5⫾ 2.0 a ␣ 4 95.0⫾ 2.9 a ␣ 4 97.5⫾ 2.5 a ␣ No sprays 4 100.0⫾ 0.0 a ␣ 8 83.8⫾ 3.5 ab  4 88.3 ⫾ 3.6 a  4 90.0 ⫾ 4.1 a  4 100.0⫾ 0.0 a ␣ Cry1Ab Conventional program 4 100.0⫾ 0.0 a Ñ Reduced program 4 100.0⫾ 0.0 a Ñ No sprays 4 99.0⫾ 1.0 a Ñ None (isoline 1) Conventional program 4 18.0⫾ 10.9 b ␣ 8 45.4 ⫾ 14.7 bc ␣ 4 40.0⫾ 7.1 b ␣ Reduced program 4 10.0⫾ 2.0 b  8 46.4 ⫾ 10.4 bc ␣ 4 22.5⫾ 7.5 b ␣ No sprays 4 6.0⫾ 3.5 b ␣ 7 42.1 ⫾ 13.4 c ␣ 4 15.0⫾ 6.5 b ␣ None (isoline 2) Conventional program 4 2.4⫾ 1.4 b  4 87.5⫾ 7.5 ab ␣ Reduced program 4 75.0⫾ 6.5 b Ñ No sprays 4 3.4⫾ 2.1 b  4 25.0⫾ 5.0 c ␣ 2011 Cry1A.105⫹ Cry2Ab2 Conventional program 4 100.0⫾ 0.0 a ␣ 2 70.6 ⫾ 19.1 a  8 96.9 ⫾ 1.6 a ␣ 1 95.0 Ñ Ñ 4 99.5⫾ 0.5 ab ␣ Reduced program 4 100.0⫾ 0.0 a Ñ No sprays 4 97.0⫾ 3.0 ab ␣ 1 64.5 Ñ Ñ 8 96.9⫾ 2.5 a ␣ 4 100.0⫾ 0.0 a ␣ Cry1Ab Conventional program 4 98.0⫾ 2.0 a ␣ 2 31.8 ⫾ 22.4 a  1 89.0 Ñ Ñ 4 93.5⫾ 1.8 bc ␣ Reduced program 4 97.0⫾ 1.9 ab Ñ No sprays 4 96.0⫾ 2.8 ab ␣ 1 14.1 Ñ Ñ 4 87.0⫾ 4.1 cd ␣ None (isoline 1) Conventional program 4 84.0⫾ 4.3 bc ␣ 2 60.4 ⫾ 10.4 a ␣ 1 90.0 Ñ Ñ 4 80.0⫾ 3.5 d ␣ Reduced program 4 74.0⫾ 6.0 c Ñ No sprays 4 32.0⫾ 7.8 d  1 4.1 Ñ Ñ 4 63.0⫾ 4.8 e ␣ None (isoline 2) Conventional program 8 41.3⫾ 3.1 b Ñ Reduced program No sprays 8 28.8⫾ 3.5 b Ñ n,number of replicates.
aUntransformed mean percent marketable harvest values are presented.
bMeans within a column and given year followed by different letters are signiÞcantly different (Tukey HSD; P⬍ 0.05). cMeans within a row and given year followed by different symbols are signiÞcantly different (Tukey HSD; P⬍ 0.05).
differences in processing yields, regardless of insecti-cide frequency. The same result occurred in 2011, with the exception of MD at a conventional insecticide frequency, which produced a signiÞcantly lower yield (Table 4). Among non-Bt isoline treatments in 2010, MD yields were signiÞcantly lower for conventional, reduced, and no spray treatments compared with NY for non-Bt isoline 1. MN yields at conventional and no spray treatments were also signiÞcantly lower than GA for non-Bt isoline 2. In 2011, non-Bt isoline 1 plants treated at a conventional spray frequency produced signiÞcantly lower yields in MD compared with NY, and GA non-Bt isoline 1 plants receiving no spray produced even lower yields than NY (Table 4).
H. zea Per Ear. Least squares regression for
pro-cessing yield resulted in an R2value of 0.47 (n⫽ 225),
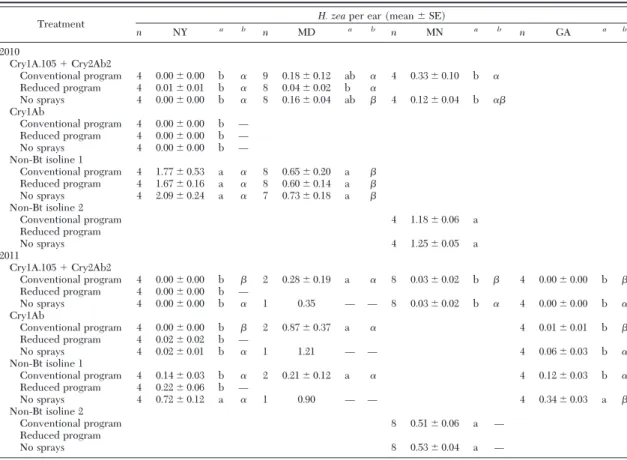
suggesting the factors involved had signiÞcant effects on the model (Table 1). The model showed signiÞcant effects on H. zea per ear by protein expression (F⫽ 44.84; df⫽ 3; P ⬍ 0.0001) and year (F ⫽ 24.77; df ⫽ 1; P⬍ 0.0001) (Table 2). In 2010, populations of H. zea per ear were always highest in the untreated non-Bt isolines: 2.09 (NY), 1.25 (MN), and 0.73 (MD). This also occurred in 2011, except for MD where the high-est population was in the Cry1Ab treatment with no
sprays (1.21). In 2010, Cry1A.105⫹ Cry2Ab2 plants signiÞcantly reduced the number of H. zea larvae com-pared with the non-Bt isoline, regardless of insecticide frequency, in NY and MN. In MD, the number of H. zea per ear was signiÞcantly reduced only in Cry1A.105⫹ Cry2Ab2 plants treated with a reduced insecticide frequency, compared with the non-Bt iso-line treatment (Table 5).
In 2011, signiÞcant reductions in H. zea per plant were achieved with Cry1A.105⫹ Cry2Ab2 plants at both conventional insecticide frequencies and no sprays in MN, compared with the non-Bt isoline treat-ments. In NY, H. zea per plant was signiÞcantly higher in non-Bt isoline plants that did not receive any in-secticide sprays. All other Cry1A.105 ⫹ Cry2Ab2, Cry2Ab2, and non-Bt isoline treatments in NY for 2011 were not signiÞcantly different. SigniÞcant reductions in the number of H. zea per plant occurred in GA with all treatments, compared with the nonsprayed non-Bt isoline 1. No signiÞcant differences were found among any MD treatments (Table 5).
Among Cry1A.105⫹ Cry2Ab2 treatments across all states in 2010, MD had signiÞcantly higher H. zea per ear than NY for plants that received no insecticide sprays. In 2011, MD plants sprayed at conventional Table 4. Comparisons of Bt proteins for processing corn production within and between states
Treatment Processing yields (%⫾ SE)
a n NY b c n MD b c n MN b c n OH b c n GA b c 2010 Cry1A.105⫹ Cry2Ab2 Conventional program 4 100.0⫾ 0.0 a ␣ 9 99.3 ⫾ 0.5 a ␣ 4 100.0 ⫾ 0.0 a ␣ 4 100.0 ⫾ 0.0 a ␣ 4 100.0 ⫾ 0.0 a ␣ Reduced program 4 100.0⫾ 0.0 a ␣ 8 100.0 ⫾ 0.0 a ␣ 4 100.0⫾ 0.0 a ␣ 4 100.0 ⫾ 0.0 a ␣ No sprays 4 100.0⫾ 0.0 a ␣ 8 98.8 ⫾ 0.9 a ␣ 4 100.0 ⫾ 0.0 a ␣ 4 100.0 ⫾ 0.0 a ␣ 4 100.0 ⫾ 0.0 a ␣ Cry1Ab Conventional program 4 100.0⫾ 0.0 a Ñ Reduced program 4 100.0⫾ 0.0 a Ñ No sprays 4 100.0⫾ 0.0 a Ñ None (isoline 1) Conventional program 4 100.0⫾ 0.0 a ␣ 8 56.9 ⫾ 13.8 b  4 80.0⫾ 8.2 a ␣ Reduced program 4 98.0⫾ 1.2 a ␣ 8 60.3 ⫾ 9.2 b  4 95.0⫾ 5.0 a ␣ No sprays 4 99.0⫾ 0.0 a ␣ 7 42.1 ⫾ 13.4 b  4 90.0⫾ 7.1 a ␣ None (isoline 2) Conventional program 4 37.5⫾ 6.0 b  4 95.0⫾ 2.9 a ␣ Reduced program 4 100.0⫾ 0.0 a Ñ No sprays 4 9.1⫾ 3.0 c  4 72.5⫾ 6.3 b ␣ 2011 Cry1A.105⫹ Cry2Ab2 Conventional program 4 100.0⫾ 0.0 a ␣ 2 93.5 ⫾ 5.4 a  8 100.0 ⫾ 0.0 a ␣ 1 100.0 Ñ Ñ 4 100.0⫾ 0.0 a ␣ Reduced program 4 100.0⫾ 0.0 a Ñ No sprays 4 100.0⫾ 0.0 a ␣ 1 97.5 Ñ Ñ 8 100.0⫾ 0.0 a ␣ 4 100.0⫾ 0.0 a ␣ Cry1Ab Conventional program 4 100.0⫾ 0.0 a ␣ 2 69.2 ⫾ 22.1 a  1 94.0 Ñ Ñ 4 95.0⫾ 1.8 ab ␣ Reduced program 4 100.0⫾ 0.0 a Ñ No sprays 4 99.0⫾ 1.0 a ␣ 1 69.7 Ñ Ñ 4 93.0⫾ 2.6 b  None (isoline 1) Conventional program 4 100.0⫾ 0.0 a ␣ 2 77.6 ⫾ 12.3 a  1 100.0 Ñ Ñ 4 86.5⫾ 4.1 b ␣ Reduced program 4 98.0⫾ 1.2 a Ñ No sprays 4 98.0⫾ 1.2 a ␣ 1 10.2 Ñ Ñ 4 70.5⫾ 5.5 c  None (isoline 2) Conventional program 8 82.5⫾ 4.0 b Ñ Reduced program No sprays 8 47.5⫾ 5.5 c Ñ n,number of replicates.
aUntransformed mean percent marketable harvest values are presented.
bMeans within a column and given year followed by different letters are signiÞcantly different (Tukey HSD; P⬍ 0.05). cMeans within a row and given year followed by different symbols are signiÞcantly different (Tukey HSD; P⬍ 0.05).
rates had signiÞcantly higher numbers of H. zea per plant than in NY, MN, and GA. MD also had signiÞ-cantly higher H. zea per ear among conventionally sprayed Cry1Ab plants compared with NY and GA. Among non-Bt isoline treatments, NY had signiÞcantly more H. zea per ear compared with MD at all insec-ticide frequencies in 2010, whereas NY had signiÞ-cantly higher populations on nontreated non-Bt iso-lines in 2011 compared with GA (Table 5).
Discussion
Sweet corn grown for fresh market purposes has a different standard for insect damage tolerance com-pared with processing corn. If a caterpillar infests an ear but does not progress beyond the silk or ear tip, it can be mechanically removed at the time of processing as part of the manufacturing process. This tolerance allows a greater proportion of ears to be classiÞed as marketable, and results presented here support this scenario. Under these conditions, varieties containing two genes (Cry1A.105⫹ Cry2Ab2) and a single gene (Cry1Ab) performed well, and both Bt varieties sig-niÞcantly outperformed the traditional isoline variet-ies in nearly all cases regardless of insecticide appli-cation frequency.
For fresh market, Cry1A.105⫹ Cry2Ab2 performed signiÞcantly better than the non-Bt isolines in NY, MD, MN, and OH in 2010, under all spray treatments (Table 3). Similar trends also occurred in GA except for the lack of signiÞcance in one treatment. Similarly, in 2011, Cry1A.105⫹ Cry2Ab2 performed signiÞcantly better than the non-Bt isolines in NY, MN, and OH. For processing, yields were always higher because of the different standards, and there were no signiÞcant differences in marketable yields in 2010 in NY or OH between any of the spray treatments of Cry1A.105⫹ Cry2Ab2 and its non-Bt isoline (Table 4). However, in MD, Cry1A.105⫹ Cry2Ab2 plants always performed signiÞcantly better than the non-Bt isoline under a similar insecticide treatment. In 2011, signiÞcant dif-ferences between Bt and non-Bt plants under the same spray regime occurred in MD and GA.
There were signiÞcant differences in fresh market yields between states but not in processing yields (Tables 4 and 5). For example, in New York in 2010, fresh market sweet corn plants expressing Cry1A.105⫹ Cry2Ab2 at a conventional insecticide frequency or no sprays resulted in 100% fresh mar-ketable ears, while the same treatments in MN had values of 70.0 and 88.3%, respectively. Even more dramatic variability in control in 2011 was seen using Table 5. Comparisons of protein expression for H. zea suppression in corn ears
Treatment H. zeaper ear (mean⫾ SE)
n NY a b n MD a b n MN a b n GA a b 2010 Cry1A.105⫹ Cry2Ab2 Conventional program 4 0.00⫾ 0.00 b ␣ 9 0.18⫾ 0.12 ab ␣ 4 0.33⫾ 0.10 b ␣ Reduced program 4 0.01⫾ 0.01 b ␣ 8 0.04⫾ 0.02 b ␣ No sprays 4 0.00⫾ 0.00 b ␣ 8 0.16⫾ 0.04 ab  4 0.12⫾ 0.04 b ␣ Cry1Ab Conventional program 4 0.00⫾ 0.00 b Ñ Reduced program 4 0.00⫾ 0.00 b Ñ No sprays 4 0.00⫾ 0.00 b Ñ Non-Bt isoline 1 Conventional program 4 1.77⫾ 0.53 a ␣ 8 0.65⫾ 0.20 a  Reduced program 4 1.67⫾ 0.16 a ␣ 8 0.60⫾ 0.14 a  No sprays 4 2.09⫾ 0.24 a ␣ 7 0.73⫾ 0.18 a  Non-Bt isoline 2 Conventional program 4 1.18⫾ 0.06 a Reduced program No sprays 4 1.25⫾ 0.05 a 2011 Cry1A.105⫹ Cry2Ab2 Conventional program 4 0.00⫾ 0.00 b  2 0.28⫾ 0.19 a ␣ 8 0.03⫾ 0.02 b  4 0.00⫾ 0.00 b  Reduced program 4 0.00⫾ 0.00 b Ñ No sprays 4 0.00⫾ 0.00 b ␣ 1 0.35 Ñ Ñ 8 0.03⫾ 0.02 b ␣ 4 0.00⫾ 0.00 b ␣ Cry1Ab Conventional program 4 0.00⫾ 0.00 b  2 0.87⫾ 0.37 a ␣ 4 0.01⫾ 0.01 b  Reduced program 4 0.02⫾ 0.02 b Ñ No sprays 4 0.02⫾ 0.01 b ␣ 1 1.21 Ñ Ñ 4 0.06⫾ 0.03 b ␣ Non-Bt isoline 1 Conventional program 4 0.14⫾ 0.03 b ␣ 2 0.21⫾ 0.12 a ␣ 4 0.12⫾ 0.03 b ␣ Reduced program 4 0.22⫾ 0.06 b Ñ No sprays 4 0.72⫾ 0.12 a ␣ 1 0.90 Ñ Ñ 4 0.34⫾ 0.03 a  Non-Bt isoline 2 Conventional program 8 0.51⫾ 0.06 a Ñ Reduced program No sprays 8 0.53⫾ 0.04 a Ñ n,number of replicates.
aMeans within a column and given year followed by different letters are signiÞcantly different (Tukey HSD; P⬍ 0.05). bMeans within a row and given year followed by different symbols are signiÞcantly different (Tukey HSD; P⬍ 0.05).
Cry1Ab, with a 66.2% difference in marketability be-tween NY (98.0%) and MD (31.8%) fresh market sweet corn. We suspect that this difference was likely because of the traditionally higher H. zea populations found in MD, although the H. zea counts in the ears at harvest in MD (0.90) were not dramatically different from the level found in NY (0.72) (Table 5). Where comparisons could be made between Cry1A.105 ⫹ Cry2Ab2 and Cry1Ab plants (2010, NY and MD; 2011, NY, MD, and GA) for fresh market, the product ex-pressing Cry1A.105⫹ Cry2Ab2 provided more pro-tection and resulted in less variability in control (Ta-ble 3).
In addition to variation in marketability between states, variation in pest densities also occurred. Table 5 illustrates that in 2010 and 2011, H. zea populations varied across states. In untreated non-Bt plots, mean H.zea per ear varied from a low of 0.34 (GA, 2011) to 2.09 (NY, 2010). For pest suppression of H. zea, plants expressing Bt proteins consistently performed better than non-Bt isoline plants, even those sprayed at con-ventional insecticide frequencies.
Overall, these results indicate Cry1A.105 ⫹ Cry2Ab2 and Cry1Ab plants are suitable for fresh market and processing corn production across a di-versity of growing regions and years. Both Bt varieties signiÞcantly reduced larval densities compared with their non-Bt isolines. These results are especially im-portant for fresh market production where there is zero tolerance for damage. Results should also be interpreted with recognition that the frequency of insecticide sprays was built into the regression model. Regardless of insecticide frequency, non-Bt isolines still contained unacceptable infestations of H. zea. Our results demonstrate that Bt sweet corn has the poten-tial to signiÞcantly reduce the use of conventional insecticides against lepidopteran pests and, in turn, reduce occupational and environmental risks that arise from intensive insecticide use.
In our trials, H. zea was the main insect pest and its biology makes it more amenable to control by Bt sweet corn than with conventional insecticides. Female H. zeamoths deposit eggs on fresh silks (Barber 1943), and insecticides must be applied at frequent intervals during the short critical silking stage to protect the ears. If the eggs or neonate larvae are not killed on the silks, they may quickly migrate down and enter the ear tip where exposure to insecticide sprays is greatly reduced. Timing insecticide applications for H. zea is difÞcult because not all corn plants are in the most susceptible (early silk) stage at the same time. In 2012, we observed female H. zea laying a single egg on a silk, then moving to another plant where another egg was laid, thus depositing eggs on⬎30 plants within a 10-min period (D.L.O., unpublished data). It has been reported that each H. zea can produce⬎1,200 eggs over the course of her adult life (Satyanarayana et al. 1991). If each female lays a single egg on an individual plant, and there are 58,000 plants/ha, in theory it would take⬍50 females to infest all plants. The chal-lenge is how to protect the ear during the critical silking period. Our data suggest that this can be most
effectively done using Bt proteins, especially if they are pyramided as in the case of Cry1A.105⫹ Cry2Ab2. However, even with these toxins showing excellent control of H. zea, there is a need to consider other Lepidoptera that have the potential to inßuence sweet corn production. The western bean cutworm, Striacosta albicosta (Smith), is native to North America and was Þrst discovered in Arizona in the 1880s but has been moving eastward into the Mid-west and Great Lakes region where it has been found on corn in the last decade. This noctuid is not susceptible to Cry1A or Cry2A. The developers of Bt sweet corn should consider pyramiding another protein, perhaps Cry1 F or VIP3A, to obtain control of this emerging pest in sweet corn, as has been done in Þeld corn.
Performance Series sweet corn varieties captured an estimated 5Ð10% of the total fresh market sweet corn market in the United States during its Þrst year of commercialization (R. Cordena Seminis, personal communication). Combined with SyngentaÕs Attri-bute Cry1Ab sweet corn, it is clear that Bt sweet corn is by far the most successful insect-resistant genetically engineered vegetable crop to date. By comparison, even at its peak, Bt potatoes were esti-mated to have captured only 3% of the potato market before being removed from the market in 2001 (Guenthner 2002). But the road ahead for Bt sweet corn, at least in the United States, will have its chal-lenges. Some market chains, including Whole Foods and Trader JoeÕs, decided in 2012 not to sell Bt sweet corn. However, Wal-Mart, the worldÕs largest food retailer, decided to sell Bt sweet corn despite petitions by activists (Common Dreams 2012). Our data suggest that using Bt sweet corn will dramatically reduce the use of traditional insecticides. Based on the perfor-mance of Bt Þeld corn, growers should realize in-creased proÞts (Qaim et al. 2008), and there will be less risk to nontarget organisms, including natural en-emies that help suppress pest densities (Hellmich et al. 2008).
Acknowledgments
We thank C. Davis for help in compiling the data and J. Yang at the Cornell Statistical Consulting Unit for reÞning our regression models. This project was supported by the New York State Specialty Crop Program (Contract 200755), Hatch and SmithÐLever funds to AMS, Agricultural Exper-iment Stations of the participating states, and Seminis Seeds. We thank Amy Morey and Suzanne WoldÐBurkness, Uni-versity of Minnesota, and Terry Patton and Mike Embrey, University of Maryland, for their assistance conducting this study. We are grateful to Roberto Cordero, Ron Gar-ton, and Mark Myers (Seminis Seeds) for their help in coordinating these trials, and H. Collins for her editorial help.
References Cited
Barber, G. W. 1943. Oviposition habits of the earworm
moth in relation to infestation in the ears and to control. J. Econ. Entom. 36: 611Ð 618.
Burkness, E. C., G. Dively, T. Patton, A. C. Morey, and W. D. Hutchison. 2010. Novel Vip3A Bacillus thuringiensis
(Bt) maize approaches high-dose efÞcacy against Heli-coverpa zea(Lepidoptera: Noctuidae) under Þeld con-ditions. GM Crops 1: 337Ð343.
Carrie`re, Y., C. Ellers–Kirk, M. Sisterson, L. Antilla, M. Whitlow, T. J. Dennehy, and B. E. Tabashnik. 2003.
Long-term regional suppression of pink bollworm by Ba-cillus thuringiensiscotton. Proc. Natl. Acad. Sci. U.S.A. 100: 1519 Ð1523.
Common Dreams. 2012. Outcry as Wal-Mart OKÕs
Mon-santoÕs GM Corn. (http://www.commondreams.org/ headline/2012/08/04-0).
Guenthner, J. F. 2002. Consumer acceptance of genetically
modiÞed potatoes. Am. J. Potato Res. 79: 309 Ð316.
Hellmich, R. L., R. Albajes, D. Bergvinson, J. R. Prasifka, Z. Y. Wang, and M. J. Weiss. 2008. The present and future role
of insect-resistant genetically modiÞed maize in IPM, pp. 87Ð118. In J. Romeis, A. M., Shelton, and G. G. Kennedy (eds.), Integration of Insect-Resistant, Genetically Mod-iÞed Crops Within IPM Programs. Springer, Dordrecht, The Netherlands.
Hutchison, W. D., E. C. Burkness, P. D. Mitchell, R. D. Moon, T. W. Leslie, S. J. Fleischer, M. Abrahamson, K. L. Ham-ilton, K. L. Steffy, M. E. Gray, et al. 2010. Areawide
suppression of European corn borer with Bt maize reaps savings to non-Bt maize growers. Science 330: 222Ð225.
James, C. 2012. Global status of commercialized transgenic
crops: Bt cotton, ISAAA brief no. 43. International Service for the Acquisition of Agri-Biotech Applications, Ithaca, NY.
Kathage, J., and M. Qaim. 2012. Economic impacts and
im-pact dynamics of Bt cotton in India. Proc. Natl. Acad. Sci. U.S.A. 109: 11652Ð11656. (doi/10.1073/pnas.1203647109).
Kennedy, G. G. 2008. Integration of insect-resistant
genet-ically modiÞed crops within IPM programs, pp. 1Ð26. In J. Romeis, A. M., Shelton, and G. G. Kennedy (eds.), Inte-gration of Insect-Resistant, Genetically ModiÞed crops Within IPM Programs. Springer, Dordrecht, The Neth-erlands.
Lu, Y., K. Wu, Y. Jiang, Y. Guo, and N. Desneux. 2012.
Widespread adoption of Bt cotton and insecticide de-crease promotes biocontrol services. Nature 487: 362Ð365. (doi:10.1038/nature11153).
Naranjo, S. E. 2009. Impacts of Bt crops on non-target
or-ganisms and insecticide use patterns. CAB Reviews: Nat. Res. 4:11. (doi:10.1079/PAVSNNR20094011).
Plaisted, D. 2003. Slow, uncertain, but steady rise of biotech
sweet corn. Program Symposium: Biotech Vegetables for Insect and Insect-Vectored Disease Management. ESA Annual Meeting 2003, Cincinnati, OH. (http://web. entomology.cornell.edu/shelton/biotech-veg/ppt.php).
Qaim, M., C. E. Pray, and D. Zilberman. 2008. Economic
and social considerations in the adoption of Bt crops, pp. 329 Ð356. In J. Romeis, A. M., Shelton, and G. G. Kennedy (eds.), Integration of Insect-Resistant, Genetically Mod-iÞed Crops Within IPM Programs. Springer, Dordrecht, The Netherlands.
Romeis, J., A. M. Shelton, and G. G. Kennedy. 2008.
Inte-gration of insect-resistant genetically modiÞed crops within IPM programs. Springer, Dordrecht, The Nether-lands.
Satyanarayana, J. H., J. H. Yu, G. Bhaskaran, K. H. Dahm, and R. Meola. 1991. Hormonal control of egg maturation in
the corn earworm, Heliothis zea. Entomol. Exp. Appl. 59: 135Ð143.
Shelton, A. M. 2012. Genetically engineered vegetables
ex-pressing proteins from Bacillus thruringiensis for insect resistance: successes, disappointments, challenges and ways to move forward. GM Crops Food 3: 175Ð183.
Shelton, A. M., J. Z. Zhao, and R. T. Roush. 2002. Economic,
ecological, food safety, and social consequences of the deployment of Bt transgenic plants. Annu. Rev. Entomol. 47: 845Ð 881.
Wu, K. M., Y. H. Lu, H. Q. Feng, Y. Y. Jiang, and J. Z. Zhao. 2008. Suppression of cotton bollworm in multiple crops
in China in areas with Bt toxin-containing cotton. Science 321: 1676 Ð1678.