ORIGINAL ARTICLE
Drinking Patterns and Their Predictive Factors in CONTROL: a 12-Month Prospective Study in a
Sample of Alcohol-Dependent Patients Initiating Treatment
Jean-Bernard Daeppen1,*, Mohamed Faouzi1, Thibault Sanglier2, Nathalie Sanchez1, Florence Coste2and Nicolas Bertholet1 1Alcohol Treatment Center, Lausanne University Hospital, Lausanne, Switzerland and2International Epidemiology Department, Lundbeck,
Issy les Moulineaux, France
*Corresponding author: Av Beaumont 21 bis, 1011 Lausanne, Switzerland. Tel.:+41-21-314-0875; E-mail: [email protected] (Received 15 July 2012; first review notified 21 August 2012; in revised form 28 October 2012; accepted 29 October 2012) Abstract — Aims: To describe the drinking patterns and their baseline predictive factors during a 12-month period after an initial evaluation for alcohol treatment. Methods: CONTROL is a single-center, prospective, observational study evaluating consecutive alcohol-dependent patients. Using a curve clustering methodology based on a polynomial regression mixture model, we identified three clusters of patients with dominant alcohol use patterns described as mostly abstainers, mostly moderate drinkers and mostly heavy drinkers. Multinomial logistic regression analysis was used to identify baseline factors (socio-demographic, alcohol depend-ence consequdepend-ences and related factors) predictive of belonging to each drinking cluster. Results: The sample included 143 alcohol-dependent adults (63.6% males), mean age 44.6 ± 11.8 years. The clustering method identified 47 (32.9%) mostly abstainers, 56 (39.2%) mostly moderate drinkers and 40 (28.0%) mostly heavy drinkers. Multivariate analyses indicated that mild or severe depres-sion at baseline predicted belonging to the mostly moderate drinkers cluster during follow-up (relative risk ratio (RRR) 2.42, CI [1.02–5.73, P = 0.045] P = 0.045), while living alone (RRR 2.78, CI [1.03–7.50], P = 0.044) and reporting more alcohol-related consequences (RRR 1.03, CI [1.01–1.05], P = 0.004) predicted belonging to the mostly heavy drinkers cluster during follow-up. Conclusion: In this sample, the drinking patterns of alcohol-dependent patients were predicted by baseline factors, i.e. depression, living alone or alcohol-related consequences and findings that may inform clinicians about the likely drinking patterns of their alcohol-dependent patient over the year following the initial evaluation for alcohol treatment.
INTRODUCTION
Literature has long been focused on abstinence versus relapse in treatment studies of alcohol-dependent subjects (Helzer et al., 1985;Wallace et al., 1988;Finney and Moos, 1991;Walsh et al., 1991;Soyka and Roesner, 2006). A non-dichotomous approach to alcohol use patterns in studies of treatment of alcohol-dependent patients corresponds to the recognition that many alcohol-dependent patients do not achieve either complete abstinence from, or full relapse to, heavy drinking after treatment initiation, but in-between states of reduced or mostly moderate drinking patterns. Treatment models and research on alcohol-dependent patients have recently included non-abstinence objectives as an alternative to total abstinence programs. This has led to reduced alcohol use as a primary outcome goal. Data from a large alcohol treatment study in the UK indicate that 45.7% of the patients studied expressed a preference for non-abstinence (Adamson et al., 2010). Recognizing that at least three clusters of drinking patterns are encountered during the first year after treatment initiation, i.e. mostly abstainers, mostly moderate drinkers and mostly heavy drinkers, it might be of interest for clinicians to determine the proportion of individuals in each cluster and the factors that predict belonging to each outcome group.
Studies of the factors associated with the drinking outcome after treatment for alcohol dependence have shown that some factors reflect patients’ baseline characteristics while others reflect characteristics of the treatment process. Non-baseline within-treatment factors include patients’ involvement and perception of treatment efficacy (Long et al., 2000), quality of therapeutic alliance (Ritter et al., 2002), receipt of alcohol treatment (Bertholet et al., 2010), compliance to medication (Koeter et al., 2010), length of stay in inpatient treatment
program (Gottheil et al., 1992), including the significant other in the follow-up (Aguiar et al., 2012), and involvement in alcoholics anonymous groups (e.g.Montgomery et al., 1995). Non-treatment-related perceptions by the patient have been associated with outcomes. For example, a high perception of the level of impaired control over drinking and a high percep-tion of the level of drinking problems have been associated with a better 12-month treatment outcome in 175 middle-aged alcohol-dependent men (Sawayama et al., 2012). Better treat-ment outcomes have also been associated with patients’ per-ceptions, including drinking refusal self-efficacy, perception of self-control (Long et al., 2000) commitment to change (Bertholet et al., 2010) and intensity of stress induced craving (Higley et al., 2011).
Other factors assessed during baseline evaluation that predict drinking outcomes are socio-demographic characteris-tics, severity of alcohol dependence and health-related condi-tions. In a sample of 248 patients with alcohol abuse or dependence, higher 3- and 12-month drinking frequencies were associated with higher baseline alcoholism severity measures (Staines et al., 2003). Post-hoc analyses of the COMBINE study found that baseline drinking levels were positively associated with the drinking outcome (Gueorguieva et al., 2012). Additional characteristics measured during the initial phase of alcohol-dependence treatment have been associated with the drinking outcome, including educational level (Greenfield et al., 2003), Axis I and II DSM psychopathology (Pettinati et al., 1999) and anxiety and depression (Hobbs et al., 2011). Psychiatric co-morbidity did not appear to worsen treatment outcomes in another study including 118 alcohol-dependent patients (Mann et al., 2004), while two other studies found a worse outcome in men with depression and anti-social personality disorder, but not in women (Rounsaville et al., 1987;
Alcohol and Alcoholism Vol. 48, No. 2, pp. 189–195, 2013 doi: 10.1093/alcalc/ags125 Advance Access Publication 6 December 2012
Compton et al., 2003). An exploration of the factors asso-ciated with drinking outcomes was also conducted in non-treatment-seeking subjects with alcohol use disorders. The National Epidemiological Survey on Alcohol and Related Conditions (NESARC) evaluated factors associated with the 3-year evolution of alcohol use disorder in a com-munity sample of 1123 alcohol-dependent patients. Baseline factors associated with heavier drinking outcomes 3 years later included smoking and fulfilling the DSM-IV criteria for tolerance (Sarsour et al., 2012).
Most studies in the literature associate patients’ baseline characteristics with a limited number of drinking outcome measures, usually at 3, 6 or 12 months after study intake. Our observational study among 143 alcohol-dependent patients included a calendar-method detailed evaluation of drinking out-comes monthly during the 12-month period following initial assessment. The objective of the study was to identify and char-acterize three clusters of patients, with dominant alcohol use patterns described as mostly abstainers, mostly moderate drin-kers and mostly heavy drindrin-kers and to assess whether the base-line characteristics of patients within each group, in terms of alcohol consumption, co-morbidities and alcohol use conse-quences, would predict the drinking outcome.
METHODS
At the Lausanne University Hospital, all patients seeking inpatient and outpatient alcohol treatment and those patients who were hospitalized at the general hospital and subsequent-ly referred to the alcohol treatment centre (ATC) were eligible for study inclusion. CONTROL is a single center, prospective, observational study evaluating consecutive patients assessed for the first time at the ATC. CONTROL was funded by Lundbeck to provide background data for a randomized control trial that was conducted in other European countries.
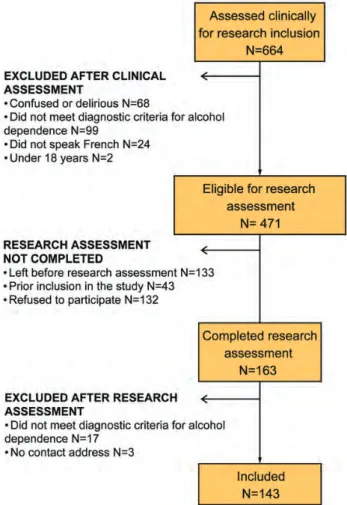
The ATC is a specialized treatment unit within the teach-ing hospital of Lausanne university medical school, Lausanne, Switzerland. Consecutive new patients consulting or referred to the ATC were assessed clinically by ATC medical staff, before being assessed for final study inclusion by a research assistant using standardized instruments. Patients were recruited at three different sites, the hospital wards/emergency department (general hospital patients re-ferred to alcohol unit), the ATC outpatient clinic (outpatient alcohol unit) and the ATC inpatient program (inpatient alcohol unit). Excluded were patients confused or delirious, those who did not meet the criteria for alcohol dependence on the basis of the Mini International Neuropsychiatric Interview (MINI) questionnaire (Lecrubier et al., 1997), those who did not speak French and those who had no contact address or were aged <18 years (Fig. 1). Participants were only included if they provided written informed consent. The Ethics Committee for clinical research at the Lausanne University Medical School ( protocol 127/09) approved the research. Once included, all the patients were followed-up by ATC research staff.
Clinical Assessment and Treatment Programs
All the patients included in the study were offered standard care provided at ATC by physicians, nurses and/or
psychologists. The study focused on the influence of patients’ baseline characteristics on follow-up drinking out-comes, without considering the influence of the components and quantity of specialized treatment completed during the follow-up (medication and psychotherapy). Therefore, the standard care offered was independent of the study and data relating to patients’ adherence to the standard care compo-nents were not reported. The study, therefore, reports on the natural history of patients with alcohol dependence referred to the ATC. Standard care proposed an initial assessment of the alcohol history, severity and repercussions in patients with an alcohol use disorder as well as somatic and psychi-atric assessments. After the initial assessment, the patients were invited to continue with the standard care. If they decided so, they were free to choose their own drinking ob-jective and received a combination of motivational interview-ing, relapse prevention and pharmacotherapy. A withdrawal regimen using oxazepam was provided when patients decided to abstain from alcohol (Daeppen et al., 2002).
The group ‘general hospital patients referred to alcohol unit’ was offered 1–3 sessions of motivational interviewing counseling before deciding to continue in the inpatient or outpatient programs or to decline any further treatment. The group ‘outpatient alcohol unit’ completed the initial assess-ment and was offered the possibility of attending individual and/or group sessions weekly during the initial phase of treatment. The session frequency was later adjusted as the
treatment progressed and the needs of the patients changed. The group ‘inpatient alcohol unit’ received a structured 3-week inpatient program including initial assessment, with-drawal, general internal medicine evaluation and treatment, individual and group psychotherapy sessions based on motivational interviewing and relapse prevention. Upon dis-charge, the patients were referred to an outpatient treatment program or to an aftercare program or to their general practitioner.
Research Assessment
For each patient, daily alcohol consumption was collected using the time line follow back (TLFB) method (Sobell and Sobell, 1992). At baseline and at subsequent interviews (each month and during the 12-month period), each patient provided a retrospective estimate of their daily drinking over the past month. A consumption profile (curve) corresponding to the series of measures (daily alcohol consumption) was then generated for each patient. Profiles were not the length of the patient's curve reflected the duration of follow-up due to drop-outs, this was possible since the polynomial regres-sion mixture model used allows to make use of data in patients who did not complete all the 12 months.
The following measurements were derived from the TLFB procedure: average daily alcohol intake in the last 30 days; heavy drinking days, defined as≥4 drinks for women and ≥5 drinks for men in a single day during the past 30 days, adapted from the NESARC definition in the US where a standard drink is equivalent to 14 g of alcohol, whereas, in Switzerland, a standard drink is equivalent to 10 g of alcohol (Sarsour et al., 2012); and drinking days over the last 30 days. Severity of alcohol dependence was measured using the alcohol dependence scale (ADS; Skinner and Horn, 1984), a self-administered questionnaire assessing alcohol withdrawal symptoms, impaired control over drinking, awareness of a compulsion to drink, increased tolerance to alcohol and sali-ence of drink-seeking behavior. Adverse consequsali-ences of alcohol dependence were measured using the drinker inven-tory of consequences (DrInC; Miller et al., 1995), a self-administered questionnaire resulting in an overall score built according to five areas: physical, intrapersonal, social, inter-personal and impulse control. DrInC scores were interpreted according to the score distribution described for project MATCH (Miller et al., 1995). Depression was assessed using the beck depression inventory-short form (BDI-SF;Beck and Steer, 1987), a questionnaire evaluating depression symptoms (e.g. hopelessness and irritability), cognition (e.g. guilt or feelings of being punished) as well as physical symptoms (e.g. fatigue, weight loss and lack of interest in sex). Furthermore socio-demographic, medical history and sub-stance use data were collected using direct questions. Baseline, 3-, 6, 9- and 12-month follow-up data were col-lected during face-to-face interviews with a trained psycholo-gist. Additional phone call interviews were conducted at months 1, 2, 4, 5, 7, 8, 10 and 11 to collect TLFB data, resulting in drinking data at baseline and monthly over a year. Statistical Analyses
Historically, most clustering algorithms have been developed to operate on fixed-dimensional vector data. However, many of these algorithms fail to be useful or practical with curve
data, such as chronological alcohol use data. Often, one must preprocess the data in such a way that reduces the curves to fixed-dimensional vectors, which leads to a loss of part of the information. In addition, these methods ignore the de-pendence of the curve measurements on the dependent vari-able (time). To address the curve clustering problem properly and to identify groups of subjects with the same alcohol con-sumption profile, we used a curve-clustering methodology based on a polynomial regression mixture model (Banfield and Raftery, 1993; Gaffney and Smyth, 1999; Gaffney, 2004). In this model, each individual trajectory is assumed to be generated from a finite mixture of polynomial regres-sion model components. Conditional mixture is used together with an expectation maximization algorithm to esti-mate the model parameters and the cluster membership. Each individual trajectory is then assigned to each cluster with a certain probability.
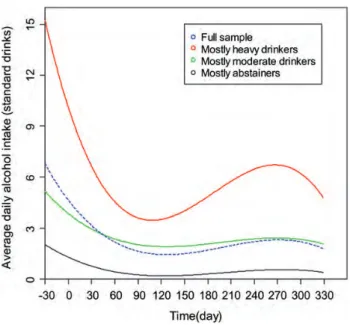
From our cohort, three clusters of patients were identified with the following curve profiles (i) nearly abstinent patients hereafter referred to as ‘mostly abstainers’, (ii) ‘mostly mod-erate drinkers’ and (iii) ‘mostly heavy drinkers’. The three groups are presented in Fig. 2 and corresponding equation parameter estimates for each cluster and the full cohort are shown in the appendix.
Multinomial logistic regression analysis was used to iden-tify factors that are potentially associated with each cluster. In a manner analogous to logistic regression, multinomial logistic regression allows correction for confounders and it expresses the results using RRR and 95% confidence inter-vals (CI). Associated factors with the drinking groups at a 20% significance level were then selected in a manual back-ward procedure to fit a multivariate model. The following factors were tested: age, gender, living alone, employment, age of onset of alcohol dependence, family history of alco-holism, alcohol dependence severity and consequences, tobacco, drug use and depression. These variables were chosen according to available data in the literature with regard to factors associated with alcohol use among indivi-duals with alcohol dependence. Considering that the recruit-ment site might influence the results observed, this variable was also included in the analyses.
RESULTS
As reported in Fig.1, between October 2008 and June 2009, 664 consecutive new patients consulting or referred to the ATC were assessed clinically for study inclusion. Clinical as-sessment resulted in the exclusion of 68 patients who were obviously confused or delirious, 99 patients without a clinic-al diagnosis of clinic-alcohol dependence (clinicclinic-al evclinic-aluation based on the International Classification of Diseases, 10th edition, WHO), 24 patients who did not speak French and 2 patients who were aged <18 years, leaving 471 patients eligible for the research assessment. Among them, 133 had left before the research assessment occurred, 43 had prior inclusion in the study and 132 refused to participate, which allowed the research assessment to be completed for 163 patients. Of the remaining 163 patients who completed the research assess-ment, 17 patients were excluded because they failed to meet the research criteria for alcohol dependence (in the MINI) and 3 because they had no contact address. Thus, this
manuscript reports data on 143 adults with a diagnosis of alcohol dependence, the inclusion rate being 143/360 (39.7%), the ratio of the number of adult patients with alcohol dependence assessed for the first time at the ATC to the number of patients included. The number of patients for whom data were reported declined to 105 at the 3-month visit, 96 at 6 months, 91 at 9 months and 86 at 12 months. So we were able to report data for 1231 monthly interviews on 1716 expected (143 patients × 12 months), 72% of the follow-up interviews expected. Among the 56 patients who discontinued the study, 23 refused to continue, 32 were not contactable and 1 passed away.
The baseline socio-demographic features of the sample of 143 alcohol-dependent patients are presented in Table 1. Two-thirds of the study participants were men; two-thirds were unmarried or living alone and ~50% were un-employed. Patients included, on average, corresponded to an intermediate level of severity of alcohol dependence, reported more than 15 heavy drinking days on average in the past month and TLFB data recorded for the 30 days before inclusion indicated an average of 8.2 drinks per drinking day. The evaluation of alcohol use consequences using the DrInC questionnaire are presented in Table 1
and show mean scores close to decile 50 for the total score (52 for men and 47 for women).
Our aim was to describe the drinking patterns at baseline and over the 12-month follow-up first for the full sample and then split into three clusters. Figure 2 shows smoothed curves depicting the evolution of daily alcohol consumption over the course of the 12-month follow-up for the full sample (n = 143) and for three drinking clusters with domin-ant alcohol use patterns described as mostly abstainers (n = 47 or 32.9%), mostly moderate drinkers (n = 56 or 39.2%) and mostly heavy drinkers (n = 40 or 28.0%).
Figure 1 indicates a general decrease in alcohol use during the 30 days preceding study inclusion, which continued over the 90 days following inclusion. This trend was observed in the full sample as well as within the three clusters. From day 90 until day 330, we observed smooth curves <3 drinks per day for the ‘mostly moderate drinkers’ and ‘mostly abstai-ners’ clusters, while there was a new wave of increase and decrease in alcohol use in the mostly heavy drinkers cluster. Completing the information of Fig.2(not reported in tables or figures), we computed within each cluster the average number of heavy drinking days over the 30 days preceding each of the 12 follow-up assessments (excluding the baseline value), which was 1.2 ± 0.5, 4.4 ± 1.0 and 10.8 ± 2.9 for the abstainers, mostly moderate drinkers and mostly heavy drinkers clusters, respectively.
We turned then to the objective of assessing whether patients’ baseline characteristics (socio-demographic, alcohol dependence severity, alcohol use consequences and related factors) would predict the drinking outcome, i.e. belonging to one of the three drinking clusters. The alcohol use vari-ables (average daily alcohol intake, percent heavy drinking days and percent drinking days) were not included in the regression analysis, since they were derived from the data obtained with the TLFB and were used to calculate the cluster model reported in Table 2. Though not reported in Table 2, baseline alcohol use variables for the three clusters (covering the 30 days before study inclusion) were as follows: ‘Mostly abstainers’ had had an average daily intake of 3.3 ± 7.1 drinks, median 0; ‘Mostly moderate drinkers’ had had an average daily intake of 6.0 ± 4.4 drinks, median 5 and‘mostly heavy drinkers’ had had an average daily intake of 17.0 ± 8.8 drinks, median 15. Heavy drinking days in the baseline last 30 days were as follows: 6.4 ± 9.2 (mostly abstainers), 15.5 ± 10.9 (mostly moderate drinkers) and
Table 1. Baseline characteristics of the 143 patients Socio-demographic characteristics
Age, mean (SD) 44.6 11.8
Female, n (%) 52.0 36.4
Unmarried or living alone, n (%) 91.0 63.6
Unemployed, n (%) 73.0 53.3
Alcohol dependence, consequences, consumption and related factors Age at disease onset, mean (SD) 31.6 12.5 Alcohol problems in family or relatives, n (%) 94.0 68.6 Alcohol dependence scale scorea, past 12 months, mean
(SD)
17.6 7.3 Average daily alcohol intake (standard drinks), past 30 days,
mean (SD)
8.2 8.8 Heavy drinking daysblast 30 days, mean (SD) 15.5 12.0 Drinking days last 30 days (%) 19.5 10.9 DrInCc, past 3 months, mean (SD) 48.3 25.2 Current cigarette smokerd, n (%) 105.0 73.9
Drug usee, n (%) 40.0 28.0
Depression mild to severef, n (%) 86.0 60.1
a
A score of 14–21 indicates intermediate level of dependence, 22–30 substantial level of dependence.
b
A heavy drinking day is defined as a consumption of four or more standard drinks in a day for women and five or more standard drinks in a day for men.
cA DrInC total score is in the range 0–135, the larger the score, the greater
the adverse consequences.
d
At least one cigarette per day over the last 3 months.
e
Any drug use over lifetime.
f
Score of eight or over reflects moderate or severe depression using the short form of the Beck Inventory scale.
Fig. 2. Daily alcohol intake at baseline and prospectively over 12 months, in the full sample and split into three 12-month follow-up drinking pattern clusters. Data were collected monthly at baseline and 12 months and are presented for the full sample (n = 143, dotted line) and for the three groups: mostly abstainers (n = 47, lower solid line), mostly moderate drinkers (n = 56, middle solid line) and mostly heavy drinkers (n = 40, top solid line).
26.2 ± 5.9 (mostly heavy drinkers). Drinking days in the baseline last 30 days were: 12.8 ± 11.4 (mostly abstainers), 20.1 ± 10.3 (mostly moderate drinkers) and 26.7 ± 4.8 (mostly heavy drinkers). Indeed, these data indicate that the higher the consumption during the 30 days preceding inclu-sion, the higher the consumption over the 12-month follow-up with heavier alcohol use for the cluster of patients described as mostly moderate drinkers during the 12-month follow-up (versus mostly abstainers) and heavier alcohol use for the cluster of patients described as mostly heavy drinkers during the 12-month follow-up (versus mostly abstainers).
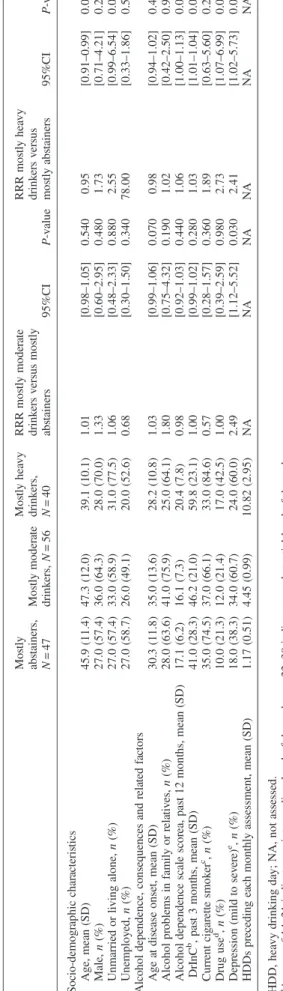
Table 2 reports the baseline characteristics of the sample across the three drinking patterns clusters, together with the results of the univariate multinomial regression analysis with comparison between mostly moderate drinkers versus mostly abstainers and between mostly heavy drinkers versus mostly abstainers. Mostly moderate drinkers were not different from mostly abstainers in terms of socio-demographics, alcohol use variables, dependence severity and consequences, but were more likely to report mild to severe depression at base-line, compared with mostly abstainers. Compared with mostly abstainers, mostly heavy drinkers were more likely to be younger, living alone, having more alcohol-related conse-quences and using drugs and also tended to have higher ADS scores and to be depressed.
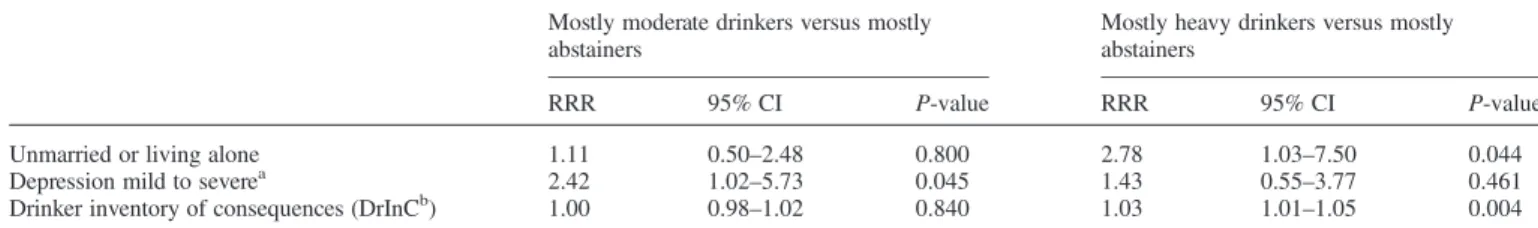
Variables of Table 2 associated with drinking groups with a P value of ≤ 0.20 were selected in a manual back-ward procedure to fit a multivariate model, reported in Table 3. Table 3 presents the baseline characteristics found to predict belonging to the mostly moderate drinkers or the mostly heavy drinkers clusters (versus mostly abstainers) during the 12-month follow-up observation. At baseline, subjects who were unmarried or living alone and reporting higher scores on the DrInC were more likely to fit in the mostly heavy drinkers cluster, while subjects with mild or severe depression were more likely to fit in the mostly moderate drinkers cluster.
Although not reported in the Tables, considering that patient recruitment site might influence the results, analyses included recruitment site as a variable in the model. From the 143 patients included, 38 were‘General hospital patients referred to alcohol unit’, 42 were ‘Outpatient alcohol unit’ and 63 were ‘Inpatient alcohol unit’. Univariate analysis, using the Chi-square test, indicated that the ‘Inpatient alcohol unit’ group was less likely to belong to the ‘mostly abstainers’ group (19.3%), compared with 41.4% in the ‘Outpatient specialized group’ and with 45.6% in the ‘General hospital patients referred to alcohol unit’ group (χ2= 14.7 and P = 0.005). However, in the multivariate multinomial logistic regression analysis, this variable was not retained in the model by the backward selection procedure.
DISCUSSION
The data reported indicate an important reduction in daily alcohol use, with an average initial alcohol intake of 8.2 (8.8) drinks per day reduced to an average consumption under 3 drinks per day for the patients successfully followed-up during 12 months. Similarly, reductions in average daily alcohol consumption of up to 80% have been reported in other treatment trials, including the
T able 2. Baseline cha ra cteris tics ac ross the thr ee 12-mo nth follo w-up drink ing pa tte rn clus ters and results fr om the univar ia te multin omial regr ession analy sis Mo stly ab stai ners, N =4 7 Mos tly moder at e drink ers, N =5 6 Mos tly hea vy dr ink ers, N =4 0 RRR mos tly mode ra te drink ers v ersu s mos tly abs tainers 95%C I P -val ue RR R m o stly hea vy drink er s v ersus mos tly abs tainers 95% CI P -v alue Soc io-dem ogr aphic ch ar acteris tics Age, mea n (SD) 45 .9 (11.4) 47.3 (12.0 ) 39.1 (1 0.1) 1.01 [0.98 –1.05] 0.540 0.95 [0.91 –0.99] 0.0 07 Male, n (%) 27 .0 (57.4) 36.0 (64.3 ) 28.0 (7 0.0) 1.33 [0.60 –2.95] 0.480 1.73 [0.71 –4.21] 0.2 30 Unmarried or livi ng alone, n (%) 27 .0 (57.4) 33.0 (58.9 ) 31.0 (7 7.5) 1.06 [0.48 –2.33] 0.880 2.55 [0.99 –6.54] 0.0 51 Unemp loy ed, n (%) 27 .0 (58.7) 26.0 (49.1 ) 20.0 (5 2.6) 0.68 [0.30 –1.50] 0.340 78.00 [0.33 –1.86] 0.5 80 Alc ohol depe ndence, co nsequen ces and rela ted fa ctors Age at dis ease onset, mean (SD) 30 .3 (11.8) 35.0 (13.6 ) 28.2 (1 0.8) 1.03 [0.99 –1.06] 0.070 0.98 [0.94 –1.02] 0.4 00 Alcoho l p roble ms in family or rela tiv es, n (%) 28 .0 (63.6) 41.0 (75.9 ) 25.0 (6 4.1) 1.80 [0.75 –4.32] 0.190 1.02 [0.42 –2.50] 0.9 60 Alcoho l depen dence scal e scor ea, pas t 1 2 mont hs, mean (SD) 17 .1 (6.2) 16.1 (7.3) 20.4 (7 .8) 0.98 [0.92 –1.03] 0.440 1.06 [1.00 –1.13] 0.0 50 DrI nC b, pas t 3 mont hs, mean (SD) 41 .0 (28.3) 46.2 (21.0 ) 59.8 (2 3.1) 1.00 [0.99 –1.02] 0.280 1.03 [1.01 –1.04] 0.0 01 Curr ent cig ar ett e smok er c , n (%) 35 .0 (74.5) 37.0 (66.1 ) 33.0 (8 4.6) 0.57 [0.28 –1.57] 0.360 1.89 [0.63 –5.60] 0.2 50 Drug use d, n (%) 10 .0 (21.3) 12.0 (21.4 ) 17.0 (4 2.5) 1.00 [0.39 –2.59] 0.980 2.73 [1.07 –6.99] 0.0 40 Depr es sion (mild to sev er e) e , n (%) 18 .0 (38.3) 34.0 (60.7 ) 24.0 (6 0.0) 2.49 [1.12 –5.52] 0.030 2.41 [1.02 –5.73] 0.0 50 HDDs pr ecedin g ea ch mont hly as sessment, mean (SD) 1.1 7 (0.51) 4.45 (0.99 ) 1 0 .82 (2 .95) NA NA NA NA NA NA HDD , hea vy drink ing da y; NA, not asse ssed. aA scor e o f 1 4– 21 indic ates an intermedia te lev el of depe ndence; 22 –30 ind ica tes a sub stantia l lev el of depen dence . b A DrIn C total sc or e is in the range 0– 135, the larg er the scor e, the gr ea ter the adv erse cons equen ces. cAt leas t one ciga rett e per da y o v er the las t 3 mont hs. d Any dr ug use o v er lifetime. eSco re of ≥8 refle cts mo der at e o r sev er e depr ession using the shor t form of the Beck Inv ento ry scale.
COMBINE study, which reported an overall net reduction in alcohol consumption from 66 to 13 drinks per week in 1383 alcohol-dependent individuals (Walsh et al., 1991;
Anton et al., 2006). In our sample, the clustering procedure identified 47 (32.9%) mostly abstainers, 56 (39.2%) mostly moderate drinkers and 40 (28.0%) mostly heavy drinkers in the 12-month follow-up. In project MATCH, 12% parti-cipants were classified as first-year abstainers (defined as not a single drink during the period of observation), 20% as moderate drinkers (at least one drink but no heavy drinking episode) and 68% as heavy drinkers (at least one heavy drinking day with five or more drinks for men and four for women) (Maisto et al., 2006, 2007). The lower rate of mostly heavy drinkers in our sample might be explained by higher follow-up rates (>90%) in project MATCH, suggesting that a large proportion of our patients lost to follow-up were ‘mostly heavy drinkers’.
Our data indicate that some baseline patients’ characteris-tics differed across the clusters with younger age, living alone, heavier alcohol use, more severe alcohol dependence, more drinking consequences, larger proportion of individuals with history of drug use and depression in the drinker clus-ters (mostly moderate drinkers or mostly heavy drinkers), compared with those classified in the mostly abstainers cluster. The multivariate model found that some of these baseline characteristics predicted the drinking outcome. Indeed, mostly moderate drinkers at follow-up were more likely to be diagnosed with mild to severe depression at baseline and mostly heavy drinkers at follow-up were more likely to live alone and report more alcohol-related conse-quences at baseline, compared with subjects described as mostly abstainers during follow-up. Our observation using a detailed prospective evaluation of the patients’ drinking pat-terns, converge with prior findings associating higher drink-ing outcome with higher baseline alcoholism severity measures (Staines et al., 2003; Heather and Dawe, 2005;
Aguiar et al, 2012;Gueorguieva et al., 2012), adding the in-formation that the consequences of drinking (one additional point on the DrInC scale increases the risk of belonging to the mostly heavy drinkers cluster by 3%), rather than the drinking volume, predict the outcome. Prior studies found conflicting data associating depression with poorer drinking outcomes, i.e. some authors found an association between depression and outcomes (Kranzler et al., 1996), whereas others did not (Mann et al., 2004) and others found the asso-ciation in men only (Rounsaville et al., 1987; Compton et al., 2003); surprisingly, our data indicate that mild to
severe depression predicts belonging to the mostly moderate drinkers cluster and not to the mostly heavy cluster at follow-up. It is difficult to understand that an association is found between depression and mostly moderate drinkers but not mostly heavy drinking, suggesting that this finding should be interpreted with caution. Our data also indicate that living alone predicts future mostly heavy drinking, an association that had previously been linked with heavier severity of alcohol dependence (Schuckit et al., 1997) but not with the alcohol treatment outcome.
The data reported here add precision to prior measures of the association between baseline and outcomes, associating repeated measures of the drinking outcome over the 12-month follow-up observation with baseline characteristics, while prior studies have linked baseline characteristics to a limited number of drinking outcome measures. However, some limitations to the current findings should be underlined. These observational data cumulate information provided by 143 patients with vari-able duration of follow-up. Nevertheless, we could only include patients willing to be interviewed monthly for 12 months, which may have limited our recruitment figures. Since our model allowed making use of data for patients who did not complete the 12-month follow-up, we were able to report data for 72% of the interviews expected, therefore com-pensating for somewhat the rather low 12-month retention in the study (86 of 143). The findings describe a sample of alcohol-dependent patients entering a single treatment setting within a teaching hospital in Switzerland, so these data may not apply to other samples of patients. Although conducted in various treatment settings in the same institution (general hos-pital liaison, outpatient and inpatient), this sample is limited to one institution, i.e. a teaching hospital, with a treatment program that tolerates that patients choose their drinking ob-jective, based on the principles of motivational interviewing (Ernst et al., 2007). Results might have been different for a strictly abstinence-focused treatment program.
The results and conclusions herein should be of interest to providers of health care for alcohol-dependent patients. Our findings suggest that clinicians consider depression, social isolation and alcohol-related consequences as treatment outcome prognostic factors, inciting them to adjust the treat-ment when they identify these risk factors.
Acknowledgements— The study was funded by Lundbeck. The authors thank David Figgitt PhD and Steve Clissold PhD, Content Ed Net, for their valuable editorial support in the preparation of the article. Funding for editorial support was provided by Lundbeck SAS, France.
Table 3. Baseline factors predicting belonging to mostly moderate drinkers and mostly heavy drinker clusters (versus mostly abstainers) during the 12-month follow-up observation
Mostly moderate drinkers versus mostly abstainers
Mostly heavy drinkers versus mostly abstainers
RRR 95% CI P-value RRR 95% CI P-value
Unmarried or living alone 1.11 0.50–2.48 0.800 2.78 1.03–7.50 0.044
Depression mild to severea 2.42 1.02–5.73 0.045 1.43 0.55–3.77 0.461
Drinker inventory of consequences (DrInCb) 1.00 0.98–1.02 0.840 1.03 1.01–1.05 0.004
Variables ofTable 2associated with drinking groups with a P value of≤0.20 were selected in a manual backward procedure to fit a multivariate model. RRR, relative risk ratio; CI, confidence interval.
a
Score of eight or over reflects moderate or severe depression using the short form of the beck inventory scale.
APPENDIX: EQUATION PARAMETER ESTIMATES FOR FIG.1 Equation parameters estimates Mostly abstainers Mostly moderate drinkers Mostly heavy
drinkers Full sample β0 2.04468471 5.20486604 15.44542914 6.86641776 β1 −0.02913497 −0.05083871 −0.20394747 −0.08335026 β2 0.00014174 0.00024582 0.00107453 0.00040124 β3 −0.00000020 −0.00000036 −0.00000164 −0.00000058 Σ 2.77 15.06 70.45 24.27 REFERENCES
Adamson SJ, Heather N, Morton V et al.; UKATT Research Team. (2010) Initial preference for drinking goal in the treatment of alcohol problems: II. Treatment outcomes. Alcohol Alcohol 45:136–42. Aguiar P, Neto D, Lambaz R et al. (2012) Prognostic factors during
outpatient treatment for alcohol dependence: cohort study with 6 months of treatment follow-up. Alcohol Alcohol 47:702–10. Anton RF, O’Malley SS, Ciraulo DA et al. (2006) Combined
phar-macotherapies and behavioral interventions for alcohol depend-ence: the COMBINE study: a randomized controlled trial. JAMA 295:2003–17.
Banfield JD, Raftery AE. (1993) Model-based Gaussian and non-Gaussian clustering. Biometrics 49:803–21.
Beck AT, Steer RA. (1987) Manual for the Beck Depression Inventory. San Antonio, TX: The Psychological Corp.
Bertholet N, Cheng DM, Palfai TP et al. (2010) Factors associated with favorable drinking outcome 12 months after hospitalization in a prospective cohort study of inpatients with unhealthy alcohol use. J Gen Intern Med 25:1024–9.
Compton WM, 3rd, Cottler LB, Jacobs JL et al. (2003) The role of psychiatric disorders in predicting drug dependence treatment outcomes. Am J Psychiatry 160:890–5.
Daeppen JB, Gache P, Landry U et al. (2002) Symptom-triggered vs fixed-schedule doses of benzodiazepine for alcohol withdraw-al: a randomized treatment trial. Arch Intern Med 162:1117–21. Ernst D, Miller WR, Rollnick S. (2007) Treating substance abuse in
primary care: a demonstration project. Int J Integr Care 7:e36. Finney JW, Moos RH. (1991) The long-term course of treated
alco-holism: I. Mortality, relapse and remission rates and compari-sons with community controls. J Stud Alcohol 52:44–54. Gaffney S. (2004) Probabilistic Curve-Aligned Clustering and
Prediction with Regression Mixture Models, Thesis Dissertation. University of California, Irvine.
Gaffney S, Smyth P. (1999) Trajectory Clustering with Mixtures of Regression Model. Technical Reports N°99–15, Irvine: Department of Information and Computer Science, University of California.
Gottheil E, McLellan AT, Druley KA. (1992) Length of stay, patient severity and treatment outcome: sample data from the field of alcoholism. J Stud Alcohol 53:69–75.
Greenfield SF, Sugarman DE, Muenz LR et al. (2003) The relation-ship between educational attainment and relapse among alcohol-dependent men and women: a prospective study. Alcohol Clin Exp Res 27:1278–85.
Gueorguieva R, Wu R, Donovan D et al. (2012) Baseline trajector-ies of heavy drinking and their effects on postrandomization drinking in the COMBINE study: empirically derived predictors of drinking outcomes during treatment. Alcohol 46:121–31. Heather N, Dawe S. (2005) Level of impaired control predicts
outcome of moderation-oriented treatment for alcohol problems. Addiction 100:945–52.
Helzer JE, Robins LN, Taylor JR et al. (1985) The extent of long-term moderate drinking among alcoholics discharged from medical and psychiatric treatment facilities. N Engl J Med 312:1678–82. Higley AE, Crane NA, Spadoni AD et al. (2011) Craving in
re-sponse to stress induction in a human laboratory paradigm pre-dicts treatment outcome in alcohol-dependent individuals. Psychopharmacology (Berl) 218:121–9.
Hobbs JD, Kushner MG, Lee SS et al. (2011) Meta-analysis of sup-plemental treatment for depressive and anxiety disorders in patients being treated for alcohol dependence. Am J Addict 20:319–29.
Koeter MW, van den Brink W, Lehert P. (2010) Effect of early and late compliance on the effectiveness of acamprosate in the treat-ment of alcohol dependence. J Subst Abuse Treat 39:218–26. Kranzler HR, Del Boca FK, Rounsaville BJ. (1996) Comorbid
psy-chiatric diagnosis predicts three-year outcomes in alcoholics: a posttreatment natural history study. J Stud Alcohol 57:619–26. Lecrubier Y, Sheehan DV, Weiller E et al. (1997) The mini
inter-national neuropsychiatric interview (MINI). A short diagnostic structured interview: reliability and validity according to the CIDI. European Psychiatry 12:224–31.
Long CG, Williams M, Midgley M et al. (2000) Within-program factors as predictors of drinking outcome following cognitive-behavioral treatment. Addict Behav 25:573–8.
Maisto SA, Clifford PR, Stout RL et al. (2006) Drinking in the year after treatment as a predictor of three-year drinking outcomes. J Stud Alcohol 67:823–32.
Maisto SA, Clifford PR, Stout RL et al. (2007) Moderate drinking in the first year after treatment as a predictor of three-year out-comes. J Stud Alcohol Drugs 68:419–27.
Mann K, Hintz T, Jung M. (2004) Does psychiatric comorbidity in alcohol-dependent patients affect treatment outcome? Eur Arch Psychiatry Clin Neurosci 254:172–81.
Miller WR, Tonigan JS, Longabaugh R. (1995) The Drinker Inventory of Consequences (DrInC): An Instrument for Assessing Adverse Consequences of Alcohol Abuse. Project MATCH Monograph Series, Vol. 4. DHHS Publication No. 95– 3911. Rockville, MD: National Institute on Alcohol Abuse and Alcoholism.
Montgomery HA, Miller WR, Tonigan JS. (1995) Does alcoholics anonymous involvement predict treatment outcome? J Subst Abuse Treat 12:241–6.
Pettinati HM, Pierce JD, Jr, Belden PP et al. (1999) The relation-ship of axis II personality disorders to other known predictors of addiction treatment outcome. Am J Addict 8:136–47.
Ritter A, Bowden S, Murray T et al. (2002) The influence of the therapeutic relationship in treatment for alcohol dependency. Drug Alcohol Rev 21:261–8.
Rounsaville BJ, Dolinsky ZS, Babor TF et al. (1987) Psychopathology as a predictor of treatment outcome in alco-holics. Arch Gen Psychiatry 44:505–13.
Sarsour K, Johnston JA, Milton DR et al. (2012) Factors predicting change in frequency of heavy drinking days among alcohol-dependent participants in the National Epidemiologic Survey on Alcohol and Related Conditions (NESARC). Alcohol Alcohol 47:443–50.
Sawayama T, Yoneda J, Tanaka K et al. (2012) The predictive val-idity of the drinking-related cognitions scale in alcohol-dependent patients under abstinence-oriented treatment. Subst Abuse Treat Prev Policy 7:17.
Schuckit MA, Tipp JE, Smith TL et al. (1997) Periods of abstin-ence following the onset of alcohol dependabstin-ence in 1853 men and women. J Stud Alcohol 58:581–9.
Skinner HA, Horn JL. (1984) Alcohol Dependence Scale: Users Guide. Toronto: Addiction Research Foundation.
Sobell LC, Sobell MB. (1992) Timeline follow-back. A technique for assessing self-reported ethanol consumption. In Allen J, Litten RZ. (eds). Measuring Alcohol Consumption: Psychosocial and Biological Methods. Totowa NJ: Humana Press. 41–72.
Soyka M, Roesner S. (2006) New pharmacological approaches for the treatment of alcoholism. Expert Opin Pharmacother 7:2341–53.
Staines G, Magura S, Rosenblum A et al. (2003) Predictors of drinking outcomes among alcoholics. Am J Drug Alcohol Abuse 29:203–18.
Wallace J, McNeill D, Gilfillan D et al. (1988) Six-month treatment outcomes in socially stable alcoholics: abstinence rates. J Subst Abuse Treat 5:247–52.
Walsh DC, Hingson RW, Merrigan DM et al. (1991) A randomized trial of treatment options for alcohol-abusing workers. N Engl J Med 325:775–82.