Publisher’s version / Version de l'éditeur:
https://publications-cnrc.canada.ca/fra/droits
L’accès à ce site Web et l’utilisation de son contenu sont assujettis aux conditions présentées dans le site
LISEZ CES CONDITIONS ATTENTIVEMENT AVANT D’UTILISER CE SITE WEB.
Client Report (National Research Council of Canada. Construction), 2014-12-31
READ THESE TERMS AND CONDITIONS CAREFULLY BEFORE USING THIS WEBSITE. https://nrc-publications.canada.ca/eng/copyright
NRC Publications Archive Record / Notice des Archives des publications du CNRC : https://nrc-publications.canada.ca/eng/view/object/?id=0090aa54-11ad-4f1d-a598-53da0ef77e87 https://publications-cnrc.canada.ca/fra/voir/objet/?id=0090aa54-11ad-4f1d-a598-53da0ef77e87
NRC Publications Archive
Archives des publications du CNRC
For the publisher’s version, please access the DOI link below./ Pour consulter la version de l’éditeur, utilisez le lien DOI ci-dessous.
https://doi.org/10.4224/21274576
Access and use of this website and the material on it are subject to the Terms and Conditions set forth at
Solution for mid-rise wood construction: full-scale standard fire
resistance tests of wall assemblies for use in lower storeys of mid-rise
buildings: report to Research Consortium for Wood and Wood-Hybrid
Mid-Rise Buildings
Lafrance, P.-S.; Berzins, R.; Leroux, P.; Su, J. Z.; Lougheed, G. D.;
Bénichou, N.
+-NATIONAL RESEARCH COUNCIL CANADA
REPORT TO RESEARCH CONSORTIUM
FOR WOOD AND WOOD-HYBRID
MID-RISE BUILDINGS
Solution for Mid-Rise Wood Construction:
Full-Scale Standard Fire Resistance Tests
of Wall Assemblies for Use in Lower Storeys
of Mid-Rise Buildings
CLIENT REPORT: A1-100035-01.8
REPORT TO RESEARCH CONSORTIUM FOR WOOD
AND WOOD-HYBRID MID-RISE BUILDINGS
Solution for Mid-Rise Wood Construction:
Full-Scale Standard Fire Resistance Tests of Wall
Assemblies for Use in Lower Storeys of Mid-Rise Buildings
P.-S. Lafrance, R. Berzins, P. Leroux, J.Z. Su, G.D. Lougheed and
N. Bénichou
Report No.
A1-100035-01.8
Report date: December 31, 2014
Contract No. B-7000 (A1-100035)
Prepared for Canadian Wood Council
FPInnovations
Régie du bâtiment du Québec
HER MAJESTY THE QUEEN IN RIGHT OF ONTARIO as
represented by the Minister of Municipal Affairs and Housing
128 pages
SOLUTION FOR MID-RISE WOOD CONSTRUCTION:
FULL-SCALE STANDARD FIRE RESISTANCE TESTS OF WALL ASSEMBLIES FOR USE IN LOWER STOREYS OF MID-RISE BUILDINGS
P-S. Lafrance, R. Berzins, P. Leroux, J.Z. Su, G.D. Lougheed and N. Bénichou
INTRODUCTION
The acceptable solutions provided in the 2010 National Building Code (NBC) Division B [1] limits the use of combustible (wood) construction based on building height. For example, for Group C (Residential), Group D (Business and Personal Services) and Group E (Mercantile) occupancies, combustible construction can be used up to 4 storeys, and up to 2 storeys for Group A – Division 2 (Assembly) occupancies. In addition to the building height limitation, there are also building area limitations in the 2010 NBC for the use of combustible construction for these occupancies. For buildings that exceed the height and area requirements for combustible construction, the prescriptive requirements in the 2010 NBC require that noncombustible construction be used for the primary structural elements.
The prescriptive construction requirements for fire safety and protection of buildings, which are dependent upon the building size and occupancy type, are provided in Subsection 3.2.2 of the 2010 NBC. This includes the identification of the buildings for which noncombustible
construction is required. The intent of the prescriptive requirements for noncombustible
construction as they relate to the NBC fire safety/fire protection of building objectives is “to limit
the probability that combustible construction materials within a storey of a building will be involved in a fire, which could lead to the growth of fire, which could lead to the spread of fire within the storey during the time required to achieve occupant safety and for emergency responders to perform their duties, which could lead to harm to persons/damage to the building”.
The 2010 NBC defines noncombustible construction as “that type of construction in which a
degree of fire safety is attained by use of noncombustible construction materials for structural members and other building assemblies” [1]. Article 3.1.5.1 requires that a building or part of a
building required to be of noncombustible construction be constructed using noncombustible materials. The intent of this requirement, as it relates to the NBC fire safety/fire protection of building objectives, is “to limit the probability that construction materials will contribute to the
growth and spread of fire, which would lead to harm to persons/damage to the building”.
The NBC does permit, as exceptions, an extensive use of combustible materials in buildings otherwise required to have their primary structural elements to be of noncombustible
construction. The allowed materials and associated limitations are primarily provided in Articles 3.1.5.2 to 3.1.5.21. Generally, the combustible elements permitted relate to interior finishes, gypsum board, combustible roofing materials, combustible plumbing fixtures, cabling, protected insulation, flooring, combustible glazing, combustible cladding systems, non-loadbearing
to be of noncombustible construction. In the Scoping Study [2] for mid-rise and hybrid buildings, it was suggested that an alternative solution using wood construction may be developed to meet the intent of the prescriptive “noncombustibility” requirement for mid-rise (and taller) buildings. As one approach, encapsulation materials could be used to protect the combustible (wood) structural materials for a period of time in order to delay the effects of the fire on the combustible structural elements, including delay of ignition. In delaying ignition, any effects of the
combustion of the combustible structural elements on the fire severity can be delayed. In some cases, and depending upon the amount of encapsulating material used (e.g. number of layers), ignition of the elements might be avoided completely. This scenario would primarily depend upon the fire event and the actual fire performance of the encapsulating materials used. A research project, Wood and Wood-Hybrid Midrise Buildings, was undertaken to develop information to be used as the basis for alternative/acceptable solutions for mid-rise construction using wood structural elements. The effectiveness of the encapsulation approach in limiting the involvement of wood structural materials in fires was demonstrated in this research project through bench-, intermediate- and full-scale fire experiments. These results for encapsulated lightweight wood-frame (LWF) systems and encapsulated cross-laminated timber (CLT) systems are documented in a series of reports [
3
,4
,5
, 6].In addition to developing the encapsulation approach for protecting the wood structural materials to meet the above code intent, research was undertaken to examine standard fire resistance of encapsulated wood structural assemblies for use in mid-rise wood/timber buildings. One of the major differences between structural LWF assemblies used in mid-rise wood buildings (5-6 storeys) and low-rise wood buildings (≤ 4 stories) is the wall assemblies for the lower storeys. For mid-rise wood buildings, loadbearing wall assemblies on the lower storeys have to be designed to resist higher axial loads due to the self-weight of the upper storeys, which often result in the need for larger-size stud members and/or a greater number of studs, and higher lateral loads in case of seismic events or wind loads, which often requires the use of wood shear panels within the wall assembly. These wall assemblies very often will need to meet standard fire resistance requirements, and therefore, information regarding their
standard fire-resistance ratings should be developed. This report documents the results of full-scale furnace tests conducted to develop standard fire-resistance ratings of encapsulated LWF assemblies for use in mid-rise applications.
FULL-SCALE EXPERIMENTS Test Method and Setup
Full-scale furnace tests were conducted to determine the fire endurance period for five generic encapsulated LWF assemblies. The tests were conducted in conformance with CAN/ULC-S101 [7], with additional instrumentation installed for research data collection. Figure 1 shows the wall furnace used for fire resistance tests.
Figure 1. Full-scale wall furnace used for fire resistance tests.
Selection of Test Assemblies
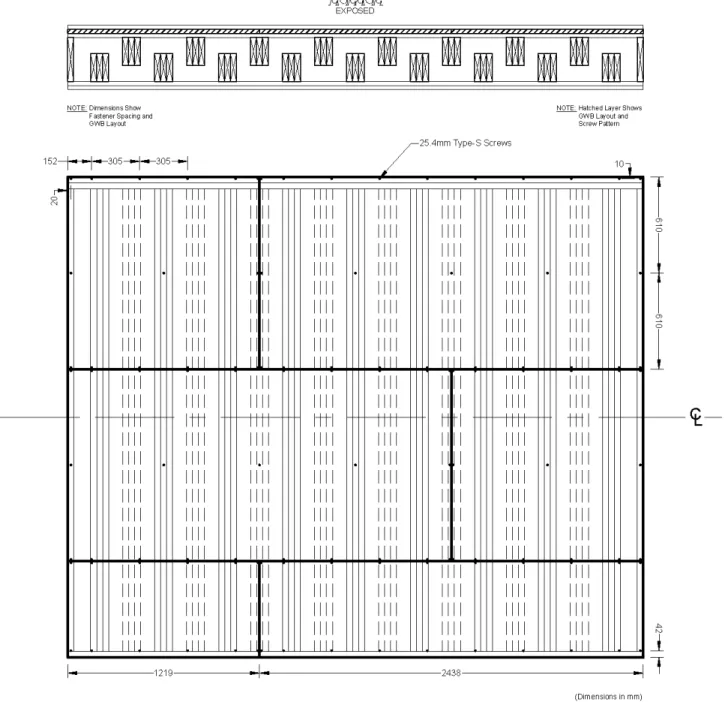
When wall assemblies are used to separate a dwelling unit from other spaces in a building, the NBC currently requires such walls to meet a Sound Transmission Class rating (STC rating) 50 or higher for direct airborne sound insulation. Extensive acoustic experiments were conducted to determine STC ratings for 49 encapsulated LWF wall assemblies with various stud sizes and configurations (staggered-stud; single-, double- or triple-stud; different stud spacing; built-up end columns; etc.) and with or without a shear membrane [8]. From the assemblies that met an STC rating of 50 or higher, five assemblies were selected for standard fire resistance testing. Table 1 shows the five wall assemblies with staggered-stud configurations developed and tested. The wall assemblies were encapsulated with a double layer of 12.7 mm thick Type X gypsum board on both sides applied with or without a shear membrane layer (a structural wood panel) and with or without resilient metal channels. Glass fibre insulation was installed in the wall cavities.
Table 1. Test Assemblies with Staggered Studs for Fire Resistance Tests
Wall Assembly
Stud Size Stud Spacing (mm o.c.) Size of Top Plate,* Bottom Plate, End Studs Shear Membrane Layer Resilient Metal Channels # 1 38 mm x 89 mm (2x4) 400 38 mm x 140 mm (2x6) OSB on unexposed side† -# 2 38 mm x 89 mm (2x4)Tri 400 38 mm x 140 mm (2x6) - exposed side‡only # 3 38 mm x 89 mm (2x4) 100 38 mm x 140 mm (2x6) - exposed side‡only # 4 38 mm x 89 mm (2x4) 400 38 mm x 140 mm (2x6) - -# 5 38 mm x 140 mm (2x6) 400 38 mm x 190 mm (2x8) OSB on unexposed side†
-* A double top plate was used.
Tri– triple-studs
†“unexposed side” refers to the side of the assembly facing away from the furnace. ‡“exposed side” refers to the side of the wall assembly facing into the furnace.
Description of Test Assemblies and Instrumentation
Wall Assembly #1
Wall Assembly #1 was a shear wall constructed using 2x4 (38 mm x 89 mm) staggered studs spaced at 400 mm o.c., a 2x6 (38 mm x 140 mm) double top plate, 2x6 single bottom plate and 2x6 single end studs. A shear membrane layer of 11.1 mm thick OSB was attached to one side of the framing. Two layers of 12.7 mm thick Type X gypsum board were applied to both sides of the framing. 90 mm thick glass fibre insulation was installed in the wall cavities. Figure 2 to Figure 7 show construction details of the wall assembly.
Figure 8 and Figure 9 show the installation locations of nine deflection gauges and nine padded thermocouples on the unexposed surface of the wall assembly. In addition, a set of 80
thermocouples were embedded at various interfaces across the wall assembly as shown in Figure 10, including gypsum board-gypsum board, gypsum board-stud, gypsum board-cavity, stud-cavity, cavity-OSB, stud-OSB and gypsum board-OSB interfaces.
A total superimposed load of 170 kN was applied along the width of the assembly, satisfying a full specified load condition as per CAN/ULC-S101. The side without the shear membrane layer was exposed to the fire.
Wall Assembly #2
Wall Assembly #2 was constructed using 2x4 (38 mm x 89 mm) staggered triple-studs spaced at 400 mm o.c., a 2x6 (38 mm x 140 mm) double top plate, 2x6 single bottom plate and 2x6 single end studs. Resilient metal channels were installed with a spacing of 600 mm o.c. on the exposed side of the framing. Two layers of 12.7 mm thick Type X gypsum board were applied to both sides of the framing. 90 mm thick glass fibre insulation was installed in the wall cavities. Figure 11 to Figure 17 show construction details of the wall assembly.
Figure 18 and Figure 19 show nine deflection gauges and nine padded thermocouples installed on the unexposed surface of the wall assembly. In addition, a set of 73 thermocouples were embedded at various interfaces across the wall assembly as shown in Figure 20, including gypsum board-gypsum board, gypsum board-stud, gypsum board-resilient metal channel, gypsum board-cavity and stud-cavity interfaces.
A total superimposed load of 456 kN was applied along the width of the assembly, satisfying a full specified load condition as per CAN/ULC-S101. The side with the resilient metal channels was exposed to the fire.
Figure 20. Thermocouples inside Wall Assembly #2.
Wall Assembly #3
Wall Assembly #3 was constructed using 2x4 (38 mm x 89 mm) staggered studs spaced at 100 mm o.c., a 2x6 (38 mm x 140 mm) double top plate, 2x6 single bottom plate and 2x6 single end studs. Resilient metal channels were installed with a spacing of 600 mm o.c. on the
exposed side of the framing. Two layers of 12.7 mm thick Type X gypsum board were applied to both sides of the framing. 90 mm thick glass fibre insulation was installed in the wall cavities. Figure 21 to Figure 26 show construction details of the wall assembly.
Figure 27 and Figure 28 show nine deflection gauges and nine padded thermocouples installed on the unexposed surface of the wall assembly. In addition, a set of 72 thermocouples were embedded at various interfaces across the wall assembly as shown in Figure 29, including gypsum board-gypsum board, gypsum board-stud, gypsum board-resilient metal channel, gypsum board-cavity and stud-cavity interfaces.
A total superimposed load of 624 kN was applied along the width of the assembly, satisfying a full specified load condition as per CAN/ULC-S101. The side with the resilient metal channels was exposed to the fire.
Wall Assembly #4
Wall Assembly #4 was constructed using 2x4 (38 mm x 89 mm) staggered studs spaced at 400 mm o.c., a 2x6 (38 mm x 140 mm) double top plate, 2x6 single bottom plate and 2x6 single end studs. Two layers of 12.7 mm thick Type X gypsum board were directly applied to both sides of the framing. 90 mm thick glass fibre insulation was installed in the wall cavities. Figure 30 to Figure 34 show construction details of the wall assembly.
Figure 35 and Figure 36 show nine deflection gauges and nine padded thermocouples installed on the unexposed surface of the wall assembly. In addition, a set of 68 thermocouples were embedded at various interfaces across the wall assembly as shown in Figure 37, including gypsum board-gypsum board, gypsum board-stud, gypsum board-cavity and stud-cavity interfaces.
A total superimposed load of 170 kN was applied along the width of the assembly, satisfying a full specified load condition as per CAN/ULC-S101. (Wall Assembly #4 was the same as Wall Assembly #1 but without the shear membrane layer).
Wall Assembly #5
Wall Assembly #5 was constructed using 2x6 (38 mm x 140 mm) staggered studs spaced at 400 mm o.c., a 2x8 (38 mm x 190 mm) double top plate, 2x8 single bottom plate and 2x8 single end studs. A shear membrane layer of 11.1 mm thick OSB was attached to one side of the framing. Two layers of 12.7 mm thick Type X gypsum board were applied to both sides of the framing. 140 mm thick glass fibre insulation was installed in the wall cavities. The insulation was installed with its back side (side facing the studs) partially scored (leaving approximately 70 mm not scored) so that it wrapped around the center staggered stud and that the gypsum board was not put under excessive stress. Figure 38 to Figure 43 show construction details of the wall assembly.
Figure 44 and Figure 45 show nine deflection gauges and nine padded thermocouples installed on the unexposed surface of the wall assembly. In addition, a set of 80 thermocouples were embedded at various interfaces across the wall assembly as shown in Figure 46, including gypsum board-gypsum board, gypsum board-stud, gypsum board-cavity, stud-cavity, cavity-OSB, stud-OSB and gypsum board-OSB interfaces.
A total superimposed load of 506 kN was applied along the width of the assembly, satisfying a full specified load condition as per CAN/ULC-S101. The side without the shear membrane layer was exposed to the fire.
RESULTS
The test results are summarized in Table 2. The fire endurance period provided in the table is the time for structural failure of the assembly. All of the assemblies failed structurally prior to failure due to either transmission of heat through the test assembly or passage of flame or hot gases to the unexposed side, as defined in CAN/ULC-S101.
Table 2. Test Assemblies with Staggered Studs for Fire Resistance Tests
Wall Assembly
*
Stud Size Stud Spacing (mm o.c.) OSB Shear Membrane Layer (11.1 mm thick) Resilient Metal Channels @ 600 mm o.c. Glass Fibre Thick ness (mm) Applied Load (kN) FEP (min) # 1 38 mm x 89 mm (2x4) 400 unexposed side† - 90 170 (92**)93 # 2 38 mm x 89 mm
(2x4)Tri 400 - sideexposed ‡only 90 456 90
# 3 38 mm x 89 mm (2x4) 100 - exposed side‡only 90 624 75 # 4 38 mm x 89 mm (2x4) 400 - - 90 170 87 # 5 38 mm x 140 mm (2x6) 400 unexposed side† - 140 506 81
FEP – Fire endurance period
Tri- t triple-studs
* 2 x 12.7 mm thick Type X gypsum board on both sides of the assembly
†“unexposed side” refers to the side of the assembly facing away from the furnace.
** see discussion in “Results – Test Assembly #1” below for reduced FEP value.
‡“exposed side” refers to the side of the wall assembly facing into the furnace.
Wall Assembly #1
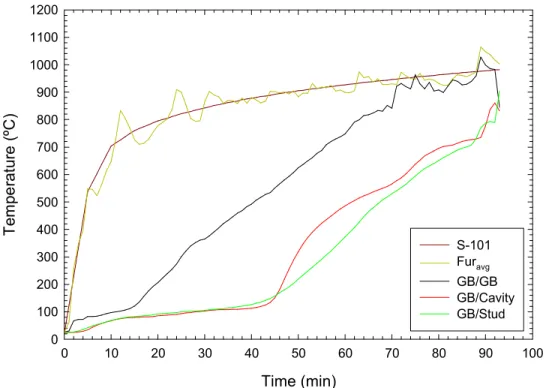
Data plots for all the measurements for Wall Assembly #1 are provided in Appendix A. Figure 47 shows the average furnace temperature (Furavg) measured during the test for Wall Assembly #1.
There were temperature variations throughout the test due to pressure changes in the propane line to the furnace. The application of the correction factor equation in CAN/ULC- S101 [7], used in adjusting the fire endurance period if the measured average temperature in the furnace was higher or lower than the standard furnace curve, indicates that the measured fire endurance period (FEP) should be reduced by 1.3 min.
Also shown in Figure 47 are the average temperatures measured at the interface between the face and base layers of gypsum board (GB/GB), the interface between the base gypsum board layer and the wall cavity (GB/Cavity), and the interface between the base gypsum board layer and the studs (GB/stud), on the exposed side of the wall assembly.
temperature in the furnace. This suggests much of the face layer of gypsum board remained in place until near the end of the test.
There was a slow temperature increase at the interface between the base gypsum board layer and the cavity, and between the base layer and the studs, with the temperatures < 150C for 44 min. Subsequently, there was a more rapid temperature increase at both interfaces with the fastest increase at the gypsum board-cavity interface. The temperatures exceeded 300C at the gypsum board-cavity and the gypsum board-stud interfaces at 50 min and 56 min, respectively. The temperatures were < 600C for 72 min. The average temperatures at both locations did not reach temperatures comparable to the furnace temperature, indicating that much of the base layer of gypsum board remained in place until the end of the test.
Figure 48 shows the average temperatures at the interfaces between the studs and the wall cavity. The measurement locations were: the side of the studs on the exposed side of the wall (Stud Side), the face of the studs on the unexposed side of the wall assembly (Stud Face Unexposed Side), and the face of the studs on the exposed side of the wall assembly (Stud Face Exposed Side). Also shown is the average temperature at the interface between the cavity and the OSB shear membrane layer on the unexposed side of the wall assembly (Cavity/OSB). Comparable temperatures were measured on the sides of the studs on the exposed side of the wall assembly and on the face of the studs on the unexposed side of the wall assembly. The average temperatures remained < 100C for 53 min and < 300C for 75 min. Comparable temperatures were also measured on the face of the studs on the exposed side of the wall assembly and at the interface between the cavity and the OSB shear membrane layer.
The average temperatures measured on the unexposed side of the wall assembly are shown in Figure 49. This includes the average temperatures at the interface between the studs and the OSB shear membrane layer (Stud/OSB), at the interface between the OSB and the base
gypsum board layer (OSB/GB), at the interface between the base and face layers of gypsum on the unexposed side (GB/GB), and on the unexposed surface of the wall assembly (Unexposed). There was a gradual temperature increase at all locations beginning at approximately 15 min. However, the temperatures remained < 200C throughout the test. This indicates there were minimal thermal effects on the unexposed side of the wall assembly.
Figure 50 shows the average and maximum deflections measured for Wall Assembly #1. The maximum deflection was measured by Deflection Gauge 5 located at the center of the wall assembly. There was minimal deflection for the initial 70 min. Subsequently, there was a continuous increase in the rate at which the assembly deflected until structural failure.
Time (min) 0 10 20 30 40 50 60 70 80 90 100 T em pe ra tu re ( ºC ) 0 100 200 300 400 500 600 700 800 900 1000 1100 1200 S-101 Furavg GB/GB GB/Cavity GB/Stud
Notes: GB/GB is the average of TCs #10- 21; GB/Cavity is the average of TCs #22, 25, 27, 28, 30 and 33; GB/Stud is the average of TCs #23, 24, 26, 29, 31 and 32.
Figure 47. Furnace temperatures and average temperatures at interfaces on exposed side of Wall Assembly #1. 0 10 20 30 40 50 60 70 80 90 100 T em pe ra tu re ( ºC ) 0 100 200 300 400 500 600 700 800 900 1000 1100 1200 Stud Side
Stud Face Unexposed Side Stud Face Exposed Side Cavity/OSB (unexposed side)
Time (min) 0 10 20 30 40 50 60 70 80 90 100 T em p er at ur e (º C ) 0 20 40 60 80 100 120 140 160 180 200 Stud/OSB OSB/GB GB/GB (unexposed) Unexposed
Notes: Stud/OSB is the average of TCs #60 and 63; OSB/GB is the average of TCs #66-77; GB/GB (unexposed) is the average of TCs #78-89; Unexposed is the average of TCs #1-9.
Figure 49. Average temperatures on unexposed side for Wall Assembly #1.
0 10 20 30 40 50 60 70 80 90 100 D ef le ct io n (m m ) -100 -90 -80 -70 -60 -50 -40 -30 -20 -10 0 10 Average Deflection Maximum Deflection
Wall Assembly #2
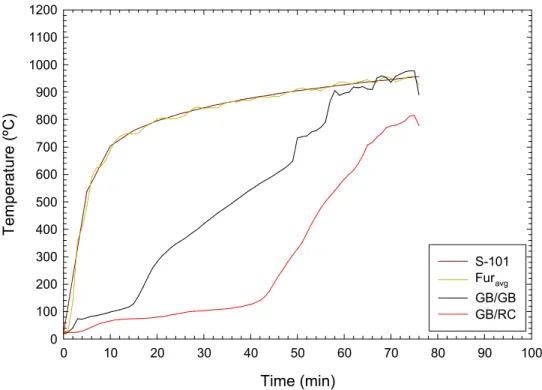
Data plots for all the measurements for Wall Assembly #2 are provided in Appendix B. Figure 51 shows the average furnace temperature (Furavg) measured during the test for Wall Assembly #2.
There is a good comparison between the measured temperature and the temperature specified in CAN/ULC-S101 [7].
Also shown in Figure 51 are the average temperatures measured at the interface between the face and base layers of gypsum board (GB/GB), and the interface between the base gypsum board layer and resilient metal channel (GB/RC), on the exposed side of the wall assembly. The average temperature at the interface between the face and base gypsum board layers was < 100C for 14 min and was > 300C after 22 min. After 14 min, there was a continuous
increase in temperature until 69 min. After 69 min, the temperature was comparable to the temperature in the furnace. This suggests much of the face layer of gypsum board remained in place until near the end of the test.
There was a slow temperature increase at the interface between the base gypsum board layer and the resilient metal channel, with the temperature < 150C for 42 min. Subsequently, there was a more rapid temperature increase. The temperatures exceeded 300C at 48 min and 600C at 64 min. The average temperature did not reach temperatures comparable to the furnace temperature, indicating that much of the base layer of gypsum board remained in place until the end of the test.
Figure 52 shows the average temperatures at the interfaces between the studs and the wall cavity. The measurement locations were: the side of the studs on the exposed side of the wall (Stud Side), the face of the studs on the unexposed side of the wall assembly (Stud Face Unexposed Side), and the face of the studs on the exposed side of the wall assembly (Stud Face Exposed Side). Also shown is the average temperature at the interface between the cavity and the gypsum board base layer on the unexposed side of the wall assembly (Cavity/GB). Comparable temperatures were measured on the sides of the studs on the exposed side of the wall assembly and on the face of the studs on the unexposed side of the wall assembly. The average temperatures remained < 100C for 53 min and < 300C for 74 min. Comparable temperatures were also measured on the face of the studs on the exposed side of the wall assembly and at the interface between the cavity and the gypsum board base layer on the unexposed side of the assembly.
The average temperatures measured on the unexposed side of the wall assembly are shown in Figure 53. This includes the average temperatures at the interface between the studs and the gypsum board base layer (Stud/GB), at the interface between the base and face layers of gypsum on the unexposed side (GB/GB), and on the unexposed surface of the wall assembly (Unexposed). (Note: TC 7 was damaged prior to the test and is not included in the average temperature on the unexposed side of the wall assembly.)
The temperature measured at the interface between the studs and the gypsum board on the unexposed side had the lowest temperature increase. This indicates that the gypsum board remained in contact with the studs until the end of the test and that the heat transfer through the stud was less than through the 2 layers of gypsum board on the unexposed side of the
assembly.
Figure 54 shows the average and maximum deflections measured for Wall Assembly #2. The maximum deflection was measured by Deflection Gauge 5 located at the center of the wall assembly. There was minimal deflection for the initial 60 min. Subsequently, there was a continuous increase in the rate at which the assembly deflected until structural failure.
Time (min) 0 10 20 30 40 50 60 70 80 90 100 T em pe ra tu re ( ºC ) 0 100 200 300 400 500 600 700 800 900 1000 1100 1200 S-101 Furavg GB/GB GB/RC
Notes: GB/GB is the average of TCs #10-21; GB/RC is the average of TCs #22-33.
Figure 51. Furnace temperatures and average temperatures at interfaces on exposed side of Wall Assembly #2. Time (min) 0 10 20 30 40 50 60 70 80 90 100 T em pe ra tu re ( ºC ) 0 100 200 300 400 500 600 700 800 Stud Side
Stud Face Unexposed Side Stud Face Exposed Side Cavity/GB (unexposed side)
Time (min) 0 10 20 30 40 50 60 70 80 90 100 T em pe ra tu re ( ºC ) 0 20 40 60 80 100 120 140 160 180 200 Stud/GB GB/GB Unexposed
Notes: Stud/GB is the average of TCs #59, 62, 64, 65, 67 and 70; GB/GB is the average of TCs #71-82; Unexposed is the average of TCs #1-9.
Figure 53. Average temperatures on unexposed side for Wall Assembly #2.
0 20 40 60 80 100 D ef le ct io n (m m ) -100 -90 -80 -70 -60 -50 -40 -30 -20 -10 0 10 Average Deflection Maximum Deflection
Wall Assembly #3
Data plots for all the measurements for Wall Assembly #3 are provided in Appendix C. Figure 55 shows the average furnace temperature (Furavg) measured during the test for Wall Assembly
#3. There is a good comparison between the measured temperature and the temperature specified in CAN/ULC-S101 [7].
Also shown in Figure 55 are the average temperatures measured at the interface between the face and base layers of gypsum board (GB/GB), and the interface between the base gypsum board layer and resilient metal channel (GB/RC), on the exposed side of the wall assembly. The average temperature at the interface between the face and base gypsum board layers was < 100C for 11 min and was > 300C after 21 min. After 11 min, there was a continuous
increase in temperature until 49 min, at which time there was a sharp increase in temperature indicating a piece of the face layer of gypsum board fell off . After 49 min, the temperature continued to increase until 58 min, at which time the temperature was comparable to the temperature in the furnace. This suggests much of the face layer of gypsum board remained in place until near the end of the test.
There was a slow temperature increase at the interface between the base gypsum board layer and the resilient metal channel, with the temperature < 150C for 42 min. Subsequently, there was a more rapid temperature increase. The temperatures exceeded 300C at 49 min and 600C at 61 min. The average temperature did not reach temperatures comparable to the furnace temperature, indicating that much of the base layer of gypsum board remained in place until the end of the test.
Figure 56 shows the average temperatures at the interfaces between the studs and the wall cavity. The measurement locations were: the side of the studs on the exposed side of the wall (Stud Side), the face of the studs on the unexposed side of the wall assembly (Stud Face Unexposed Side), and the face of the studs on the exposed side of the wall assembly (Stud Face Exposed Side). Also shown is the average temperature at the interface between the cavity and the gypsum board base layer on the unexposed side of the wall assembly (Cavity/GB). There was a slow temperature increase on the sides of the studs on the exposed side of the wall assembly. The average temperatures remained < 100C for 54 min and < 300C for 66 min. The average temperature measured on the face of the studs on the unexposed side had a slow temperature increase with the average temperature < 100C for 59 min and < 300C for 71 min. Comparable temperatures were measured on the face of the studs on the exposed side of the wall assembly and at the interface between the cavity and the gypsum board base layer on the unexposed side of the assembly. The average temperatures were < 200C until the end of the test.
The average temperatures measured on the unexposed side of the wall assembly are shown in Figure 57. This includes the average temperatures at the interface between the studs and the
There was a gradual temperature increase at all locations beginning at approximately 15 min. However, the temperatures remained < 125C throughout the test. This indicates there were minimal thermal effects on the unexposed side of the wall assembly.
Figure 58 shows the average and maximum deflections measured for Wall Assembly #3. The maximum deflection was measured by Deflection Gauge 5 located at the center of the wall assembly. There was minimal deflection for the initial 35 min. Subsequently, there was a continuous increase in the rate at which the assembly deflected until structural failure.
Time (min) 0 10 20 30 40 50 60 70 80 90 100 T em pe ra tu re ( ºC ) 0 100 200 300 400 500 600 700 800 900 1000 1100 1200 S-101 Furavg GB/GB GB/RC
Notes: GB/GB is the average of TCs #10-21; GB/RC is the average of TCs #22-33.
Figure 55. Furnace temperatures and average temperatures at interfaces on exposed side of Wall Assembly #3. Time (min) 0 10 20 30 40 50 60 70 80 90 100 T e m p er at ur e ( ºC ) 0 100 200 300 400 500 600 700 800 Stud Side
Stud Face Unexposed Side Stud Face Exposed Side Cavity/GB (unexposed side)
Time (min) 0 10 20 30 40 50 60 70 80 90 100 T em pe ra tu re ( ºC ) 0 20 40 60 80 100 120 140 160 180 200 Stud/GB GB/GB Unexposed
Notes: Stud/GB is the average of TCs #58, 63 and 69; GB/GB is the average of TCs #70-81; Unexposed is the average of TCs #1-9.
Figure 57. Average temperatures on unexposed side for Wall Assembly #3.
0 10 20 30 40 50 60 70 80 90 100 D ef le ct io n (m m ) -100 -90 -80 -70 -60 -50 -40 -30 -20 -10 0 10 Average Deflection Maximum Deflection
Wall Assembly #4
Data plots for all the measurements for Wall Assembly #4 are provided in Appendix D. Figure 59 shows the average furnace temperature (Furavg) measured during the test for Wall Assembly
#4. There were temperature variations in the initial 10 min of the test due to pressure changes in the propane line to the furnace. The application of the correction factor equation in CAN/ULC-S101 [7], used in adjusting the fire endurance period if the measured average temperature in the furnace was higher or lower than the standard furnace curve, indicates that the measured fire endurance period should be increased by 0.2 min.
Also shown in Figure 59 are the average temperatures measured at the interface between the face and base layers of gypsum board (GB/GB), the interface between the base gypsum board layer and the wall cavity (GB/Cavity), and the interface between the base gypsum board layer and the studs (GB/Stud), on the exposed side of the wall assembly.
The average temperature at the interface between the face and base gypsum board layers was < 100C for 15 min and was > 300C after 24 min. After 15 min, there was a continuous
increase in temperature until 68 min. After 68 min, the temperature was comparable to the temperature in the furnace. This suggests much of the face layer of gypsum board remained in place until near the end of the test.
There was a slow temperature increase at the interface between the base gypsum board layer and the cavity and between the base layer and the studs, with the temperatures < 150C for 43 min. Subsequently, there was a more rapid temperature increase at both interfaces, with the fastest increase at the gypsum board-cavity interface. The temperatures exceeded 300C at the gypsum board-cavity and the gypsum board-stud interfaces at 48 min and 54 min, respectively. The temperatures were < 600C for 63 min. The average temperatures at both locations did not reach temperatures comparable to the furnace temperature, indicating that much of the base layer of gypsum board remained in place until the end of the test.
Figure 60 shows the average temperatures at the interface between the studs and the wall cavity. The measurement locations were: the side of the studs on the exposed side of the wall (Stud Side), the face of the studs on the unexposed side of the wall assembly (Stud Face Unexposed Side), and the face of the studs on the exposed side of the wall assembly (Stud Face Exposed Side). Also shown is the average temperature at the interface between the cavity and the gypsum board base layer on the unexposed side of the wall assembly (Cavity/GB). There was a slow temperature increase on the sides of the studs on the exposed side of the wall assembly. The average temperature was < 100C for 52 min and < 300C for 82 min. The average temperature measured on the face of the studs on the unexposed side had a slow temperature increase with the average temperature < 100C for 50 min and < 300C for 70 min. Comparable temperatures were measured on the face of the studs on the exposed side of the wall assembly and at the interface between the cavity and the gypsum board base layer on the exposed side.
There was a gradual temperature increase at all locations beginning at approximately 15 min. However, the temperatures remained < 100C throughout the test. This indicates there were minimal thermal effects on the unexposed side of the wall assembly.
Figure 62 shows the average and maximum deflections measured for Wall Assembly #4. The maximum deflection was measured by Deflection Gauge 5 located at the center of the wall assembly. There was minimal deflection for the initial 50 min. Subsequently, there was a continuous increase in the rate at which the assembly deflected until structural failure.
Wall Assembly #4 was the same as Wall Assembly #1 but without the shear membrane layer. Results from Test 1 and Test 4 show that the OSB shear membrane layer contributed
approximately 4-5 min to the fire endurance period, as adjusted using the correction factor equation in CAN/ULC-S101 as discussed above.
Time (min) 0 10 20 30 40 50 60 70 80 90 100 T em pe ra tu re ( ºC ) 0 100 200 300 400 500 600 700 800 900 1000 1100 1200 S101 Furavg GB/GB GB/Cavity GB/Stud
Notes: GB/GB is the average of TCs #10-21; GB/Cavity is the average of TCs #22, 25, 27, 28, 30 and 33; GB/Stud is the average of TCs #23, 24, 26, 29, 31 and 32.
Figure 59. Furnace temperatures and average temperatures at interfaces on exposed side of Wall Assembly #4. 0 10 20 30 40 50 60 70 80 90 100 T em pe ra tu re ( ºC ) 0 100 200 300 400 500 600 700 800 Stud Side
Stud Face Unexposed Side Stud Face Exposed Side Cavity/GB (unexposed side)
Time (min) 0 10 20 30 40 50 60 70 80 90 100 T em pe ra tu re ( ºC ) 0 20 40 60 80 100 120 140 160 180 200 Stud/GB GB/GB
Notes: Stud/GB is the average of TCs #60 and 63; GB/GB is the average of TCs #66-77; Unexposed is the average of TCs #1-9.
Figure 61. Average temperatures on unexposed side for Wall Assembly #4.
0 10 20 30 40 50 60 70 80 90 100 D ef le ct io n (m m ) -100 -90 -80 -70 -60 -50 -40 -30 -20 -10 0 10 Average Deflection Maximum Deflection
Wall Assembly #5
Data plots for all the measurements for Wall Assembly #5 are provided in Appendix E. Figure 63 shows the average furnace temperature (Furavg) measured during the test for Wall Assembly #5.
There is a good comparison between the measured temperature and the temperature specified in CAN/ULC-S101 [7].
Also shown in Figure 63 are the average temperatures measured at the interface between the face and base layers of gypsum board (GB/GB), the interface between the base gypsum board layer and the wall cavity (GB/Cavity), and the interface between the base gypsum board layer and the studs (GB/stud), on the exposed side of the wall assembly. (Note: The temperatures measured by TC 33 were not included in the average temperature at the interface between the base gypsum board layer and the wall cavity. The temperature measured by this thermocouple was considerably lower than measured by the other five thermocouples and, as a result, is believed to have malfunctioned.)
The average temperature at the interface between the face and base gypsum board layers was < 100C for 12.3 min and was > 300C after 21.3 min. After 12 min, there was a continuous increase in temperature until 63 min. After 63 min, the temperature was comparable to the temperature in the furnace. This suggests much of the face layer of gypsum board remained in place until near the end of the test.
There was a slow temperature increase at the interface between the base layer of gypsum board and the cavity and between the base layer and the studs with the temperatures < 150C for 41.3 min. Subsequently, there was a more rapid temperature increase at both interfaces, with the fastest increase at the gypsum board-cavity interface. The temperatures exceeded 300C at the gypsum board-cavity and the gypsum board-stud interfaces at 45.8 min and 52.2 min, respectively. The temperatures were < 600C for 64.2 min. The average temperatures at both locations did not reach temperatures comparable to the furnace temperature, indicating that much of the base layer of gypsum board remained in place until the end of the test.
Figure 64 shows the average temperatures at the interfaces between the studs and the wall cavity. The measurement locations were: the side of the studs on the exposed side of the wall (Stud Side), the face of the studs on the unexposed side of the wall assembly (Stud Face Unexposed Side), and the face of the studs on the exposed side of the wall assembly (Stud Face Exposed Side). Also shown is the average temperature at the interface between the cavity and the OSB shear membrane layer on the unexposed side of the wall assembly (Cavity/OSB). There was a slow temperature increase on the sides of the studs on the exposed side of the wall assembly. The average temperature was < 100C for 63.7 min and < 300C for 76.3 min. The average temperature measured on the face of the studs on the unexposed side had a slow temperature increase with the average temperature < 100C for 51.2 min and < 300C for 73 min.
Comparable temperatures were measured on the face of the studs on the exposed side of the wall assembly and at the interface between the cavity and the OSB shear membrane layer on
OSB shear membrane layer (Stud/OSB), at the interface between the OSB and the base
gypsum board layer (OSB/GB), at the interface between the base and face layers of gypsum on the unexposed side (GB/GB), and on the unexposed surface (Unexposed).
There was a gradual temperature increase at all locations beginning at approximately 15 min. The temperatures at all locations were < 80C until near the end of the test. After 77 min, there was a rapid increase in temperature at the interface between the stud and the OSB shear membrane layer, indicating this area was exposed to high temperatures.
Figure 66 shows the average and maximum deflections measured for Wall Assembly #5. The maximum deflection was measured by Deflection Gauge 5 located at the center of the wall assembly. There was minimal deflection for the initial 60 min. Subsequently, there was a continuous increase in the rate at which the assembly deflected until structural failure.
At the structural failure of Wall Assembly #5, constructed using 2x6 staggered studs, many of the studs, particularly those on the exposed side of the assembly, deformed within the plane of the wall rather than perpendicular to the wall plane.
Time (min) 0 10 20 30 40 50 60 70 80 90 100 T e m p er a tu re ( ºC ) 0 100 200 300 400 500 600 700 800 900 1000 1100 1200 S101 Furavg GB/GB GB/Cavity GB/Stud
Notes: GB/GB is the average of TCs #10-21; GB/Cavity is the average of TCs #22, 25, 27, 28, 30 and 33; GB/Stud is the average of TCs #23, 24, 26, 29, 31 and 32.
Figure 63. Furnace temperatures and average temperatures at interfaces on exposed side of Wall Assembly #5. 0 10 20 30 40 50 60 70 80 90 T e m p er at ur e ( ºC ) 0 100 200 300 400 500 600 700 800 Stud Side
Stud Face Unexposed Side Stud Face Exposed Side Cavity/OSB (unexposed side)
Time (min) 0 10 20 30 40 50 60 70 80 90 T em pe ra tu re ( ºC ) 0 20 40 60 80 100 120 140 160 180 200 Stud/OSB OSB/GB GB/GB
Notes: Stud/OSB is the average of TCs #60 and 63; OSB/GB is the average of TCs #66-77; GB/GB (unexposed) is the average of TCs #78-89; Unexposed is the average of TCs #1-9.
Figure 65. Average temperatures on unexposed side for Wall Assembly #5.
0 10 20 30 40 50 60 70 80 90 D ef le ct io n (m m ) -100 -90 -80 -70 -60 -50 -40 -30 -20 -10 0 10 Average Deflection Maximum Deflection
ADDITIONAL OBSERVATIONS
The times at which the average temperature measured at the interface between the face and base layer of gypsum board on the exposed side of the assembly exceeded 300C are provided in Table 3 for each of the wall assemblies. There was limited variation in the times, ranging from 21 min for Assembly #3 to 24 min for Assemblies #1 and #4.
Table 3 also shows the times at which the average temperature on the unexposed side of the base layer of gypsum board on the exposed side of the wall assembly exceeded 300C (i.e. the side of the base layer of gypsum board on the exposed side of the wall assembly that is facing towards the interior of the wall). The times for the gypsum board interface with the cavity and for the gypsum board interface with the resilient metal channel were comparable (47 – 50 min in all cases). Slightly longer times were required for the average temperatures measured at the interfaces between the gypsum board and the studs. This suggests that the insulation in the wall cavity affects the temperature increase at the interface between the gypsum board and the cavity and at the interface between the gypsum board and the resilient metal channel differently than the stud does at the interface between the gypsum board and the stud.
Other general observations based on the test results are as follows:
1. The average temperature at the interface between the face and base layers of gypsum board on the exposed side was < the furnace temperature until late in the test (58 – 70 min). This suggests that much of the face layer of gypsum board remained in place until near the end of the test.
2. The average temperature on the unexposed side of the base layer of gypsum board was < the furnace temperature until the end of the test. This suggests that much of the base layer remained in place throughout the test. This was consistent with observations during the test that most of the flames from the wall assembly were at the gypsum board joints.
3. The average temperatures measured on the sides of the studs on the exposed side of the assembly and the face of the studs on the exposed side of the assembly were < 300C for 66 – 76 min. This suggests that the high temperature effects on the studs were localized.
4. Low average temperatures (< 200C) were measured at the other interfaces in the wall assemblies in most cases throughout the test or in some cases near the end of the test. This suggests that there was minimal heat effect on the unexposed side of the wall assembly.
Table 3. Times at which temperature at selected interfaces exceeded 300C. Time at which average temperature >300C (min)
Assembly GB/GB GB/Stud GB/Cavity GB/RC
1 24 56 50 NA
2 22 NA NA 48
3 21 NA NA 49
4 24 54 48 NA
5 21 52 47 NA
GB – Gypsum Board RC – Resilient Metal Channel NA – Not Applicable
SUMMARY
This report documents the results of full-scale furnace tests conducted to investigate the standard fire resistance performance of five generic wall assemblies. Staggered studs were used for all the assemblies and both sides of the assemblies were protected using two layers of 12.7 mm thick Type X gypsum board. The wall assemblies provided fire endurance periods of 75 min or higher. Two wall assemblies (#1 and #2) had fire endurance periods 90 min.
ACKNOWLEDGMENTS
Financial and in-kind support for the project provided by the following organizations is gratefully acknowledged:
Canadian Wood Council
Forestry Innovation Investment BC FPInnovations
Ontario Ministry of Municipal Affairs and Housing National Research Council Canada
Natural Resources Canada Régie du Bâtiment du Québec
Québec Government (Société d’Habitation du Québec, Société Immobilière du Québec, ministère des Ressources naturelles)
Extensive technical input by staff from collaborating organizations is also gratefully acknowledged:
REFERENCES
1. 2010 NBC, National Building Code of Canada, National Research Council, Ottawa, Ontario, 2010.
2. Su, J., Gover, B., Lougheed, G., Benichou, N., Swinton, M., Schoenwald, S., Lacasse, M., Di Lenardo, B., Mostafaei, H. and Pernica, G., Wood And Wood-Hybrid Mid-Rise Buildings, Phase 1: Scoping Study, B4726.1, National Research Council, Ottawa, Ontario, 2011. 3. Bijloos, M., Lougheed, G., Su, J. and Bénichou, N., Alternative Solution for Mid-Rise Wood
Construction: Cone Calorimeter Results for Encapsulation Materials, CLIENT REPORT A1-100035-01.1, National Research Council, Ottawa, Ontario, 2013.
4. Berzins, R., Lafrance, P-S., Leroux, P., Lougheed, G.D., Su, J.Z. and Bénichou, N.,
Alternative Solution for Mid-Rise Wood Construction: Intermediate-Scale Furnace Tests with Encapsulation Materials, CLIENT REPORT A1-100035-01.2, National Research Council, Ottawa, Ontario, 2013.
5. …, Alternative Solution for Mid-Rise Wood Construction: Full-Scale Apartment Fire Test with Encapsulated Lightweight Wood Frame Construction, CLIENT REPORT A1-100035-01.9, National Research Council, Ottawa, Ontario, 2013.
6. …, Alternative Solution for Mid-Rise Wood Construction: Full-Scale Apartment Fire Test with Encapsulated Cross Laminated Timber Construction, CLIENT REPORT A1-100035-01.10, National Research Council, Ottawa, Ontario, 2013.
7. CAN/ULC-S101, Standard Methods of Fire Endurance Tests of Building Construction and Materials Underwriters Laboratories of Canada, Ottawa, Ontario, 2007.
8. Schoenwald, S., Zeitler, B., King, F. and Sabourin, I., Acoustics – Sound Insulation in Mid-Rise Wood Buildings, CLIENT REPORT A1-100035-02.1, National Research Council, Ottawa, Ontario, 2013.
APPENDIX A - DATA FOR WALL ASSEMBLY #1
A series of plots showing the results of the measurements for Wall Assembly #1 are provided. The plots are:
1. Figures A-1 and A-2 show the temperatures measured at the interface between the face and base layers of gypsum board on the exposed side of the wall assembly at the ¼ and ¾ heights from the top of assembly, respectively.
2. Figure A-3 shows the temperatures measured at the interface between the base layer of gypsum board and the studs on the exposed side of the wall assembly.
3. Figure A-4 shows the temperatures measured at the interface between the base layer of gypsum board and the wall cavity on the exposed side of the wall assembly.
4. Figures A-5 and A-6 show the temperatures measured on the sides of the studs on the exposed side of the wall assembly at the ¼ and ¾ heights from the top of assembly, respectively.
5. Figures A-7 and A-8 show the temperatures measured on the face of the studs on the unexposed and exposed side of the wall assembly, respectively.
6. Figures A-9 and A-10 show the temperatures measured at the interface between the wall cavity and the OSB shear membrane layer on the unexposed side and between the stud and the OSB shear membrane layer on the unexposed side, respectively.
7. Figures A-11 and A-12 show the temperatures measured at the interface between the OSB shear membrane layer and the base gypsum board layer on the unexposed side of the wall assembly at the ¼ and ¾ heights from the top of assembly, respectively.
8. Figures A-13 and A-14 show the temperatures measured at the interface between the base and face gypsum board layers on the unexposed side of the wall assembly at the ¼ and ¾ heights from the top of assembly, respectively.
9. Figure A-15 shows the temperatures measured on the unexposed side of the wall assembly.
10. Figure A-16 shows the average furnace temperature measured during the test. (Note: there were problems with the pressure in the propane line to the furnace during the test. This resulted in some variation in the temperature during the initial portion of the test.) 11. Figures A-17, A-18 and A-19 show the deflections measured at the ¼, mid- and ¾
Time (min) 0 10 20 30 40 50 60 70 80 90 100 T em pe ra tu re ( ºC ) 0 100 200 300 400 500 600 700 800 900 1000 1100 1200 TC 10 TC 11 TC 12 TC 13 TC 14 TC 15
Figure A-1. Temperatures measured at interface between face and base gypsum board layers at ¼ height from top on exposed side of wall assembly.
0 10 20 30 40 50 60 70 80 90 100 T e m p er at ur e (º C ) 0 100 200 300 400 500 600 700 800 900 1000 1100 1200 TC 16 TC 17 TC 18 TC 19 TC 20 TC 21
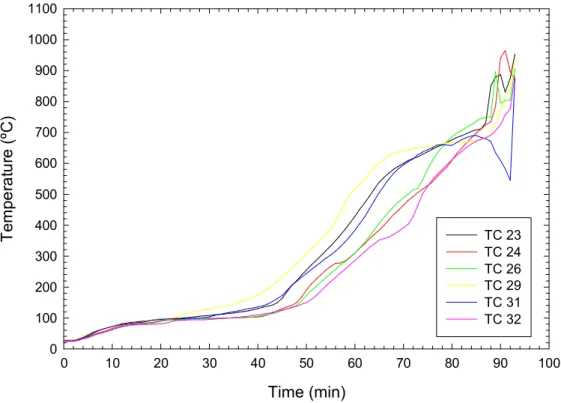
Time (min) 0 10 20 30 40 50 60 70 80 90 100 T em pe ra tu re ( ºC ) 0 100 200 300 400 500 600 700 800 900 1000 1100 TC 23 TC 24 TC 26 TC 29 TC 31 TC 32
Figure A-3. Temperatures measured at interface between base gypsum board layer and studs on exposed side of wall assembly.
0 10 20 30 40 50 60 70 80 90 100 T em pe ra tu re ( ºC ) 0 100 200 300 400 500 600 700 800 900 1000 1100 TC 22 TC 25 TC 27 TC 28 TC 30 TC 33
Time (min) 0 20 40 60 80 100 T em pe ra tu re ( ºC ) 0 100 200 300 400 500 600 700 800 900 1000 1100 TC 34 TC 35 TC 36 TC 37 TC 38 TC 39
Figure A-5. Temperatures measured on sides of studs on exposed side at ¼ height from top of wall assembly.
0 20 40 60 80 100 T em pe ra tu re ( ºC ) 0 100 200 300 400 500 600 700 800 900 1000 1100 TC 40 TC 41 TC 42 TC 43 TC 44 TC 45
Time (min) 0 10 20 30 40 50 60 70 80 90 100 T em pe ra tu re ( ºC ) 0 100 200 300 400 500 600 700 800 900 1000 1100 TC 46 TC 47 TC 48 TC 49 TC 50 TC 51
Figure A-7. Temperatures measured on face of studs on unexposed side of wall assembly. 0 10 20 30 40 50 60 70 80 90 100 T em pe ra tu re ( ºC ) 0 100 200 300 400 500 600 700 800 900 1000 1100 TC 52 TC 53 TC 54 TC 55 TC 56 TC 57
Time (min) 0 10 20 30 40 50 60 70 80 90 100 T em pe ra tu re ( ºC ) 0 100 200 300 400 500 600 700 800 900 1000 1100 TC 58 TC 59 TC 61 TC 62 TC 64 TC 65
Figure A-9. Temperatures measured at interface between wall cavity and OSB shear membrane layer on unexposed side of wall assembly.
Time (min) 0 10 20 30 40 50 60 70 80 90 100 T em pe ra tu re ( ºC ) 0 20 40 60 80 100 120 140 160 180 200 TC 60 TC 63
Time (min) 0 10 20 30 40 50 60 70 80 90 100 T em pe ra tu re ( ºC ) 0 100 200 300 400 500 600 700 800 900 1000 1100 TC 66 TC 67 TC 68 TC 69 TC 70 TC 71
Figure A-11. Temperatures measured at interface between OSB shear membrane layer and gypsum board base layer at ¼ height from top on unexposed side of wall assembly. 0 10 20 30 40 50 60 70 80 90 100 T em pe ra tu re ( ºC ) 0 100 200 300 400 500 600 700 800 900 1000 1100 TC 72 TC 73 TC 74 TC 75 TC 76 TC 77
Time (min) 0 10 20 30 40 50 60 70 80 90 100 T em pe ra tu re ( ºC ) 0 10 20 30 40 50 60 70 80 90 100 TC 78 TC 79 TC 80 TC 81 TC 82 TC 83
Figure A-13. Temperatures measured at interface between base and face gypsum board layers 1/4 height from top on unexposed side of wall assembly.
0 10 20 30 40 50 60 70 80 90 100 T em pe ra tu re ( ºC ) 0 10 20 30 40 50 60 70 80 90 100 TC 84 TC 85 TC 86 TC 87 TC 88 TC 89
Time (min) 0 10 20 30 40 50 60 70 80 90 100 T em pe ra tu re ( ºC ) 0 10 20 30 40 50 60 70 80 90 100 TC 1 TC 2 TC 3 TC 4 TC 5 TC 6 TC 7 TC 8 TC 9
Figure A-15. Temperatures measured on unexposed side of wall assembly.
Time (min) 0 10 20 30 40 50 60 70 80 90 100 T em pe ra tu re ( ºC ) 0 100 200 300 400 500 600 700 800 900 1000 1100 1200 S-101 Furavg
Time (min) 0 10 20 30 40 50 60 70 80 90 100 D ef le ct io n (m m ) -100 -90 -80 -70 -60 -50 -40 -30 -20 -10 0 10 DFL-01 DFL-02 DFL-03
Figure A-17. Deflections measured at ¼ height from top of wall assembly.
Time (min) 0 10 20 30 40 50 60 70 80 90 100 D ef le ct io n (m m ) -100 -90 -80 -70 -60 -50 -40 -30 -20 -10 0 10 DFL-04 DFL-05 DFL-06
Time (min) 0 10 20 30 40 50 60 70 80 90 100 D ef le ct io n (m m ) -100 -90 -80 -70 -60 -50 -40 -30 -20 -10 0 10 DFL-07 DFL-08 DFL-09
APPENDIX B - DATA FOR WALL ASSEMBLY #2
A series of plots showing the results of the measurements for Wall Assembly #2 are provided. The plots are:
1. Figures B-1 and B-2 show the temperatures measured at the interface between the face and base layers of gypsum board on the exposed side of the wall assembly at the ¼ and ¾ heights from the top of the assembly, respectively.
2. Figure B-3 and B-4 show the temperatures measured at the interface between the base layer of gypsum board and the wall cavity on the exposed side of the wall assembly at the ¼ and ¾ heights from the top of the assembly, respectively.
3. Figures B-5 and B-6 show the temperatures measured on the sides of the studs on the exposed side of the wall assembly at the ¼ and ¾ heights from the top of the assembly, respectively.
4. Figures B-7 and B-8 show the temperatures measured on the face of the studs on the unexposed and exposed side of the wall assembly, respectively.
5. Figures B-9 and B-10 show the temperatures measured at the interface between the wall cavity and the base gypsum board layer and between the stud and the base gypsum board layer, respectively.
6. Figures B-11 and B-12 show the temperatures measured at the interface between the base and face gypsum board layers on the unexposed side of the wall assembly at the ¼ and ¾ heights from the top of the assembly, respectively.
7. Figure B-15 shows the temperatures measured on the unexposed side of the wall assembly. (Note: TC-7 was damaged and did not measure realistic temperatures during the test.)
8. Figure B-16 shows the average furnace temperature measured during the test. 9. Figures B-17, B-18 and B-19 show the deflections measured at the ¼, mid- and ¾
Time (min) 0 10 20 30 40 50 60 70 80 90 100 T em pe ra tu re ( ºC ) 0 100 200 300 400 500 600 700 800 900 1000 1100 1200 TC 10 TC 11 TC 12 TC 13 TC 14 TC 15
Figure B-1. Temperatures measured at interface between face and base gypsum board layers at ¼ height from top on exposed side of wall assembly.
0 10 20 30 40 50 60 70 80 90 100 T em pe ra tu re ( ºC ) 0 100 200 300 400 500 600 700 800 900 1000 1100 1200 TC 16 TC 17 TC 18 TC 19 TC 20 TC 21
Time (min) 0 10 20 30 40 50 60 70 80 90 100 T em pe ra tu re ( ºC ) 0 100 200 300 400 500 600 700 800 900 1000 1100 TC 22 TC 23 TC 24 TC 25 TC 26 TC 27
Figure B-3. Temperatures measured at interface between base gypsum board layer and cavity at ¼ height from top on exposed side of wall assembly.
0 10 20 30 40 50 60 70 80 90 100 T em pe ra tu re ( ºC ) 0 100 200 300 400 500 600 700 800 900 1000 1100 TC 28 TC 29 TC 30 TC 31 TC 32 TC 33
Time (min) 0 10 20 30 40 50 60 70 80 90 100 T em pe ra tu re ( ºC ) 0 100 200 300 400 500 600 700 800 900 1000 1100 TC 34 TC 35 TC 36 TC 37 TC 39 TC 40
Figure B-5. Temperatures measured on sides of studs on exposed side at ¼ height from top of wall assembly.
0 10 20 30 40 50 60 70 80 90 100 T em pe ra tu re ( ºC ) 0 100 200 300 400 500 600 700 800 900 1000 1100 TC 41 TC 42 TC 43 TC 44 TC 45 TC 46
Time (min) 0 10 20 30 40 50 60 70 80 90 100 T em pe ra tu re ( ºC ) 0 100 200 300 400 500 600 700 800 900 1000 1100 TC 47 TC 48 TC 49 TC 50 TC 51 TC 52
Figure B-7. Temperatures measured on face of studs on unexposed side of wall assembly. 0 10 20 30 40 50 60 70 80 90 100 T em pe ra tu re ( ºC ) 0 100 200 300 400 500 600 700 800 900 1000 1100 TC 53 TC 54 TC 55 TC 56 TC 57 TC 58
Time (min) 0 10 20 30 40 50 60 70 80 90 100 T em pe ra tu re ( ºC ) 0 100 200 300 400 500 600 700 800 900 1000 1100 TC 60 TC 61 TC 63 TC 66 TC 68 TC 69
Figure B-9. Temperatures measured at interface between wall cavity and gypsum board base layer on unexposed side of wall assembly.
0 10 20 30 40 50 60 70 80 90 100 T em pe ra tu re ( ºC ) 0 20 40 60 80 100 120 140 160 180 200 TC 59 TC 62 TC 64 TC 65 TC 67 TC 70
Time (min) 0 10 20 30 40 50 60 70 80 90 100 T em pe ra tu re ( ºC ) 0 20 40 60 80 100 120 140 160 180 200 TC 71 TC 72 TC 73 TC 74 TC 75 TC 76
Figure B-11. Temperatures measured at interface between base and face gypsum board layers at ¼ height from top on unexposed side of wall assembly.
0 10 20 30 40 50 60 70 80 90 100 T em pe ra tu re ( ºC ) 0 20 40 60 80 100 120 140 160 180 200 TC 77 TC 78 TC 79 TC 80 TC 81 TC 82
Time (min) 0 10 20 30 40 50 60 70 80 90 100 T em pe ra tu re ( ºC ) 0 10 20 30 40 50 60 70 80 90 100 TC 1 TC 2 TC 3 TC 4 TC 5 TC 6 TC 7 TC 8 TC 9
Figure B-15. Temperatures measured on unexposed side of wall assembly.
Time (min) 0 10 20 30 40 50 60 70 80 90 100 T em pe ra tu re ( ºC ) 0 100 200 300 400 500 600 700 800 900 1000 1100 1200 S101 Furavg
Time (min) 0 10 20 30 40 50 60 70 80 90 100 D ef le ct io n (m m ) -100 -90 -80 -70 -60 -50 -40 -30 -20 -10 0 10 DFL-01 DFL-02 DFL-03
Figure B-17. Deflections measured at ¼ height from top of wall assembly.
Time (min) 0 10 20 30 40 50 60 70 80 90 100 D ef le ct io n (m m ) -100 -90 -80 -70 -60 -50 -40 -30 -20 -10 0 10 DFL-04 DFL-05 DFL-06
Time (min) 0 10 20 30 40 50 60 70 80 90 100 D ef le ct io n (m m ) -100 -90 -80 -70 -60 -50 -40 -30 -20 -10 0 10 DFL-07 DFL-08 DFL-09
APPENDIX C - DATA FOR WALL ASSEMBLY #3
A series of plots showing the results of the measurements for Wall Assembly #3 are provided. The plots are:
1. Figures C-1 and C-2 show the temperatures measured at the interface between the face and base layers of gypsum board on the exposed side of the wall assembly at the ¼ and ¾ heights from the top of the assembly, respectively.
2. Figure C-3 and C-4 show the temperatures measured at the interface between the base layer of gypsum board and the wall cavity on the exposed side of the wall assembly at the ¼ and ¾ heights from the top of the assembly, respectively.
3. Figures C-5 and C-6 show the temperatures measured on the sides of the studs on the exposed side of the wall assembly at the ¼ and ¾ heights from the top of the assembly, respectively.
4. Figures C-7 and C-8 show the temperatures measured on the face of the studs on the unexposed and exposed side of the wall assembly, respectively.
5. Figures C-9 and C-10 show the temperatures measured at the interface between the wall cavity and the base gypsum board layer and between the stud and the base gypsum board layer, respectively.
6. Figures C-11 and C-12 show the temperatures measured at the interface between the base and face gypsum board layers on the unexposed side of the wall assembly at the ¼ and ¾ heights from the top of the assembly, respectively.
7. Figure C-15 shows the temperatures measured on the unexposed side of the wall assembly.
8. Figure C-16 shows the average furnace temperature measured during the test. 9. Figures C-17, C-18 and C-19 show the deflections measured at the ¼, mid- and ¾
Time (min) 0 10 20 30 40 50 60 70 80 90 100 T em pe ra tu re ( ºC ) 0 100 200 300 400 500 600 700 800 900 1000 1100 1200 TC 10 TC 11 TC 12 TC 13 TC 14 TC 15
Figure C-1. Temperatures measured at interface between face and base gypsum board layers at ¼ height from top on exposed side of wall assembly.
0 10 20 30 40 50 60 70 80 90 100 T em pe ra tu re ( ºC ) 0 100 200 300 400 500 600 700 800 900 1000 1100 1200 TC 16 TC 17 TC 18 TC 19 TC 20 TC 21
Time (min) 0 10 20 30 40 50 60 70 80 90 100 T em pe ra tu re ( ºC ) 0 100 200 300 400 500 600 700 800 900 1000 1100 TC 22 TC 23 TC 24 TC 25 TC 26 TC 27
Figure C-3. Temperatures measured at interface between base gypsum board layer and cavity at ¼ height from top on exposed side of wall assembly.
0 10 20 30 40 50 60 70 80 90 100 T em pe ra tu re ( ºC ) 0 100 200 300 400 500 600 700 800 900 1000 1100 TC 28 TC 29 TC 30 TC 31 TC 32 TC 33
Time (min) 0 10 20 30 40 50 60 70 80 90 100 T em pe ra tu re ( ºC ) 0 100 200 300 400 500 600 700 800 900 1000 1100 TC 34 TC 35 TC 36 TC 37 TC 38 TC 39
Figure C-5. Temperatures measured on sides of studs on exposed side at ¼ height from top of wall assembly.
0 10 20 30 40 50 60 70 80 90 100 T em pe ra tu re ( ºC ) 0 100 200 300 400 500 600 700 800 900 1000 1100 TC 40 TC 41 TC 42 TC 43 TC 44 TC 45
Time (min) 0 10 20 30 40 50 60 70 80 90 100 T em pe ra tu re ( ºC ) 0 100 200 300 400 500 600 700 800 900 1000 1100 TC 46 TC 47 TC 48 TC 49
Figure C-7. Temperatures measured on face of studs on unexposed side of wall assembly. 0 10 20 30 40 50 60 70 80 90 100 T em pe ra tu re ( ºC ) 0 50 100 150 200 250 300 350 400 450 500 TC 50 TC 51 TC 52 TC 53 TC 54 TC 55 TC 56 TC 57
Time (min) 0 10 20 30 40 50 60 70 80 90 100 T em pe ra tu re ( ºC ) 0 50 100 150 200 250 300 350 400 450 500 TC 59 TC 60 TC 61 TC 62 TC 65 TC 66 TC 67 TC 68
Figure C-9. Temperatures measured at interface between wall cavity and gypsum board base layer on unexposed side of wall assembly.
0 10 20 30 40 50 60 70 80 90 100 T em pe ra tu re ( ºC ) 0 20 40 60 80 100 120 140 160 180 200 TC 58 TC 63 TC 64 TC 69
Time (min) 0 10 20 30 40 50 60 70 80 90 100 T em pe ra tu re ( ºC ) 0 20 40 60 80 100 120 140 160 180 200 TC 70 TC 71 TC 72 TC 73 TC 74 TC 75
Figure C-11. Temperatures measured at interface between base and face gypsum board layers at ¼ height from top on unexposed side of wall assembly.
0 10 20 30 40 50 60 70 80 90 100 T em pe ra tu re ( ºC ) 0 20 40 60 80 100 120 140 160 180 200 TC 76 TC 77 TC 78 TC 79 TC 80 TC 81
Time (min) 0 10 20 30 40 50 60 70 80 90 100 T em pe ra tu re ( ºC ) 0 20 40 60 80 100 120 140 160 180 200 TC 1 TC 2 TC 3 TC 4 TC 5 TC 6 TC 7 TC 8 TC 9
Figure C-15. Temperatures measured on unexposed side of wall assembly.
Time (min) 0 10 20 30 40 50 60 70 80 90 100 T em pe ra tu re ( ºC ) 0 100 200 300 400 500 600 700 800 900 1000 1100 1200 S101 Furavg
Time (min) 0 10 20 30 40 50 60 70 80 90 100 D ef le ct io n (m m ) -100 -90 -80 -70 -60 -50 -40 -30 -20 -10 0 10 DFL-01 DFL-02 DFL-03
Figure C-17. Deflections measured at ¼ height from top of wall assembly.
Time (min) 0 10 20 30 40 50 60 70 80 90 100 D ef le ct io n (m m ) -100 -90 -80 -70 -60 -50 -40 -30 -20 -10 0 10 DFL-04 DFL-05 DFL-06
Time (min) 0 10 20 30 40 50 60 70 80 90 100 D ef le ct io n (m m ) -100 -90 -80 -70 -60 -50 -40 -30 -20 -10 0 10 DFL-07 DFL-08 DFL-09