Publisher’s version / Version de l'éditeur:
Vous avez des questions? Nous pouvons vous aider. Pour communiquer directement avec un auteur, consultez la Questions? Contact the NRC Publications Archive team at
PublicationsArchive-ArchivesPublications@nrc-cnrc.gc.ca. If you wish to email the authors directly, please see the first page of the publication for their contact information.
https://publications-cnrc.canada.ca/fra/droits
L’accès à ce site Web et l’utilisation de son contenu sont assujettis aux conditions présentées dans le site LISEZ CES CONDITIONS ATTENTIVEMENT AVANT D’UTILISER CE SITE WEB.
Client Report (National Research Council of Canada. Construction), 2014-12
READ THESE TERMS AND CONDITIONS CAREFULLY BEFORE USING THIS WEBSITE. https://nrc-publications.canada.ca/eng/copyright
NRC Publications Archive Record / Notice des Archives des publications du CNRC : https://nrc-publications.canada.ca/eng/view/object/?id=bceab564-4a39-47b4-b3f8-7f732a094a07 https://publications-cnrc.canada.ca/fra/voir/objet/?id=bceab564-4a39-47b4-b3f8-7f732a094a07
NRC Publications Archive
Archives des publications du CNRC
For the publisher’s version, please access the DOI link below./ Pour consulter la version de l’éditeur, utilisez le lien DOI ci-dessous.
https://doi.org/10.4224/21274568
Access and use of this website and the material on it are subject to the Terms and Conditions set forth at
Solutions for mid-rise wood construction: cone calorimeter results for
materials used in standard exterior wall tests: report to Research
Consortium for Wood and Wood-Hybrid Mid-Rise Buildings
NATIONAL RESEARCH COUNCIL CANADA
REPORT TO RESEARCH CONSORTIUM
FOR WOOD AND WOOD-HYBRID
MID-RISE BUILDINGS
Solutions for Mid-Rise Wood Construction:
Cone Calorimeter Results for Materials
used in Standard Exterior Wall Tests
CLIENT REPORT: A1-100035-01.3
REPORT TO RESEARCH CONSORTIUM FOR WOOD AND
WOOD-HYBRID MID-RISE BUILDINGS
Solutions for Mid-Rise Wood Construction:
Cone Calorimeter Results for Materials used in Standard Exterior
Wall Tests
M. Bijloos, G.D. Lougheed, J.Z. Su and N. Bénichou
Report No.
A1-100035-01.3
Report date: December 31, 2014
Contract No. B-7000 (A1-100035)
Prepared for Canadian Wood Council
FPInnovations
Régie du bâtiment du Québec
HER MAJESTY THE QUEEN IN RIGHT OF ONTARIO as represented by
the Minister of Municipal Affairs and Housing
56 pages
This report may not be reproduced in whole or in part without the written consent of both the client and the National Research Council of Canada.
A1-100035-01.3 i
TABLE OF CONTENTS
Contents
Introduction ...1
Foam insulationS ...3
Test Method and Setup...4
Results of Cone Calorimeter Tests of Foam Insulations...7
Results of Preliminary Tests of SPF Insulations ...7
Results of Preliminary Tests of Polystyrene Rigid Foam Insulations...10
Results of Cone Calorimeter Tests of Foam Insulations used in the Full-scale Tests ...15
Results of Cone Calorimeter Tests of Water Resistant Barriers ...23
Results of Cone Calorimeter Tests of Exterior Sheathing Materials ...25
Results of Preliminary Tests of FRT Plywood ...25
Results of Cone Calorimeter Tests of Sheathing Materials with Substrates...31
Results of Tests of Gypsum Sheathing with Plywood or Foam Insulation Substrates...31
Results of Tests of FRT Plywood Sheathing with Foam Insulation Substrates ...45
Summary ...54
Acknowledgments...55
LIST OF FIGURES
Figure 1. Test specimen cross-section for cone tests with exterior sheathing materials. ...6
Figure 2. Instrumentation for cone tests of exterior sheathing materials with a substrate. ...7
Figure 3. Heat release rates for preliminary tests of SPF insulations...8
Figure 4. Specimen mass for preliminary tests of SPF insulations. ...8
Figure 5. Heat release rates for preliminary cone calorimeter tests of EPS foam insulations...12
Figure 6. Specimen mass for preliminary cone calorimeter tests of EPS foam insulations. ...12
Figure 7. Heat release rates for preliminary cone calorimeter tests of XPS foam insulations...13
Figure 8. Specimen mass for preliminary cone calorimeter tests of XPS foam insulations. ...13
Figure 9. Heat release rates of XPS foam insulation used in full-scale test. ...17
Figure 10. Specimen mass of XPS foam insulation used in full-scale test. ...17
Figure 11. Heat release rates of SPF insulation used in full-scale test. ...18
Figure 12. Specimen mass of SPF insulation used in full-scale test. ...18
Figure 13. Ignitability plot for XPS foam insulation used in full-scale test...19
Figure 14. Ignitability plot for SPF insulation used in full-scale test...19
Figure 15. Heat release rate and specimen mass of tests of weather resistant barrier materials...23
Figure 16. Heat release rates for preliminary tests of FRT plywood A. ...26
Figure 17. Specimen mass for preliminary tests of FRT plywood A...26
Figure 18. Heat release rates for preliminary tests of FRT plywood B. ...27
Figure 19. Specimen mass for preliminary tests of FRT plywood B...27
Figure 20. Ignitability plot for FRT plywood A. ...28
Figure 21. Ignitability plot for FRT plywood B. ...28
Figure 22. Temperature measurements for Test CCEX-GS-1 of gypsum sheathing with plywood. ...36
Figure 23. Heat release rate and mass for Test CCEX-GS-1 of gypsum sheathing with plywood. ...36
Figure 24. Temperature measurements for Test CCEX-GS-2 of gypsum sheathing with plywood. ...37
Figure 25. Heat release rate and mass for Test CCEX-GS-2 of gypsum sheathing with plywood. ...37
Figure 26. Temperature measurements for Test CCEX-GS-3 of gypsum sheathing with XPS foam insulation. ...38
Figure 27. Heat release rate and mass for Test CCEX-GS-3 of gypsum sheathing with XPS foam insulation. ...38
Figure 28. Temperature measurements for Test CCEX-GS-4 of gypsum sheathing with XPS foam insulation. ...39
Figure 29. Heat release rate and mass for Test CCEX-GS-4 of gypsum sheathing with XPS foam insulation. ...39
Figure 30. Temperature measurements for Test CCEX-GS-5 of gypsum sheathing with SPF insulation. ...40
Figure 31. Heat release rate and mass for Test CCEX-GS-5 of gypsum sheathing with SPF insulation. ...40
Figure 32. Temperature measurements for Test CCEX-GS-6 of gypsum sheathing with SPF insulation. ...41
Figure 33. Heat release rate and mass for Test CCEX-GS-6 of gypsum sheathing with SPF insulation. ...41
Figure 34. Temperature measurements for Test CCEX-GS-7 of gypsum sheathing with SPF insulation. ...42
A1-100035-01.3 iii
Figure 35. Heat release rate and mass for Test CCEX-GS-7 of gypsum sheathing with SPF insulation. ...42 Figure 36. Average surface temperatures for tests of gypsum sheathing over a substrate
(surface temperatures averaged for each substrate)...43 Figure 37. Average interface temperatures for tests of gypsum sheathing over a substrate
(average temperature measured by TC-01 – TC-05). ...43 Figure 38. Heat release rate for tests of gypsum sheathing over a substrate. ...44 Figure 39. Temperature measurements for Test CCEX-FRT-1 of FRT plywood sheathing with
XPS insulation. ...49 Figure 40. Heat release rate and mass for Test CCEX-FRT-1 of FRT plywood sheathing with
XPS insulation. ...49 Figure 41. Temperature measurements for Test CCEX-FRT-2 of FRT plywood sheathing with
XPS insulation. ...50 Figure 42. Heat release rate and mass for Test CCEX-FRT-2 of FRT plywood sheathing with
XPS insulation. ...50 Figure 43. Temperature measurements for Test CCEX-FRT-3 of FRT plywood sheathing with
SPF insulation. ...51 Figure 44. Heat release rate and mass for Test CCEX-FRT-3 of FRT plywood sheathing with
SPF insulation. ...51 Figure 45. Temperature measurements for Test CCEX-FRT-4 of FRT plywood sheathing with
SPF insulation. ...52 Figure 46. Heat release rate and mass for Test 4 of FRT plywood sheathing with SPF
insulation. ...52 Figure 47. Average surface temperatures for tests of FRT plywood sheathing over foam
insulation (surface temperatures averaged for each substrate)...53 Figure 48. Average interface temperatures for tests of FRT plywood sheathing over foam
insulation (average temperature measured by TC-01 – TC-05). ...53 Figure 49. Heat release rate for tests of FRT plywood sheathing over foam insulations...54
LIST OF TABLES
Table 1. Cone calorimeter results for preliminary tests of SPF insulations*. ...9
Table 2. Cone calorimeter results for preliminary tests of polystyrene rigid foam insulations*. ..14
Table 3. Cone calorimeter results for tests of polystyrene rigid foam insulation used in full-scale test assembly*. ...20
Table 4. Cone calorimeter results for tests of SPF insulation used in full-scale test assembly*. 21 Table 5. Ignition properties of XPS foam and SPF insulations used in full-scale test assembly.22 Table 6. Cone calorimeter results for preliminary tests of water resistant barriers. ...24
Table 7. Cone calorimeter results for preliminary tests of FRT plywood*...29
Table 8. Ignition properties for FRT plywoods in preliminary tests...30
Table 9. Test setup and conditions for tests of 12.7 mm thick gypsum sheathing...35
Table 10. Gypsum sheathing and substrate ignition times...35
Table 11. Test setup and conditions for tests of 15.9 mm thick FRT plywood sheathing. ...48
A1-100035-01.3 1
SOLUTIONS FOR MID-RISE WOOD CONSTRUCTION:
CONE CALORIMETER RESULTS FOR MATERIALS USED IN STANDARD EXTERIOR WALL TESTS
M. Bijloos, G.D. Lougheed, J.Z. Su and N. Bénichou
INTRODUCTION
The acceptable solutions provided in the 2010 National Building Code (NBC) Division B [1] limits the use of combustible (wood) construction based on building height. For example, for Group C (Residential), Group D (Business and Personal Services) and Group E (Mercantile) occupancies, combustible construction can be used up to 4 storeys, and up to 2 storeys for Group A – Division 2 (Assembly) occupancies. In addition to the building height limitation, there are also building area limitations in the 2010 NBC for the use of combustible construction for these occupancies. For buildings that exceed the height and area requirements for combustible construction, the prescriptive requirements in the 2010 NBC require that noncombustible construction be used for the primary structural elements.
The prescriptive construction requirements for fire safety and protection of buildings, which are dependent upon the building size and occupancy type, are provided in Subsection 3.2.2 of the 2010 NBC. This includes the identification of the buildings for which noncombustible
construction is required. The intent of the prescriptive requirements for noncombustible
construction as they relate to the NBC fire safety/fire protection of building objectives is “to limit
the probability that combustible construction materials within a storey of a building will be involved in a fire, which could lead to the growth of fire, which could lead to the spread of fire within the storey during the time required to achieve occupant safety and for emergency responders to perform their duties, which could lead to harm to persons/damage to the building”.
The 2010 NBC defines noncombustible construction as “that type of construction in which a
degree of fire safety is attained by use of noncombustible construction materials for structural members and other building assemblies” [1]. Article 3.1.5.1 requires that a building or part of a
building required to be of noncombustible construction be constructed using noncombustible materials. The intent of this requirement, as it relates to the NBC fire safety/fire protection of building objectives, is “to limit the probability that construction materials will contribute to the
growth and spread of fire, which would lead to harm to persons/damage to the building”.
The NBC does permit, as exceptions, an extensive use of combustible materials in buildings otherwise required to have their primary structural elements to be of noncombustible
construction. The allowed materials and associated limitations are primarily provided in Articles 3.1.5.2 to 3.1.5.21. Generally, the combustible elements permitted relate to interior finishes, gypsum board, combustible roofing materials, combustible plumbing fixtures, cabling, protected insulation, flooring, combustible glazing, combustible cladding systems, non-loadbearing framing elements in partitions, stairs in dwellings, and trim and millwork, among others. Divisions B of the NBC (the “acceptable solutions” portion of the Code) generally does not permit combustible materials to be used for the primary structural elements in buildings required to be of noncombustible construction. In the Scoping Study [2] for mid-rise and hybrid buildings, it was suggested that an alternative solution using wood construction may be developed to meet
the intent of the prescriptive “noncombustibility” requirement for mid-rise (and taller) buildings. As one approach, encapsulation materials could be used to protect the combustible (wood) structural materials for a period of time in order to delay the effects of the fire on the combustible structural elements, including delay of ignition. In delaying ignition, any effects of the
combustion of the combustible structural elements on the fire severity can be delayed. In some cases, and depending upon the amount of encapsulating material used (e.g. number of layers), ignition of the elements might be avoided completely. This scenario would primarily depend upon the fire event and the actual fire performance of the encapsulating materials used. A research project, Wood and Wood-Hybrid Midrise Buildings, was undertaken to develop
information to be used as the basis for alternative/acceptable solutions for mid-rise construction using wood structural elements.
In Article 3.1.5.5, the NBC allows the use of combustible components for non-loadbearing exterior walls to be used in a building required to be of noncombustible construction provided:
a) the building is
i. not more than 3 storeys in height, or ii. sprinklered throughout,
b) the interior surfaces of the wall assembly are protected by a thermal barrier conforming to Sentence 3.1.5.12.(3), and
c) the wall assembly satisfies the criteria of Sentence 3.1.5.5.(3) and 3.1.5.5.(4) when subjected to testing in conformance with CAN/ULC-S134 Fire Test of Exterior Wall
Assemblies [3].
Since the introduction of the requirements for the use of combustible components for non-loadbearing exterior walls in noncombustible construction, a number of proprietary cladding systems have been developed that meet the requirements in the NBC when tested using CAN/ULC-S134. However, one assumption in this testing is that the non-loadbearing exterior wall assemblies will be used in conjunction with an exterior wall system constructed using noncombustible structural elements either as infill or panel type walls between structural
elements or attached directly to a loadbearing noncombustible structural system (see Appendix Note A-3.1.5.5.(1) of the 2010 NBC).
During the development of the CAN/ULC-S134 test method, three assemblies using lightweight wood frame construction met the criteria in the 2010 NBC for non-loadbearing exterior walls [4, 5]:
1. Assembly 3.1. - Vinyl siding on gypsum sheathing on glass-fibre-insulated untreated (non-fire-retardant-treated) wood frame wall;
2. Assembly 3.3. - 12.7 mm fire-retardant-treated plywood on untreated (non-fire-retardant-treated) wood studs, with phenolic foam insulation in cavities; and
3. Assembly 3.4. - Aluminum sheet (0.75 mm) on fire-retardant-treated wood studs, with phenolic foam insulation in cavities.
The results of the original three tests can currently provide the basis for developing generic alternative solutions for exterior wall assemblies for use in mid-rise buildings using lightweight wood frame construction. However, generic alternative solutions based on these tests would be limited by the materials tested, including the insulation types used in the original tests.
One of the tasks in the project, Wood and Wood-Hybrid Midrise Buildings, was to develop further information and data for use in developing generic exterior wall systems for use in
mid-A1-100035-01.3 3
rise buildings using either lightweight wood frame or cross-laminated timber as the structural elements. As a result, full-scale standard exterior wall assembly tests were conducted to CAN/ULC-S134, using the following test assemblies:
1. Test EXTW-1: 12.7 mm thick gypsum sheathing on a lightweight wood frame assembly with untreated (non-FRT) wood studs (38 mm x 140 mm) spaced at 400 mm OC with the cavity insulated using spray-applied polyurethane foam (SPF) insulation.
2. Test EXTW-2: 12.7 mm thick gypsum sheathing on a lightweight wood frame assembly with untreated (non-FRT) wood studs (38 mm x 140 mm) spaced at 600 mm OC with the cavity insulated using solid polystyrene panels on a simulated CLT wall covered with a water resistant barrier.
3. Test EXTW-3: 15.9 mm thick FRT plywood on a lightweight wood frame assembly with untreated (non-FRT) wood studs (38 mm x 140 mm) spaced at 600 mm OC with the cavity insulated using solid polystyrene panels on a simulated CLT wall covered with a water resistant barrier.
4. Test EXTW-4: 15.9 mm thick FRT plywood on a lightweight wood frame assembly with untreated (non-FRT) wood studs (38 mm x 140 mm) spaced at 400 mm OC with the cavity insulated using SPF insulation.
The foam insulations examined for use in the full-scale test assemblies were typical of those used in present-day construction. The results of the four full-scale standard tests are provided in separate reports [6, 7, 8, 9]. In addition, a non-standard test (Test EXTW-5) was conducted using a reduced scale rain screen wall system [10].
In addition to the full-scale tests, cone calorimeter tests were conducted to select and
characterize the foam insulation, water resistant barrier and FRT plywood materials, as well as the regular gypsum sheathing, used in the full-scale tests. Tests were also conducted with the foam insulations protected using the sheathing materials used in the full-scale tests. The results of the cone calorimeter tests are provided in this report.
FOAM INSULATIONS
There are two main types of foam insulations used in the Canadian construction market:
1. Spray-applied polyurethane foam (SPF) insulation. Spray-applied polyurethane foam insulation is widely used as insulation for exterior walls in lightweight wood-frame
construction. The SPF insulation is applied to the exterior wall onsite after the exterior wall is constructed, including the installation of the exterior sheathing but before interior sheathing is installed. The SPF insulation is sprayed into the cavity spaces formed by the structural elements and it adheres to the back of the exterior sheathing.
There are two main types of SPF used as insulation:
a. Light density SPF insulation. Light density SPF insulation is an open-cell foam with a minimum density of 6.8 kg/m3and a maximum density of 12 kg/m3[11].
The 2010 NBC requires a maximum allowable flame spread rating of 500 [1]. When applied, light density SPF insulation will overfill the cavity space and is trimmed before the interior sheathing is installed.
b. Medium density SPF insulation. Medium density SPF insulation is a closed-cell foam with a minimum density of 28 kg/m3[12]. The 2010 NBC requires a
maximum allowable flame spread rating of 500 [1]. When installed, the depth of the medium density SPF insulation in the cavity space can be controlled to meet thermal performance requirements. As a result, there is often an air gap between the medium density SPF insulation and the interior sheathing.
2. Polystyrene rigid foam insulation. Polystyrene rigid foam insulation is available as
panels in various sizes and thicknesses. It is used as an exterior insulation sheathing on steel or wood stud wall frames, with the insulation applied directly to studs or overtop of an exterior sheathing substrate such as OSB or gypsum sheathing. It is also used on the exterior/interior face of masonry walls, cast-in-place concrete walls and pre-cast concrete walls. There are two main types of polystyrene rigid foam insulation:
a. Expanded polystyrene (EPS) rigid foam insulation. Expanded polystyrene
rigid foam insulation is a factory-made product made by molding of expandable polystyrene beads.
b. Extruded polystyrene (XPS) rigid foam insulation. Extruded polystyrene rigid
foam insulation is a factory-made product made by extruding polystyrene along with additives and a blowing agent under high temperature and pressure conditions to form a uniform closed-cell-structure foam.
Polystyrene rigid foam insulation is evaluated using Reference 13. The 2010 NBC requires a maximum allowable flame spread rating of 500 [1].
TEST METHOD AND SETUP
Preliminary cone calorimeter tests were conducted using typical foam insulation materials. These tests were conducted in general conformance with ISO 5660 [14], including the specimen holder and the measurements specified in the test standard. The specimens were 100 mm x 100 mm and were exposed to a 50 kW/m2heat flux. The test standard allows test specimens of
up to 50 mm thickness to be tested. The thickness of the specimens varied depending on the material. The thicknesses of the specimens are provided in the tables that summarizes the results for each material.
The objective of these tests was to provide data for use in selecting foam insulations for use in full-scale tests using the CAN/ULC-S134 test method. The foam insulations used for these tests included:
1. SPF Insulation. Samples of light and medium density spray-applied polyurethane foam insulations used in the Canadian market were obtained and used for preliminary cone calorimeter tests.
2. Polystyrene Rigid Foam Insulation. Samples of EPS and XPS foam insulations were purchased from local suppliers and used for preliminary cone calorimeter tests.
Additional cone calorimeter tests were conducted for the two foam insulations (one SPF
insulation and one polystyrene rigid foam insulation) used in the full-scale tests. The objective of these tests was to provide data for use in determining the ignition temperature of the foam insulations.
A1-100035-01.3 5
Preliminary cone calorimeter tests were conducted using typical water resistant barrier (WRB) materials. Two types of WRBs are typically used in present day construction to prevent ingress of moisture in exterior wall assemblies of wood construction:
1. Paper impregnated with asphalt. This is a paper product made from recycled cellulose products such as cardboard and sawdust. The paper is saturated with asphalt.
2. Thermoplastic polyolefin (TPO). TPO is a thin plastic membrane, which has been in use since 2003. This product is considered more durable and less prone to puncture and tear, and is lighter and stronger than the paper based products.
There are also breathable WRBs, which allow water vapour to pass through the WRB to minimize condensation. This type of product was not part of the testing.
A sample of each type of WRB was obtained locally for cone calorimeter tests. The two products are identified as WRB-1 (paper impregnated with asphalt) and WRB-2 (TPO). The cone calorimeter tests were conducted in general conformance with ISO 5660 [14], including the specimen holder and the measurements specified in the test standard. The specimens were 100 mm x 100 mm and were exposed to a 50 kW/m2heat flux. The test standard allows test
specimens of up to 50 mm thickness to be tested. WRB-1 and WRB-2 were 0.030 and 0.06 mm thick, respectively. The objective of these tests was data for use in selecting a WRB for use in full-scale tests using the CAN/ULC-S134 test method.
Cone calorimeter tests were also conducted using the exterior sheathing materials used in the full-scale tests. These tests included:
1. Preliminary tests of two FRT plywood samples obtained from Canadian suppliers were conducted. These tests were conducted in general conformance with ISO 5660 [14], including the specimen holder and the measurements specified in the test standard. The specimens were 100 mm x 100 mm and were exposed to a 50 kW/m2heat flux. .The
test standard allows test specimens of up to 50 mm thickness to be tested. The nominal thickness of FRT-A and FRT-B were 15.9 and 12.7 mm, respectively. The objective of these tests was to provide data for use in selecting a FRT plywood for use in full-scale tests using the CAN/ULC-S134 test method.
2. Tests were conducted with the 12.7 mm thick gypsum sheathing used for the full-scale tests. The material was combustible and had a surface flame-spread rating of 20, and a smoke developed classification of 0. Separate tests were conducted using 15.9 mm thick non-FRT plywood and the two types of foam insulation used in the full-scale tests as the substrate (see Figure 1). The foam insulation was 37 mm thick. The gypsum sheathing/substrate specimens were mounted in the specimen holder on ceramic fibre insulation. Two tests each were conducted with the plywood substrate and with both types of foam insulation substrate.
3. Additional tests were also conducted with the FRT plywood (FRT-A) used for the full-scale tests, with the foam insulations used for the full-full-scale tests as the substrate. The foam insulation was 37 mm thick. The FRT plywood/foam insulation specimens were mounted in the specimen holder on ceramic fibre insulation. The setup of the test specimens is shown in Figure 1. Two tests were conducted for both types of foam insulation substrate.
The tests with the exterior sheathing were conducted in general conformance with ISO 5660 [14]. However, the large holder specified in CAN/ULC-S135 was used [15]. Ceramic fibre insulation was inserted between the specimen and the walls of the holder to minimize heat
transfer at the sides of the specimen. The specimens were 100 mm x 100 mm and were exposed to a 50 kW/m2heat flux.
Figure 1. Test specimen cross-section for cone tests with exterior sheathing materials.
For the exterior sheathing tests that had either a plywood or foam insulation substrate, five thermocouples were located at the interface between the exterior sheathing material and the substrate (Figure 2). Thermocouples TC 1, TC 2, TC 3 and TC 4 were located at the specimen quarter-points (approximately 25 mm from two sides of the specimen, at the center of each quadrant of the specimen). TC 5 was located at the centre of the specimen.
As well, for the exterior sheathing tests that had either a plywood or foam insulation substrate, a pyrometer and a thermocouple (TC 6) were used to measure the temperature at the centre of the exposed surface of the specimen. (The pyrometer and TC 6 were offset 10 mm from the centre of the specimen respectively; this was done to avoid interference from TC 6 in the field of view of the pyrometer). For the tests with foam insulation used as the substrate, a thermocouple (TC 7) was inserted into the center of the foam insulation. This thermocouple was located approximately 6 mm above the base of the insulation.
Exterior Sheathing
Substrate
Ceramic Fibre Insulation
Pyrometer/TC-06
TC-01 TC-03
TC-02 TC-04
TC-05
Sample Holder Handle
A1-100035-01.3 7
Figure 2. Instrumentation for cone tests of exterior sheathing materials with a substrate. RESULTS OF CONE CALORIMETER TESTS OF FOAM INSULATIONS
Results of Preliminary Tests of SPF Insulations
Preliminary cone calorimeter tests were conducted using one light density SPF insulation
(SPF-A) and two medium density SPF insulation samples (SPF-B and SPF-C). Samples SPF-A and SPF-B were limited in size and only a single 100 mm x 100 mm specimen could be
prepared. Sample SPF-C was larger and 3 test specimens (100 mm x 100 mm) were prepared and tested using this sample.
The results of the tests with the SPF test specimens are summarized in Table 1. Plots showing the heat release rate and change in specimen mass for the tests are provided in Figure 3 and Figure 4, respectively.
All the tests were conducted using a 50 kW/m2exposure, with all the specimens igniting within
2 s. Specimens CCEX-SPF-A, CCEX-SPF-B and CCEX-SPF-C-3 had similar shapes of heat release rate and change in mass profiles, with a rapid increase in heat release rate followed by a rapid decay as the most of the mass was lost within 47 s with the light density foam specimen and within 164 s for two of the medium density foam specimens. The other two medium density foam specimens had lower peak heat release rates and longer decay times, with flameout occurring at 441 s for specimen CCEX-SPF-C-2 (Table 1 and Figure 3).
The higher total heat release for the medium density SPF insulations compared with the light density foam insulation is consistent with the difference in initial mass for the specimens. The average fuel load (MJ/kg) for Specimens CCEX-SPF-C-1, CCEX-SPF-C-2 and CCEX-SPF-C-3 was 12.1 MJ/kg. This is comparable to the 11.6 and 11.9 MJ/kg produced by the light density foam (Specimen CCEX-SPF-A) and the medium density foam (Specimen CCEX-SPF-B), respectively (Table 1).
The results of the preliminary tests of the SPF insulation specimens indicate that there may be some test-to-test variation in the test dynamics, including the heat release rate and mass loss. However, the total heat release and total fuel load produced by the SPF insulation is primarily dependent on the initial mass of the specimen. A medium density SPF is at a minimum 2.3 times denser than the light density foam, and based on total heat output and total fuel load, may present more of a hazard. Based on these results, medium density SPF insulation was used in the full-scale standard exterior wall assembly tests.
Figure 3. Heat release rates for preliminary tests of SPF insulations.
Figure 4. Specimen mass for preliminary tests of SPF insulations.
Time (s) 0 50 100 150 200 250 300 350 400 450 500 H ea t R e le as e R at e ( kW /m 2 ) 0 50 100 150 200 250 300 CCEX-SPF-A CCEX-SPF-B CCEX-SPF-C-1 CCEX-SPF-C-2 CCEX-SPF-C-3 Time (s) 0 50 100 150 200 250 300 350 400 450 500 M a ss ( g) 0 2 4 6 8 10 12 14 16 18 20 CCEX-SPF-A CCEX-SPF-B CCEX-SPF-C-1 CCEX-SPF-C-2 CCEX-SPF-C-3
A1-100035-01.3 9
Table 1. Cone calorimeter results for preliminary tests of SPF insulations*.
Specimen Heat Flux Thickness Mass Lost/ Ignition/ HRR Total Total Smoke EHC Fuel
Initial Mass Flameout Mean/Peak HR Release Mean/Peak Load
(kW/m2) (mm) (g) (s) (kW/m2) (MJ/m2) (m2/m2) (MJ/kg) (MJ/kg) CCEX-SPF-A 50 42.0 4.4/5.6 1/47 159.3/228.5 7.3 439.2 14.6/22.3 11.6 (light density) CCEX-SPF-B 50 42.0 11.9/14.9 0/123 162.7/287.7 20.0 1461.3 14.8/25.0 11.9 (medium density) CCEX-SPF-C-1- 50 36.3 10.7/15.3 2/367 58.1/117.2 21.2 568.9 17.6/27.8 12.3 (medium density) CCEX-SPF-C-2- 50 37.0 11.2/16.0 2/441 57.4/100.1 25.2 538.6 20.0/27.9 13.9 (medium density) CCEX-SPF-C-3- 50 37.5 12.2/16.6 2/164 116.7/197.2 18.9 1258.2 13.7/33.0 10.1 (medium density)
HRR – Heat release rate HR – Heat release EHC – Effective heat of combustion
Results of Preliminary Tests of Polystyrene Rigid Foam Insulations
Preliminary cone calorimeter tests were conducted using expanded (EPS) and extruded (XPS) polystyrene rigid foam insulation samples. The insulation samples were selected from the products available locally that were produced by the major manufacturers of polystyrene foam insulations.
A single cone calorimeter test was conducted with a 50 kW/m2radiant exposure on a specimen
taken from each insulation sample. The results of these tests are summarized in Table 2. Plots showing the heat release rate and the change in specimen mass for tests of 5 EPS specimens (CCEX-EPS-A, CCEX-EPS-B, CCEX-EPS-C, CCEX-EPS-D and CCEX-EPS-E) are shown in Figure 5 and Figure 6, respectively. The heat release rate and specimen mass results for tests of 3 XPS foam insulation specimens (CCEX-XPS-F, CCEX-XPS-G and CCEX-XPS-H) are provided in Figure 7 and Figure 8, respectively.
The initial mass of the EPS specimens varied from sample to sample with Specimen CCEX-EPS-A having the lowest initial mass (4.2 g). Specimens CCEX-EPS-B and CCEX-EPS-D had the highest initial mass (8.1 g). The specimens from the other two samples had initial masses of approximately 6 g.
The ignition times for the 5 EPS specimens were comparable (34 – 41 s). Subsequent to ignition, there was a rapid increase to an initial peak heat release rate followed by a short duration of heat output until most of the mass was lost (Figure 7 and Figure 8).
With the variation in the initial specimen mass, there was some variation in the total heat release produced by the five specimens, with the lowest total heat release for Specimen CCEX-EPS-A (13.8 MJ/m2) and the highest for Specimen CCEX-EPS-B (27.1 MJ/m2). However, the
fuel load (MJ/kg) was comparable for the 5 specimens (Table 2).
The specimens from the 3 XPS foam insulation samples had comparable masses, with a minimum initial mass of 9 g and a maximum initial mass of 10.8 g. All three specimens were heavier than the specimens from the EPS samples.
Specimen CCEX-XPS-F ignited at approximately 2 s. This is much earlier than for the five tests with EPS specimens and the other two XPS foam insulation specimens. Specimens CCEX-XPS-G and CCEX-XPS-H had ignition times slightly longer than but comparable to the ignition times for the EPS specimens.
The heat release rate results for Specimen CCEX-XPS-F also differed from the results for the other two XPS foam insulation specimens. With all three specimens, there was an initial rapid increase to the peak heat release rate. For Specimen CCEX-XPS-F, the peak heat release rate was followed by a rapid decrease in heat output, followed by a steady burning stage prior to the final decay in the heat release rate. The heat release rate plots for the other two specimens indicate a slower decrease in heat output prior to the final decay in heat release rate due to mass loss (Figure 7 and Figure 8).
With the higher initial masses, the XPS foam insulation specimens had higher total heat release values than the EPS specimens. The fuel load for the XPS foam insulation specimens was lower than but comparable to that for the EPS specimens.
A1-100035-01.3 11
Based on the results of the preliminary cone calorimeter tests with polystyrene rigid foam insulations, it was decided to use XPS foam insulation for the full-scale standard exterior wall assembly testing as it produced more heat output than the EPS foam insulation specimens. Specimen CCEX-XPS-G was used in the full-scale tests as it had an ignition time consistent to that for all but one polystyrene rigid foam insulation product. It also had the highest total heat release.
Figure 5. Heat release rates for preliminary cone calorimeter tests of EPS foam insulations.
Figure 6. Specimen mass for preliminary cone calorimeter tests of EPS foam insulations.
Time (s) 0 100 200 300 400 H ea t R el e as e R a te ( kW /m 2 ) 0 50 100 150 200 250 300 350 CCEX-EPS-A CCEX-EPS-B CCEX-EPS-C CCEX-EPS-D CCEX-EPS-E Time (s) 0 100 200 300 400 M as s (g ) 0 2 4 6 8 10 12 CCEX-EPS-A CCEX-EPS-B CCEX-EPS-C CCEX-EPS-D CCEX-EPS-E
A1-100035-01.3 13
Figure 7. Heat release rates for preliminary cone calorimeter tests of XPS foam insulations.
Figure 8. Specimen mass for preliminary cone calorimeter tests of XPS foam insulations.
Time (s) 0 100 200 300 400 H ea t R el e as e R a te ( kW /m 2 ) 0 50 100 150 200 250 300 350 CCEX-XPS-F CCEX-XPS-G CCEX-XPS-H Time (s) 0 100 200 300 400 M as s (g ) 0 2 4 6 8 10 12 CCEX-XPS-F CCEX-XPS-G CCEX-XPS-H
Table 2. Cone calorimeter results for preliminary tests of polystyrene rigid foam insulations*.
Specimen Heat Flux Thickness Mass Lost/ Ignition/ HRR Total Total Smoke EHC Fuel
Initial Mass Flameout Mean/Peak HR Release Mean/Peak Load
(kW/m2) (mm) (g) (s) (kW/m2) (MJ/m2) (m2/m2) (MJ/kg) (MJ/kg) CCEX-EPS-A 50 35.0 3.8/4.2 41/217 78.3/215.2 13.8 496.7 37.2/36.0 29.4 CCEX-EPS-B 50 39.0 7.7/8.1 35/265 117.6/294.6 27.1 1033.8 31.1/36.6 29.5 CCEX-EPS-C 50 36.5 5.3/5.4 33/212 93.1/295.0 16.7 651.9 28.0/43.1 27.4 CCEX-EPS-D 50 38.5 7.9/8.1 35/229 133.2/167.7 25.9 1119.5 28.9/38.1 28.2 CCEX-EPS-E 50 36.0 5.6/6.1 34/304 74.9/291.3 20.3 672.9 31.7/29.01 29.3 CCEX-XPS-F 50 38.5 8.8/9.0 2/265 111.6/335.9 29.4 1119.4 29.6/42.2 28.8 CCEX-XPS-G 50 37.5 9.2/10.8 39/272 139.8/321.2 32.6 1450.7 31.3/38.4 26.8 CCEX-XPS-H 50 39.0 9.6/10.7 44/244 166.6/323.1 30.0 1340.4 27.7/45.9 24.8
HRR – Heat release rate HR – Heat release EHC – Effective heat of combustion
A1-100035-01.3 15
Results of Cone Calorimeter Tests of Foam Insulations used in the Full-scale Tests
Additional cone calorimeter tests were conducted to characterize the foam insulations used in the full-scale standard exterior wall assembly tests conducted in accordance with CAN/ULC-S134 [3]. Tests were conducted at various heat fluxes between 15 and 50 kW/m2.
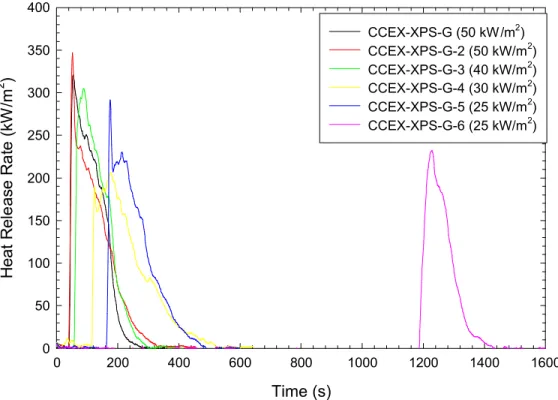
Seven additional tests were conducted with the XPS foam insulation (Sample G). The results for these tests (Specimens CCEX-XPS-G-2 to CCEX-XPS-G-8) are summarized in Table 3 along with the results of the preliminary test on the same material (Specimen CCEX-XPS-G in Table 2 and Specimen CCEX-XPS-G-1 in Table 3). The specimens exposed to a radiant heat flux of 25 kW/m2and higher all ignited. However, one test with a heat flux of 25 kW/m2ignited at
1182 s compared with 160 s for the other test with this exposure. The specimens tested with exposures < 25 kW/m2did not ignite.
The heat release rate and change in specimen mass for the tests in which the XPS foam insulation specimen ignited are shown in Figure 9 and Figure 10, respectively. The results for the tests with early ignition of the test specimen (<200 s) are consistent. Once ignited, there was a rapid increase in heat release rate and decrease in specimen mass. The total heat release and fuel load results were also comparable. For Specimen CCEX-XPS-G-6 with the extended time to ignition, a lower total heat release rate and fuel load was determined. This is most likely due to the amount of mass loss without burning with the extended exposure to the radiant flux prior to ignition (Figure 10).
Eighteen tests were conducted with the SPF insulation. The results for these tests are summarized in Table 4. The specimens exposed to a radiant flux of 21 kW/m2and higher all
ignited within 8 s. For tests at 17 kW/m2and lower, the specimens were not ignited. For tests
with exposures of 18 and 20 kW/m2, one specimen at an exposure of 18 kW/m2ignited at 24 s
but the other three specimens did not ignite.
The heat release rate and specimen mass for the tests in which the SPF insulation specimen ignited are shown in Figure 11 and Figure 12, respectively. The heat release rate and the mass loss results were dependent on the radiant exposure. With higher exposures (≥25 kW/m2), there
was a rapid increase in heat release rate after ignition, followed by a period with steady heat output until the final decay in heat output.
For the tests with lower exposures (<25 kW/m2), there was an initial rapid increase in heat
release rate to an initial peak. Subsequently, there was a decrease in heat output followed by a period with reduced heat output. In some cases, there was a second peak heat output prior to flameout. There was also lower mass lost for the tests with lower heat flux exposures (Figure 12). As a result, there was a lower total heat release rate for these tests. There was also a decrease in the measured fuel load indicating that some of the pyrolysis gases may not have burned.
The ignition temperature and thermal properties for a material can be estimated using time to ignition data from cone calorimeter tests conducted using a range of heat exposures. The procedure developed by Janssens for thermally thick solids is outlined by Barauskas [16]. For this process, tig-0.55is plotted as a function of the heat flux, where tigis the time to ignition. The
results for the tests with the XPS foam insulation and the SPF insulations are shown in Figure 13 and Figure 14, respectively.
Straight line fits are shown for each set of data. The point at which this line intercepts the x-axis is used to determine the critical heat flux (qcr). In addition, a minimum heat flux (qmin) is
determined as halfway between the lowest flux at which ignition occurred and the highest flux without ignition. Estimates for qcrand qminfor the XPS foam insulation and SPF insulation are
provided in Table 5.
The values determined for qcrand qmin can be used in the following relationship to estimate the
ignition temperature, Tig, for the test specimen:
( )
= +
Equation 1where,
hc= convection coefficient, kWm-2K-1(value of 0.013 kWm-2K-1 commonly used for cone
calorimeter applications [16]).
s= absorptivity (value of 0.88 commonly used for a wide range of plastic cellulosic
materials [16]).
To= ambient temperature, K (value of 295 K used in calculations).
Ignition temperatures determined for the XPS foam insulation and SPF insulation using this relationship, assuming standard initial ambient conditions, are provided in Table 5.
The XPS foam insulation sample provided a good series of ignition times over a range of heat fluxes as indicated by the ignitability plot for this material (Figure 13). However, it should be noted that the specimens collapsed to the bottom of the holder prior to ignition. This increased the distance from the cone heater to the surface by approximately 37 mm and would reduce the heat flux at the material surface at ignition.
The ignition temperatures based on qcrand qminprovided in Table 5 for this material are
estimates for minimum and maximum values, respectively. However, for solid materials, ignition temperatures are should be > 300C, and therefore the estimated minimum value is too low. There are no values provided in the literature for XPS foam insulations. However, Reference 16 does give an ignition temperature for EPS foam insulations of 376C. As such, the estimate using qminis reasonable but likely on the high side. More extensive testing would be required to
get a more accurate estimate for the XPS foam insulation. However, the cone calorimeter results provided in this section provide a sufficient characterization of the XPS foam insulation used in the full-scale tests.
At low exposures (≤20 kW/m2), the SPF insulation may rapidly form a char layer. If this layer
formed prior to ignition, the specimen would not ignite even with extended exposures. For higher exposures (> 20 kW/m2, the ignition times were relatively short (<10 s) As a result, the
values in the ignitability plot (Figure 14) are scattered. As with the XPS foam insulation sample, the ignition temperature determined using qcris too low (Table 5). However, the result using qmin
is reasonable and is comparable to the literature value of 370C [16]. The cone calorimeter results provided in this section provide a good characterization of the SPF insulation used in the full-scale tests.
A1-100035-01.3 17
Figure 9. Heat release rates of XPS foam insulation used in full-scale test.
Figure 10. Specimen mass of XPS foam insulation used in full-scale test.
Time (s) 0 200 400 600 800 1000 1200 1400 1600 H ea t R el e as e R a te ( kW /m 2 ) 0 50 100 150 200 250 300 350 400 CCEX-XPS-G (50 kW/m2) CCEX-XPS-G-2 (50 kW/m2) CCEX-XPS-G-3 (40 kW/m2) CCEX-XPS-G-4 (30 kW/m2) CCEX-XPS-G-5 (25 kW/m2) CCEX-XPS-G-6 (25 kW/m2) Time (s) 0 200 400 600 800 1000 1200 1400 1600 M as s (g ) 0 2 4 6 8 10 12 CCEX-XPS-G (50 kW/m2) CCEX-XPS-G-2 (50 kW/m2) CCEX-XPS-G-3 (40 kW/m2) CCEX-XPS-G-4 (30 kW/m2) CCEX-XPS-G-5 (25 kW/m2) CCEX-XPS-G-6 (25 kW/m2)
Figure 11. Heat release rates of SPF insulation used in full-scale test.
Figure 12. Specimen mass of SPF insulation used in full-scale test.
Time (s) 0 50 100 150 200 250 300 H e at R e le as e R a te ( kW /m 2 ) 0 50 100 150 200 250 50 kW/m2 40 kW/m2 25 kW/m2 23 kW/m2 21 kW/m2 20 kW/m2 18 kW/m2 Time (s) 0 50 100 150 200 250 300 M as s (g ) 0 2 4 6 8 10 12 14 16 18 20 50 kW/m2 40 kW/m2 25 kW/m2 23 kW/m2 21kW/m2 20 kW/m2 18 kW/m2
A1-100035-01.3 19
Figure 13. Ignitability plot for XPS foam insulation used in full-scale test.
Figure 14. Ignitability plot for SPF insulation used in full-scale test.
Heat Flux (kW/m2) 0 10 20 30 40 50 (1 /tig ) 0 .5 5 0.00 0.02 0.04 0.06 0.08 0.10 0.12 0.14 0.16 (1/tig)0.55 Linear Regression Heat Flux (kW/m2) 0 10 20 30 40 50 (1 /tig ) 0 .5 5 0.0 0.2 0.4 0.6 0.8 1.0 1.2 (1/tig)0.55 Linear Regression
Table 3. Cone calorimeter results for tests of polystyrene rigid foam insulation used in full-scale test assembly*.
Specimen Heat Flux Thickness Mass Lost/ Ignition/ HRR Total Total Smoke EHC Fuel
Initial Mass Flameout Mean/Peak HR Release Mean/Peak Load
(kW/m2) (mm) (g) (s) (kW/m2) (MJ/m2) (m2/m2) (MJ/kg) (MJ/kg) CCEX-XPS-G 50 37 9.2/10.8 39/272 139.8/321.2 32.6 1450.7 31.3/38.4 26.8 CCEX-XPS-G-2 50 36 9.5/10.4 37/326 113.6/347.1 32.9 1367.7 30.5/38.2 27.9 CCEX-XPS-G-3 40 37 9.9/10.8 55/268 140.8/304.8 32.8 1325.8 29.3/35.2 26.7 CCEX-XPS-G-4 30 37 9.4/10.5 112/495 88.8/206.6 34.0 983.5 32.0/27.8 28.8 CCEX-XPS-G-5 25 37 9.2/10.9 160/464 107.2/291.4 32.6 1076.7 31.2/31.9 26.3 CCEX-XPS-G-6 25 36 6.0/10.7 1182/1418 92.3/232.5 21.8 713.0 32.1/28.5 18.0
CCEX-XPS-G-7 23 36 1.5/10.5 NI/1800 NA/NA NA NA NA NA
CCEX-XPS-G-1 20 36 0.2/10.6 NI/1800 NA/NA NA NA NA NA
CCEX-XPS-G-8 15 37 NA/10.7 NI/1920 NA/NA NA NA NA NA
HRR – Heat release rate HR – Heat release EHC – Effective heat of combustion NI – No ignition NA – Not Available *Measured values are for time period with flaming combustion between the specimen ignition and flameout.
A1-100035-01.3 21
Table 4. Cone calorimeter results for tests of SPF insulation used in full-scale test assembly*.
Specimen Heat
Flux Thickness Mass Lost/ Ignition/ HRR Total Total Smoke EHC Fuel
Initial Mass Flameout# Mean/Peak HR Release Mean/Peak Load
(kW/m2) (mm) (g) (s) (kW/m2) (MJ/m2) (m2/m2) (MJ/kg) (MJ/kg) CCEX-SPF-D-1- 50 36 10.2/13.3 1/150 108.9/211.7 16.2 940.5 14.0/23.0 10.8 CCEX-SPF-D-1 40 37 9.9/14.7 1/209 81.4/177.7 16.9 780.2 15.1/23.5 10.2 CCEX-SPF-D-3 25 37 7.9/14.0 6/129 102.6/153.4 12.6 588.2 14.1/22.7 8.0 CCEX-SPF-D-4 25 36 8.4/14.1 3/131 106.2/153.7 13.6 617.4 14.2/31.8 8.5 CCEX-SPF-D-5 25 35 7.7/13.4 4/141 85.3/141.3 11.7 491.3 13.3/22.3 7.7 CCEX-SPF-D-6 25 35 7.6/13.3 4/162 76.9/167.9 12.1 488.7 14.1/21.2 8.1 CCEX-SPF-D-7 23 35 6.0/13.8 8/226 42.3/121.0 9.2 267.8 13.5/23.1 5.9 CCEX-SPF-D-8 23 35 6.8/13.5 6/184 59.7/137.8 10.6 383.7 13.9/23.6 7.0 CCEX-SPF-D-9 21 35 3.4/14.1 8/168 20.8/109.2 3.3 131.2 8.6/17.7 2.1 CCEX-SPF-D-10 21 35 6.8/13.6 6/209 50.4/155.8 10.2 392.4 13.3/27.4 6.7 CCEX-SPF-D-11 20 37 4.5/14.7 24/225 29.8/88.6 6.0 151.9 11.9/25.6 3.6
CCEX-SPF-D-12 20 37 4.4/14.7 NI/1800 NA/NA NA NA NA/NA NA
CCEX-SPF-D-13 20 37 3.9/13.8 NI/600 NA/NA NA NA NA/NA NA
CCEX-SPF-D-14 18 37 1.2/12.8 24/67 34.8/84.7 1.5 59.7 11.5/18.6 1.8
CCEX-SPF-D-15 18 37 3.3/15.8 NI/1800 NA/NA NA NA NA/NA NA
CCEX-SPF-D-16 17 37 2.6/15.1 NI/1800 NA/NA NA NA NA/NA NA
CCEX-SPF-D-17 17 37 3.3/14.5 NI/1800 NA/NA NA NA NA/NA NA
CCEX-SPF-D-18 15 37 2.5/13.6 NI/1200 NA/NA NA NA NA/NA NA
HRR – Heat release rate HR – Heat release EHC – Effective heat of combustion NI – No ignition *Measured values are for time period with flaming combustion between the specimen ignition and flameout.
Table 5. Ignition properties of XPS foam and SPF insulations used in full-scale test assembly. Parameter XPS SPF qcr(kW/m2) 5.2 7.0 qmin(kW/m2) 24.0 17.5 Tig (qcr) (C) 184.1 225.2 Tig (qmin) (C) 453.4 387.0
A1-100035-01.3 23
RESULTS OF CONE CALORIMETER TESTS OF WATER RESISTANT BARRIERS
Two types of water resistant barriers (WRBs) are typically used in present day construction to prevent ingress of moisture in exterior wall assemblies of wood construction:
1. Paper impregnated with asphalt. This is a paper product made from recycled cellulose products such as cardboard and sawdust. The paper is saturated with asphalt.
2. Thermoplastic polyolefin (TPO). TPO is a thin plastic membrane, which has been in use since 2003. This product is considered more durable and less prone to puncture and tear, and is lighter and stronger than the paper based products.
There are also breathable WRBs, which allow water vapour to pass through the WRB to minimize condensation. This type of product was not part of the testing.
A sample of each type of WRB was obtained locally for cone calorimeter tests. The two products are identified as CCEX-WRB-A (paper impregnated with asphalt) and WRB-2 (TPO). The results of these tests are summarized in Table 6. Plots showing the heat release rate and change in specimen mass for the WRB materials are provided in Figure 15.
The results of the cone calorimeter tests with the two water resistant barrier materials indicate that the paper impregnated with asphalt product (CCEX-WRB-A) ignited earlier and produced a higher peak heat release rate than the TPO product (CCEX-WRB-B). In addition, CCEX-WRB-A produced a higher total heat output per unit area than CCEX-WRB-B. As such, CCEX-WRB-A may present a higher hazard than CCEX-WRB-B. This material (CCEX-WRB-A) was selected for use in the full-scale exterior wall tests.
Figure 15. Heat release rate and specimen mass of tests of weather resistant barrier materials. Time (min) 0 50 100 150 200 H ea t R el e as e R a te ( kW /m 2 ) 0 20 40 60 80 100 120 140 160 180 200 220 240 260 M as s (g ) 0 1 2 3 4 5 HRR CCEX-WRB-A HRR CCEX-WRB-B Mass CCEX-WRB-A Mass CCEX-WRB-B
Table 6. Cone calorimeter results for preliminary tests of water resistant barriers.
Specimen Heat Flux Thickness Mass Lost/ Ignition/ End of HRR Total Total Smoke EHC Fuel
Initial Mass Flameout Test Mean/Peak HR Release Mean/Peak Load
(kW/m2) (mm) (g) (s) (s) (kW/m2) (MJ/m2) (m2/m2) (MJ/kg) (MJ/kg)
CCEX-WRB-A 50 0.30 2.2/2.9 11/46 46 125.8/218.7 4.4 1.0 17.9/18.1 13.6
CCEX-WRB-B 50 0.08 0.5/0.6 28/82 82 48.7/139.1 2.6 0.2 50.2/19.3 38.6
A1-100035-01.3 25
RESULTS OF CONE CALORIMETER TESTS OF EXTERIOR SHEATHING MATERIALS Results of Preliminary Tests of FRT Plywood
Cone calorimeter tests at various heat fluxes were conducted on specimens from two FRT plywood samples, A and B. A different fire retardant was used to treat each of the two samples. Both samples were obtained from retail outlets in the Canadian market.
The results of these tests are summarized in Table 7. Plots showing the heat release rate and change in specimen mass for specimens from Sample A are provided in Figure 16 and Figure 17, respectively, and in Figure 18 and Figure 19, respectively, for specimens from Sample B. The heat release rate and specimen mass results for the two FRT plywood samples are comparable and are consistent with published results for similar products. For most tests, the heat release plots show the typical double peak structure found for cone calorimeter tests with cellulosic products.
Sample A was thicker than Sample B (nominal 15.9 mm versus nominal 12.7 mm). Sample A was also denser than Sample B; it produced slightly more total heat release compared with the results from Sample B, normalized using the relative thickness. Specimens from Sample A also had comparable or slightly higher fuel load results than specimens from Sample B.
The ignition time data was used to provide ignitability plots for the two FRT plywood samples. The results are shown in Figure 20 and Figure 21 for Sample A and Sample B, respectively. The qcr values determined from these plots were used to determine the ignition temperatures for
the two materials (Table 8). The results are consistent with literature values of 360 - 400C for FRT plywood [16]. The results indicate that the two materials have similar ignition temperatures. The cone tests of the two FRT plywood samples indicate that the two materials are comparable. However, the results indicate that Sample A may present a slightly higher hazard and this material was selected for use in the full-scale test.
Figure 16. Heat release rates for preliminary tests of FRT plywood A. Time (s) 0 500 1000 1500 2000 2500 H ea t R el e as e R a te ( kW /m 2 ) 0 10 20 30 40 50 60 70 80 90 100 CCEX-FRT-A-1 CCEX-FRT-A-2 CCEX-FRT-A-3 CCEX-FRT-A-4
Figure 17. Specimen mass for preliminary tests of FRT plywood A.
Time (s) 0 500 1000 1500 2000 2500 H ea t R el e as e R a te ( kW /m 2 ) 0 50 100 150 200 CCEX-FRT-A-1 CCEX-FRT-A-2 CCEX-FRT-A-3 CCEX-FRT-A-4
A1-100035-01.3 27
Figure 18. Heat release rates for preliminary tests of FRT plywood B.
Figure 19. Specimen mass for preliminary tests of FRT plywood B.
Time (s) 0 500 1000 1500 2000 2500 H ea t R el e as e R a te ( kW /m 2 ) 0 50 100 150 200 CCEX-FRT-B-1 CCEX-FRT-B-2 CCEX-FRT-B-3 Time (s) 0 500 1000 1500 2000 2500 H ea t R el e as e R a te ( kW /m 2 ) 0 10 20 30 40 50 60 70 80 90 100 CCEX-FRT-B-1 CCEX-FRT-B-2 CCEX-FRT-B-3
Figure 20. Ignitability plot for FRT plywood A.
Figure 21. Ignitability plot for FRT plywood B.
Heat Flux (kW/m2) 0 10 20 30 40 50 (1 /tig ) 0 .5 5 0.00 0.05 0.10 0.15 0.20 (1/tig)0.55 Linear Regression Heat Flux (kW/m2) 0 10 20 30 40 50 (1 /tig ) 0. 55 0.00 0.05 0.10 0.15 0.20 (1/tig)0.55 Linear Regression
A1-100035-01.3 29
Table 7. Cone calorimeter results for preliminary tests of FRT plywood*.
Specimen Heat Flux Thickness# Mass Lost/ Ignition/ End of HRR Total Total Smoke EHC Fuel
Initial Mass Flameout Test Mean/Peak HR Release Mean/Peak Load
(kW/m2) (mm) (g) (s) (s) (kW/m2) (MJ/m2) (m2/m2) (MJ/kg) (MJ/kg) CCEX-FRT-A-1 50 16.0 74.5/91.9 23/1898 1823 59.6/190.4 107.4 193.9 12.7/35.2 10.3 CCEX-FRT-A-2 30 16.0 69.1/95.1 174/1397 1974 50.8/157.1 91.4 136.1 11.7/28.1 8.3 CCEX-FRT-A-3 20 15.0 57.8/90.4 618/1690 2418 41.7/139.6 75.1 93.8 11.5/24.1 7.3 CCEX-FRT-A-4 17 15.5 50.4/90.0 1362/2139 3162 37.7/124.5 67.9 17.1 11.9/31.3 6.7 CCEX-FRT-B-1 30 12.0 50.7/65.5 51/1262 1851 36.0/145.3 64.8 39.0 11.3/25.7 8.8 CCEX-FRT-B-2 20 12.0 39.0/66.7 719/1305 2519 25.4/100.2 45.7 18.9 10.4/26.4 6.1 CCEX-FRT-B-3 17 12.0 35.7/66.7 1148/1602 2948 22.8/113.7 41.1 156.2 10.2/23.9 5.5
HRR – Heat release rate HR – Heat release EHC – Effective heat of combustion
#The nominal thicknesses were 15.9 mm for FRT-A and 12.7 mm for FRT-B. The thicknesses provided in this table are measured
values.
*Measured values are for time period between the specimen ignition and the end of test. The end of test was determined using the criterion in ISO 5660 [14].
Table 8. Ignition properties for FRT plywoods in preliminary tests.
Parameter FRT Plywood A FRT Plywood A
qcr(kW/m2) 14.5 15.3
qmin(kW/m2) NA NA
Tig (qcr) (C) 350.0 360.4
Tig (qmin) (C) NA NA
A1-100035-01.3 31
Results of Cone Calorimeter Tests of Sheathing Materials with Substrates
The cone calorimeter results for tests of two sheathing materials are provided in this section. For each sheathing material, the following parameters for the test setup and initial conditions are provided for each test:
1. Thickness of the sheathing material. The gypsum sheathing was nominal 12.7 mm thick and the FRT plywood was nominal 15.9 mm thick. All tests were conducted with a single layer of sheathing material.
2. Ceramic fibre insulation. A 25 mm thick piece of ceramic fibre insulation was located at the bottom of the specimen holder.
3. Holder. Tests were conducted with the large holder specified in CAN/ULC S135 [15]. 4. Heat flux. All tests were conducted using a 50 kW/m2heat flux.
5. Ambient temperature. The ambient temperature for each test is provided. The temperature indicated is the average temperature of the five thermocouples located at the interface between the sheathing material and the substrate at the start of the test. 6. Moisture content. The moisture content of the untreated (non-FRT) plywood used as
the substrate in two tests with gypsum sheathing and the FRT plywood sheathing was measured prior to the test. The results shown are the average of four measurements taken at the center of the plywood substrate with two measurements taken on each face. The results shown for each test are as follows:
1. Ignition time for the sheathing material.
2. Ignition time for the substrate. The ignition time for the substrate is based on the time at which a secondary flame was observed at the surface of the substrate resulting in an increased heat release rate.
3. Interface temperature increases. The temperature increases (over the initial ambient temperature), T, measured by TCs 1 – 5 are plotted for each test. The average temperature increase (the arithmetic average of TCs 1 – 5 at each time interval) is also shown.
4. Foam insulation temperature increase. For the tests with foam insulation substrates, a thermocouple (TC 7) was inserted into the center of the foam insulation. This
thermocouple was located approximately 6 mm above the base of the foam insulation. The results are plotted as temperature increase over the initial ambient temperature. 5. Pyrometer. The temperature measured near the center of the exposed surface of the
sheathing material measured using the pyrometer is shown for each test with the measured temperature plotted versus the right (temperature) y-axis of the figure.
6. Surface Temperature. A surface-mounted thermocouple was located near the center of the exposed surface of the sheathing material. As with the pyrometer, the measured temperature is plotted versus the right (temperature) y-axis of the figure.
7. Heat release rate. The heat release rate measured using the cone calorimeter is shown for each test.
8. Mass. The change in specimen mass is shown for each test.
Seven cone calorimeter tests were conducted with 12.7 mm thick gypsum sheathing used to protect substrate materials: 2 tests with an untreated (non-FRT) plywood substrate, 2 tests with an XPS rigid foam insulation substrate and 3 tests with a SPF insulation substrate. The gypsum sheathing was combustible with a flame spread rating of 20, and a smoke developed
classification of 0. The other test parameters and conditions are summarized in Table 9. The ignition times for the gypsum sheathing and the substrates are provided in Table 10. The surface temperature measured using the pyrometer and the surface mounted thermocouple for Specimens CCEX-GS-1 –7 are shown in Figure 22, Figure 24, Figure 26, Figure 28, Figure 30, Figure 32 and Figure 34, respectively.
The surface temperature was measured in all tests using a pyrometer and a surface-mounted thermocouple. Both temperature measurements were taken near the center of the exposed surface of the gypsum sheathing. The average surface temperatures for each substrate measured using the pyrometer and TC 6 are plotted in Figure 36, (for example, the pyrometer values from the three tests with an SPF insulation substrate are presented as an average). Some general observations based on the temperature measurements are as follows:
1. There was an initial rapid heating of the specimen surface corresponding to the burning of the gypsum sheathing. This results in an initial peak temperature occurring in <60 s after the initial exposure. After the initial temperature peak and a subsequent small decrease in temperature, there was generally a gradual increase in temperature until the substrate was ignited. With the ignition of the substrate, there was a second peak
temperature. The second peak was more apparent in the tests with the XPS foam insulation and plywood substrate. There was minimal or no increase in temperature with the SPF insulation substrate, which is consistent with the low heat outputs observed in the tests of this material.
2. For the tests with plywood and XPS foam insulation substrates, there was generally good comparison for the temperatures measured using the pyrometer and surface thermocouple throughout each test. The differences in the results are within the accuracy of the two measurement methods, which is approximately ±2% for the thermocouple measurements and approximately ±0.02% for the pyrometer measurements.
3. For the tests with the SPF insulation substrate, the two temperature measurements were comparable during the initial 10 min. However, after 10 min, the temperature measured by the thermocouple was lower than that measured by the pyrometer in Tests CCEX-GS-6 and CCEX-GS-7. The reason for this difference in temperature is not known. 4. The surface temperature was slightly lower for the test with the plywood substrate than
with the two insulation materials. The insulation materials limit heat loss from the back surface of the gypsum sheathing resulting in higher temperatures in the gypsum sheathing including at the exposed surface..
The temperature increases measured at the gypsum sheathing/substrate interface for the individual tests of Specimens CCEX-GS-1 - CCEX-GS-7 are also shown in Figure 22, Figure 24, Figure 26, Figure 28, Figure 30, Figure 32 and Figure 34. For the tests with foam insulation substrates, the temperature increases measured approximately 6 mm above the base of the substrate are also shown (TC 7).The average temperature increase at the gypsum
sheathing/substrate interface is shown in Figure 37. Some general observations based on the temperature increase results are as follows:
A1-100035-01.3 33
1. For the tests with a plywood substrate, the temperature increase profile at the gypsum sheathing/substrate interface was similar to that observed for gypsum board exposed to a heating source [17]. Initially, there was a rapid temperature increase of 50 - 60C within approximately 2 min. This was followed by a second stage with a more gradual temperature increase during calcination of the gypsum sheathing and the vaporization of the water. This stage lasted until approximately 13 min, at which time the temperature increase was approximately 100C. In the third stage, there was a rapid temperature increase.
2. The temperature increase measured at the five locations at the gypsum sheathing and the plywood interface was comparable, particularly during the first two heating stages. There was more variation in the temperature increases at the five locations in the third stage.
3. For the tests with foam insulation substrates, the initial profiles up to 4 min were similar to those for the test with plywood. There was an initial rapid increase in temperature of approximately 60C within 2 min followed by as short time period with a slow increase. However, unlike the tests with the plywood substrate, there was a second increase in temperature between 4 and 6 min followed by a second period with a slower
temperature increase prior to the final stage with a rapid increase in temperature at the interface between the sheathing and the substrate.
4. The temperature increases measured at the five locations at the gypsum sheathing interface with the foam insulation substrates showed considerable variation after the initial temperature increase. However, the average temperature increase profiles were similar for all the tests with foam insulation substrates (Figure 37).
5. The temperature increase at the gypsum sheathing interface with the foam insulation substrates was faster than at the gypsum sheathing interface for the tests with the plywood substrate. This indicates there was less heat loss from the interface through the foam insulations than through the plywood over a given period of time.
6. The temperature increase measured by the thermocouple inserted into the foam
insulations (TC 7) indicates that there was an initial slow increase in temperature at this location. This was followed by a second stage with a more rapid temperature increase. The second-stage temperature increase occurred earlier for the tests with the XPS foam insulation than for tests with the SPF insulation.
The heat release rate and specimen mass measured for the individual tests for the 12.7 mm thick gypsum sheathing specimens (Specimens CCEX-GS-1 - CCEX-GS-7) are shown in Figure 23, Figure 25, Figure 27, Figure 29, Figure 31, Figure 33 and Figure 35, respectively. Figure 38 shows the heat release rates for all seven tests. Some general observations based on the heat release rate and mass results are as follows:
1. There was an initial peak heat release rate in the initial stage of each of the tests
consistent with the burning of the paper on the gypsum sheathing. This was followed by an extended period with no heat output until the substrate ignited.
2. The foam insulation substrates ignited earlier than the plywood substrate. This is likely due to the faster temperature increase at the gypsum sheathing/substrate interface for the tests with foam insulation.
3. The heat release from the substrate was comparable for the tests with the same substrate. The one exception was Test 6 with a SPF insulation substrate which ignited earlier than the other tests with this material (Tests CCEX-GS-5 and CCEX-GS-7) and produced additional heat output. There were similar variations in the ignitability of SPF insulation with direct exposure with low incident fluxes.
4. The highest peak heat release rates were for the tests with the plywood substrate with peak heat release rates of approximately 140 – 150 kW/m2. The lowest were the tests
with SPF insulation with peak heat release rates of approximately 20 – 40 kW/m2. The
peak heat release rate for the tests with XPS foam insulation was approximately 60 kW/m2.
5. The heat output profiles for the foam insulations for the tests with the gypsum sheathing over foam insulation substrates are different than the results with direct exposure of the foam insulations (see Figure 38 versus Figure 9 and Figure 11).
6. The tests with direct exposure of XPS foam insulation had an initial rapid increase in heat release rate to approximately 300 kW/m2(see Figure 9) and the foam was
consumed within 200 s. For the tests with the gypsum sheathing over the XPS foam insulation substrate, the peak heat output was much lower and the duration much longer (600 s).
7. The results for the tests with the SPF insulation are similar to the results of the test of SPF insulation with a 18 kW/m2direct exposure shown in Figure 11. The peak heat
output is lower in the tests with the gypsum sheathing over the SPF insulation substrate. However, the duration with heat release is longer. These results suggest that there may be charring of the SPF insulation, which limits the heat output.
8. The specimen mass results for the seven tests of gypsum sheathing with substrate materials indicate there was a slow decrease in the specimen mass prior to the ignition of the substrate. Subsequent to ignition, there was a further decrease in mass as the substrate burned.
The average (TC-01 – TC-05) and maximum single point temperature for TC-01 – TC-05 at the interface between the gypsum sheathing and the substrate at the ignition time for the substrate is provided in Table 10. The average temperature measured at the gypsum sheathing and substrate interface at the time the plywood, XPS foam and SPF substrates ignited was 392.8, 440.7 and 404.0C, respectively. The results for the tests with plywood are consistent with the temperatures in the literature for plywood at ignition [16]. The ignition temperature results for the XPS foam and SPF insulations are consistent with the ignition temperature results of the cone calorimeter tests of directly exposed foam insulation (see Table 5).
A1-100035-01.3 35
Table 9. Test setup and conditions for tests of 12.7 mm thick gypsum sheathing.
Specimen Ambient Substrate Substrate Ceramic Holder Heat Moisture
Temperature Thickness Fibre Flux Content
(Plywood)
(C) (mm) (kW/m2) (%)
CCEX-GS-1 27.74 Plywood 15.9 Yes Large 50 6.1±0.1
CCEX-GS-2 26.28 Plywood 15.9 Yes Large 50 6.8±0.6
CCEX-GS-3 29.65 XPS 37 Yes Large 50 NA
CCEX-GS-4 26.63 XPS 37 Yes Large 50 NA
CCEX-GS-5 26.32 SPF 37 Yes Large 50 NA
CCEX-GS-6 27.03 SPF 37 Yes Large 50 NA
CCEX-GS-7 26.32 SPF 37 Yes Large 50 NA
XPS – Extruded polystyrene rigid foam insulation SPF – Spray-applied polyurethane foam insulation
NA – Not applicable
Table 10. Gypsum sheathing and substrate ignition times.
Specimen Gypsum Substrate Gypsum Sheathing/Substrate Interface
Sheathing Ignition Average Maximum Single
Ignition Temperature* Point
Temperature# (min) (min) (ºC) (ºC) CCEX-GS-1 0.37 21.83 385.6 423.4 CCEX-GS-2 0.32 23.47 400.0 463.8 CCEX-GS-3 0.33 19.78 437.8 446.1 CCEX-GS-4 0.32 21.42 443.6 461.0 CCEX-GS-5 0.36 19.41 420.6 465.7 CCEX-GS-6 0.45 15.78 350.7 395.5 CCEX-GS-7 0.43 20.48 440.7 481.3
*Average Temperature – Average temperature (TC-01 – TC-05) at gypsum sheathing/substrate interface at ignition time for substrate.
#Maximum Single Point Temperature – Maximum temperature measured by thermocouples at
Figure 22. Temperature measurements for Test CCEX-GS-1 of gypsum sheathing with plywood.
Figure 23. Heat release rate and mass for Test CCEX-GS-1 of gypsum sheathing with plywood. Time (min) 0 10 20 30 40 50 T ( °C ) 0 100 200 300 400 500 600 700 800 T e m p e ra tu re ( °C ) 0 100 200 300 400 500 600 700 800 900 TC 1 TC 2 TC 3 TC 4 TC 5 Average T 140°C T 195°C T 250°C Pyrometer TC 6 Time (min) 0 10 20 30 40 50 H ea t R el ea se R at e ( kW /m 2 ) 0 20 40 60 80 100 120 140 160 M as s (g ) 100 110 120 130 140 150 160 170 180 190 200 Heat Release Rate