Publisher’s version / Version de l'éditeur:
Vous avez des questions? Nous pouvons vous aider. Pour communiquer directement avec un auteur, consultez la première page de la revue dans laquelle son article a été publié afin de trouver ses coordonnées. Si vous n’arrivez pas à les repérer, communiquez avec nous à [email protected].
Questions? Contact the NRC Publications Archive team at
[email protected]. If you wish to email the authors directly, please see the first page of the publication for their contact information.
https://publications-cnrc.canada.ca/fra/droits
L’accès à ce site Web et l’utilisation de son contenu sont assujettis aux conditions présentées dans le site LISEZ CES CONDITIONS ATTENTIVEMENT AVANT D’UTILISER CE SITE WEB.
Joint International Conference on Computation in Civil and Building Engineering (ICCCBE XI) [Proceedings], pp. 1-11, 2006-06-14
READ THESE TERMS AND CONDITIONS CAREFULLY BEFORE USING THIS WEBSITE.
https://nrc-publications.canada.ca/eng/copyright
NRC Publications Archive Record / Notice des Archives des publications du CNRC : https://nrc-publications.canada.ca/eng/view/object/?id=159ac677-2264-461f-b399-d850c99fad2e https://publications-cnrc.canada.ca/fra/voir/objet/?id=159ac677-2264-461f-b399-d850c99fad2e
NRC Publications Archive
Archives des publications du CNRC
This publication could be one of several versions: author’s original, accepted manuscript or the publisher’s version. / La version de cette publication peut être l’une des suivantes : la version prépublication de l’auteur, la version acceptée du manuscrit ou la version de l’éditeur.
Access and use of this website and the material on it are subject to the Terms and Conditions set forth at
Evaluating impacts of changing drinking water regulations on distribution infrastructure integrity - a conceptual framework
http://irc.nrc-cnrc.gc.ca
Evaluating impacts of changing drinking water regulations
on distribution infrastructure integrity – a conceptual
framework
N R C C - 4 5 4 2 3
I m r a n , S . A . ; S a d i q , R . ; K l e i n e r ,
Y .
A version of this paper is published in / Une version de ce document se trouve dans: Joint International Conference on Computation in Civil and Building Engineering (ICCCBE XI), Montreal, QC., June 14-16, 2006, pp. 1-11
EVALUATING IMPACTS OF CHANGING DRINKING
WATER REGULATIONS ON DISTRIBUTION
INFRASTRUCTURE INTEGRITY - A CONCEPTUAL
FRAMEWORK
Syed A. Imran1, Rehan Sadiq2, and Yehuda Kleiner3
ABSTRACT
The drinking water distribution infrastructure is a network of pipes composed of different materials, of different ages and states of repair and subject to varying environments and stresses. Often newer drinking water regulations may require a change in the water-sources, treatment processes and/or practices. The distribution system is at the receiving end of these changes. It is understood from general principles, that any change in the quality of the transported water can adversely affect the distribution system components.
Relating changes in treatment practices to distribution infrastructure integrity is complicated by a number of inter-related processes taking place within the distribution system. This paper elaborates a conceptual framework for evaluating the impact of changes in treatment practices on the long-term structural and functional integrity of the distribution infrastructure. The proposed conceptual framework can be used to identify potential problems in the distribution infrastructure that are associated with the changing water treatment practices.
KEY WORDS
Drinking water, distribution infrastructure, regulatory compliance, treatment evaluation, water quality, hierarchical relational model (HRM)
INTRODUCTION
Water traveling through deteriorating distribution infrastructure may decrease in quality due to the uptake of contaminants through intrusion from compromised components, internal corrosion, leaching and permeation. Though considerable research exists that focuses on the deterioration of water quality through distribution infrastructure, the converse phenomenon of deterioration of distribution infrastructure has not been extensively studied. This paper provides a brief overview of the impacts of changing water quality on infrastructure integrity due to new regulations. The main focus of this paper is to identify how the water distribution network might be impacted by
1
Assistant Research Officer, Center for Sustainable Infrastructure Research, Institute for Research in Construction, National Research Council, Suite 301-6 Research Drive, Regina, SK, S4S 7J7, Canada. Phone +1 613/993-0122, FAX 613/993-1866, [email protected]
2
Associate Research Officer, Institute for Research in Construction, National Research Council, 1200 Montreal Rd., Bldg. M-20, Ottawa, ON, Canada, K1A 0R6. Phone +1 613/993-6282, FAX 613/993-1866, [email protected]
3
Senior Research Officer, Group Leader (& Acting Director Urban Infrastructure Program), Institute for Research in Construction, National Research Council, 1200 Montreal Rd., Bldg. M-20, Ottawa, ON, Canada, K1A 0R6. Phone +1 613/993-3805, FAX 613/993-1866, [email protected]
water quality changes that occur when water utilities attempt to comply with these new regulations.
DETERIORATION AND INTEGRITY OF WATER DISTRIBUTION INFRASTRUCTURE
In this paper, ‘integrity’ of distribution infrastructure is defined as its ability to transport water in acceptable quantity and quality without causing any ‘structural’ or ‘functional’ failure of its components. In the context of this research, a structural failure is defined as leaks and breaks in the pipes, while functional failure is the loss of quality and quantity of water.
Water quality failures in the distribution system are often an indicator of long-term deterioration. For instance, finished water introduced into the distribution system might cause metallic corrosion and lead to red water problems at the consumers tap. From a public water system (PWS) point of view, a water quality change (increase in color) is often the first indication that the integrity of the distribution system is being compromised in some way. A PWS may conduct further investigations to ascertain the cause of water quality deterioration.
Though the ‘structural’ integrity of the system may be intact, the ‘functional’ integrity could be compromised because of the failure of the distribution system to avoid deterioration of the transmitted water (due to corrosion, biofilms etc.). In actual PWS experience, the functional failures may persist for years before leading to an actual structural failure. For instance, water quality problems related to distribution system such as red water, loss of residual and subsequent microbiological proliferation may persist for years before actual failure of the pipe. Thus the water quality at the consumers tap can be used as an indicator of the “health” of the distribution infrastructure. Since distribution infrastructure is essentially a buried structure, these symptoms are often used to measure the impact of finished water quality on its integrity.
Public water systems have traditionally taken a long-term approach to maintaining and rehabilitating the distribution infrastructure when compared with the short-term urgency of water quality deterioration. Compromise on the integrity of water distribution infrastructure could trigger a number of water quality deterioration mechanisms including internal corrosion, leaching, contaminant intrusion, microbial proliferation and permeation of organic compounds through system components (Sadiq et al. 2004). Failure at the distribution level can be critical because it is closest to the point of use and there are virtually no safety barriers before consumption. PWSs must manage the source-waters, treatment processes and distribution infrastructure holistically in order to maintain the quality at the consumers tap.
The distribution infrastructure can be divided into three broad groups of materials - metallic, polymeric and/or cementitious. The distinction between these three is based on the dominant deterioration processes; internal corrosion, microbiologically induced corrosion (MIC) or and leaching of material. Though a specific material may have a predominant mechanism of deterioration, all three processes play a role (at different levels) towards an overall deterioration of the buried asset.
DRINKING WATER REGULATIONS AND WATER QUALITY
Public water systems are under tremendous pressure to meet national and state regulations/guidelines for maintaining maximum contaminant levels (MCLs) in the distribution system, in order to provide consumers with safe drinking water ((Pontius 2004)). The United States Environmental Protection Agency (USEPA) establishes national drinking water regulations in the US, under the Safe Drinking Water Act (SDWA) of 1974. Currently 91
contaminants are regulated by establishing MCLs in the treated water before introduction into the distribution system (Pontius 2004).
Traditionally, utilities have managed the mandated compliance levels by upgrading and optimizing their treatment processes or by changing source-waters (Daniel 1998; Taylor et al. 2005). Recent and proposed future regulations are more complex and favor a managed, multiple strategy approach to maintaining safe drinking water quality. For instance, a surface water system is expected to reduce overall risk by balancing the short-term (acute) and certain microbiological risk with the potential long-term (chronic) and uncertain risk from disinfection byproducts (DBPs) (Ashbolt 2004). The USEPA addresses this risk-risk trade-off by promulgating paired regulations, Stage 1 Disinfectant/Disinfection Byproduct Rule and Long Term 1 Enhanced Surface Water Treatment Rule (Stage 1 D/DBPR and LT1ESWTR), simultaneously. Specific provisions in these paired regulations require utilities to comply with both. This encourages utilities to carefully evaluate treatment alternatives to reduce DBPs while maintaining microbial protection ((Roberson 2003). The upcoming Groundwater Rule (GWR) and Stage 2 D/DBPR are expected to provide similar provisions for groundwater systems.
Changes in the treatment techniques, to reduce or eliminate contaminants of concern, which in turn may trigger a cycle of changes, in which the distribution system as well as the final water quality are likely to be impacted (Imran et al. 2005). It is noted that depending on their size and water source, PWS may not have to comply with all the drinking water regulations. Most regulations are limited to PWSs of particular size and source.
DRINKING WATER TREATMENT TECHNOLOGIES
Regulatory compliance with drinking water standards can be achieved by using alternate water sources, treatment chemicals and/or treatment technologies. A survey of 200 PWSs in the US indicated that 50% anticipated changes in their treatment practices to meet future regulations (AWWA 2000). These changes in treatment practices could be as simple as controlling pH or could be a complete overhaul of existing treatment facilities.
The selection of a particular technology for drinking water treatment is governed largely by the PWSs consideration of a number of constraints in addition to the requirement to provide safe drinking water. Sometimes the best technology for a particular source-water or regulated contaminant may not be feasible due to other considerations. These considerations may include state and national environmental and permitting restrictions on the plant-siting, limitations on withdrawals from a desirable source, restrictions on disposal of process wastes, logistic requirements of monitoring, operation and maintenance, future capacity development and cost of construction (Pontius 2003a).
The selection of a particular train (series) of unit treatment processes is complicated, as even a small number of unit processes can be arranged in numerous sequences. Furthermore, depending upon their location within the treatment train, effects of unit processes can be synergistic or antagonistic for the removal of specific contaminants.
The primary objective of any treatment technology is to achieve acceptable removals of the targeted contaminants. However, the use of pre-treatment, treatment and post-treatment practices causes changes in the ionic content of the water and can impact distribution infrastructure. For instance, coagulation may be achieved by using alum, ferric chloride or ferric sulfate. Alum and ferric sulfate will increase the sulfate in the finished water relative to the source water, while ferric chloride will increase the chloride content of the water. Both sulfate and chloride increase the corrosion of metallic pipes, albeit to a different degree. Coagulation is
also accompanied by a consumption of total alkalinity in the source water. Decreased alkalinity is detrimental to iron components in the distribution system, but at the same time may be beneficial in reducing copper corrosion.
The evaluation of all different trains of unit processes and their related water quality impacts is neither intended nor attempted in this paper. Instead, different unit processes are evaluated for their simultaneous impact on the removal of different contaminants. The water quality impacts for the unit processes comprising a train can be collated to give an estimate of the overall water quality impact due to the treatment train. The assumption here is that the water quality impact of a particular treatment train is the aggregation of the individual impacts of the unit processes.
PROPOSED HIERARCHICAL RELATIONAL MODEL (HRM)
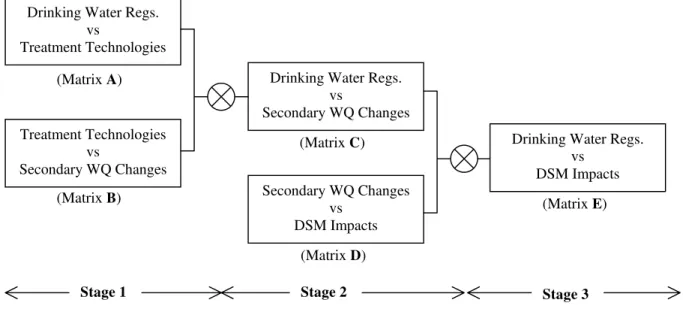
This section introduces a method to identify problems related to the integrity of distribution system associated with changing water quality for regulatory compliance. A hierarchical relational model (HRM) is proposed for this purpose. The HRM is schematically illustrated in Figure 1. In Stage 1, the primary and secondary impacts of drinking water regulations are defined using the matrices A and B respectively. In Stage 2, matrices A and B are aggregated to yield matrix C. Further, matrix D is defined in Stage 2. In Stage 3, matrix C is aggregated with matrix D to yield the final effects matrix E.
This procedure allows experts in different domains/fields to provide inputs to the relational matrices depending on their expertise. Also research needs can be identified easily by studying gaps in the effects-matrices.
(Matrix C) Drinking Water Regs.
vs
Secondary WQ Changes
(Matrix B) (Matrix A) Drinking Water Regs.
vs Treatment Technologies Treatment Technologies vs Secondary WQ Changes (Matrix D) Secondary WQ Changes vs DSM Impacts (Matrix E) Drinking Water Regs.
vs DSM Impacts
Regs – regulations, WQ – Water Quality, DSM – distribution system material
Stage 1 Stage 2 Stage 3
Figure 1: Proposed Hierarchical Relationship model (HRM)
Matrix A relates the effectiveness of common unit treatment processes towards compliance of drinking water regulations. The element αij is a measure of the effectiveness of unit treatment ‘j’ (UTj) towards compliance of drinking water regulation ‘i’ (Regi). Matrix A was populated
A value of +1 indicates the most effective technology to remove the selected contaminant, while –1 indicates a technology that might hinder the removal of the selected contaminant. A value of 0 is given to a technology that has no known effect on the removal of a selected contaminant.
⎟⎟ ⎟ ⎟ ⎟ ⎟ ⎟ ⎠ ⎞ ⎜⎜ ⎜ ⎜ ⎜ ⎜ ⎜ ⎝ ⎛ = IJ I I J J α α α α α α α α α L M L M M M L L L 2 1 2 22 21 1 12 11 I Reg 2 Reg 1 Reg J UT 2 UT 1 UT A ; where i = 1, 2,..., I j =1, 2, ..., J (1) ⎟⎟ ⎟ ⎟ ⎟ ⎟ ⎟ ⎠ ⎞ ⎜⎜ ⎜ ⎜ ⎜ ⎜ ⎜ ⎝ ⎛ = JK J J K K B β β β β β β β β β L M L M M M L L L 2 1 2 22 21 1 12 11 K 2 1 J UT 2 UT 1 UT WQP WQP WQP ; where j =1, 2, ..., J k = 1, 2,..., K (2)
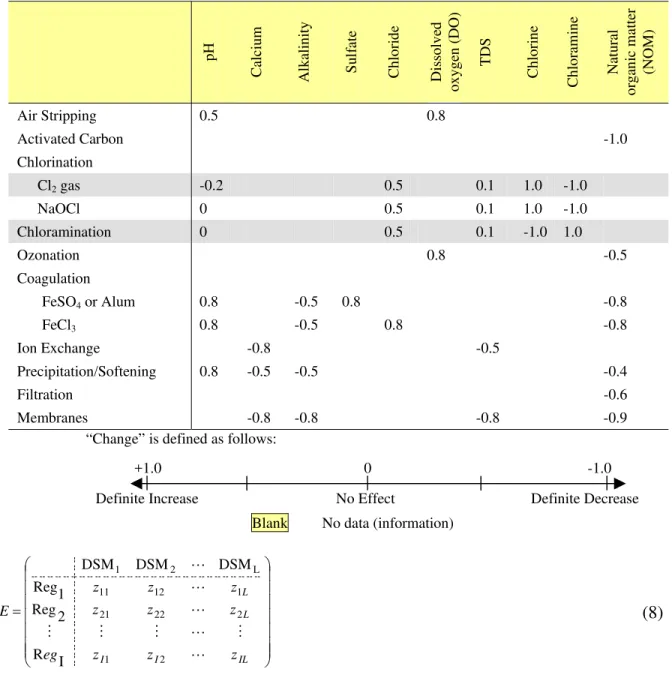
The matrix B relates the effect of unit technology (UTj) on increase or decrease in selected
water quality parameter (WQPk). Primary water quality changes as well as secondary water
quality impacts were evaluated for each specific treatment technology (Table 2). For instance, the primary impact of ion exchange is the removal of targeted ions from water and the secondary impact is the removal of non-targeted ions and the addition of counter-ions to the water. Secondary changes induced by the treatment technologies are dose-specific. For instance, depending on the source water quality, different concentration of treatment chemicals need to be added and thereby result in different concentrations of secondary ions in the finished water. The water-quality parameters selected are those known or suspected in the deterioration of distribution infrastructure.
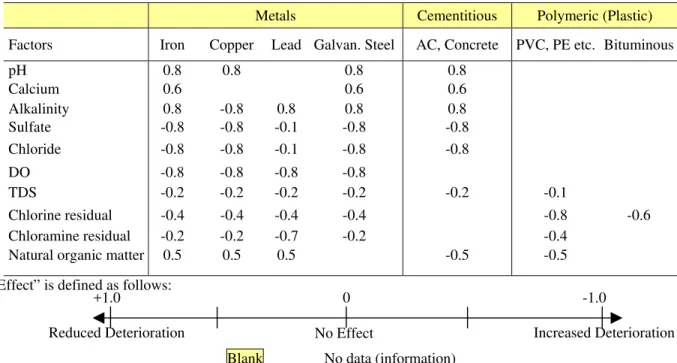
Matrix D relates the effect of change in selected water-quality parameters (WQPk) on the
deterioration of selected distribution system material (DSM). The element γkl is a measure of the
adverse effect that an increase in WQPk have on DSMl. Table 3 provides values for matrix D.
These values represent aggregate impacts and should be used for a qualitative evaluation, rather than a quantitative one.
⎟⎟ ⎟ ⎟ ⎟ ⎟ ⎟ ⎠ ⎞ ⎜⎜ ⎜ ⎜ ⎜ ⎜ ⎜ ⎝ ⎛ = KL K K L L D γ γ γ γ γ γ γ γ γ L M L M M M L L L 2 1 2 22 21 1 12 11 L 2 1 K WQP 2 WQP 1 WQP DSM DSM DSM ; where k = 1, 2, ..., K l = 1, 2,..., L (3) 5
Table 1: Effectiveness of Selected Treatments in Removing Drinking Water Contaminants (A)
Contaminant Categories Air St
rip p in g A ctivated C arb on Ch lo ri n ation Ch lo ramin e Ozon ation C o ag ul at ion Io n Exc h ange Precip itatio n /So ften ing Filtratio n Mem b ra nes Inorganics Arsenic 0.8 0.8 0.8 0.9 Disinfection Byproduct Formation Potential Bromate 0.4 -1.0 TTHMs 1.0 -1.0 -0.2 0.8 HAA5 1.0 -1.0 -0.2 0.8 Microorganisms HPC bacteria 1.0 0.8 1.0 0.6 0.5 0.8 Viruses 1.0 0.5 0.8 0.6 0.8 Cryptosporidium 1.0 0.5 1.0 0.6 0.8 Organic Contaminants Volatile organics 1.0 0.8 0.5 0.5 Dissolved organics 0.5 1.0 0.5 0.8 0.8
“Effectiveness” is defined as follows:
+1.0 0 -1.0
Most Effective Technology No Effect Adversely Effective Technology
Blank No data (information)
The transition from Stage 1 to Stage 2 (Figure 1) is performed by;
B A
C= ⊗ (4)
where, ⊗ represents a composition operation defined by;
∑
= × ⋅ = J j jk ij jk ik signof C 1 ) ( ) (β α β , where i = 1, 2,..., I k = 1, 2, ..., K (5)Similarly, the transition to Stage 3 is performed by;
D C
E= ⊗ (6)
∑
= × = K k kl ik il C z 1 ) ( γ , where i = 1, 2,..., I l = 1, 2, ..., L (7)Table 2: Secondary Water Quality Changes due to Treatment Techniques (B)
pH Calciu m Alk alin ity Sulfate Chlo ri d e Dissol v ed o xyg en (DO ) TDS Ch lo ri n e Ch lo ramin e Natural or ga ni c mat te r (NOM ) Air Stripping 0.5 0.8 Activated Carbon -1.0 Chlorination Cl2 gas -0.2 0.5 0.1 1.0 -1.0 NaOCl 0 0.5 0.1 1.0 -1.0 Chloramination 0 0.5 0.1 -1.0 1.0 Ozonation 0.8 -0.5 Coagulation FeSO4or Alum 0.8 -0.5 0.8 -0.8 FeCl3 0.8 -0.5 0.8 -0.8 Ion Exchange -0.8 -0.5 Precipitation/Softening 0.8 -0.5 -0.5 -0.4 Filtration -0.6 Membranes -0.8 -0.8 -0.8 -0.9
“Change” is defined as follows:
+1.0 0 -1.0
Definite Increase No Effect Definite Decrease
Blank No data (information)
⎟⎟ ⎟ ⎟ ⎟ ⎟ ⎟ ⎠ ⎞ ⎜⎜ ⎜ ⎜ ⎜ ⎜ ⎜ ⎝ ⎛ = IL I I L L z z z eg z z z z z z E L M L M M M L L L 2 1 2 22 21 1 12 11 L 2 1 I R 2 Reg 1 Reg DSM DSM DSM (8)
The element zil, indicates the impact of changing treatment technique for regulatory
compliance (Regi) on the distribution system material (DSMl). Taking an arithmetic average
(based on the number of regulations that were selected), would give the overall impact on DSMl.
(DSMl).
I z DSM I i il l ∑
= =1 ; where I = Number of regulations under consideration (9)
Table 3: Effect of Water Quality Parameters on Deterioration of Distribution Materials (D)
Metals Cementitious Polymeric (Plastic)
Factors Iron Copper Lead Galvan. Steel AC, Concrete PVC, PE etc. Bituminous
pH 0.8 0.8 0.8 0.8 Calcium 0.6 0.6 0.6 Alkalinity 0.8 -0.8 0.8 0.8 0.8 Sulfate -0.8 -0.8 -0.1 -0.8 -0.8 Chloride -0.8 -0.8 -0.1 -0.8 -0.8 DO -0.8 -0.8 -0.8 -0.8 TDS -0.2 -0.2 -0.2 -0.2 -0.2 -0.1 Chlorine residual -0.4 -0.4 -0.4 -0.4 -0.8 -0.6 Chloramine residual -0.2 -0.2 -0.7 -0.2 -0.4
Natural organic matter 0.5 0.5 0.5 -0.5 -0.5
“Effect” is defined as follows:
+1.0 0 -1.0
Reduced Deterioration No Effect Increased Deterioration
Blank No data (information)
APPLICATION
Suppose that a utility considers changing its secondary disinfectant from chlorine to chloramines to comply with the Disinfectant/Disinfection Byproduct Rule (D/DBPR) for TTHMs and HAA5.
From Table 1 it can be seen that chloramination has a less adverse DBP formation impact than chlorination (highlighted region). Though the utility has conducted studies that show that the change will indeed result in compliance with the D/DBPR, there is some concern over the impact on the distribution system.
The first step would be to establish a baseline value for current changes, to which the proposed changes can be compared. Therefore the rows for TTHM and HAA5 are activated
along with the column for chlorination. The resulting A is:
⎟⎟ ⎟ ⎟ ⎠ ⎞ ⎜⎜ ⎜ ⎜ ⎝ ⎛ − − = 0 . 1 5 H 0 . 1 T C AA THM n hlorinatio A
The secondary water quality changes due to chlorination are given in Table 2. Based on the water quality parameters that change during chlorination;
⎟⎟ ⎠ ⎞ ⎜⎜ ⎝ ⎛ − − = 0 . 1 0 . 1 1 . 0 5 . 0 2 . 0 min on Chlorinati e Chlora Chlorine TDS Chloride pH B
From Table 3, the impact of the water quality on iron, copper and lead is;
⎟ ⎟ ⎟ ⎟ ⎟ ⎟ ⎟ ⎟ ⎠ ⎞ ⎜ ⎜ ⎜ ⎜ ⎜ ⎜ ⎜ ⎜ ⎝ ⎛ − − − − − − − − − − − − = 7 . 0 2 . 0 2 . 0 min 4 . 0 4 . 0 4 . 0 2 . 0 2 . 0 2 . 0 1 . 0 8 . 0 8 . 0 5 . 0 8 . 0 8 . 0 e Chlora Chlorine TDS Chloride pH Lead Copper Iron D
Using Equation 4 and 6, the resulting effects matrix E is calculated as;
⎟ ⎟ ⎟ ⎠ ⎞ ⎜ ⎜ ⎜ ⎝ ⎛ − − − − = 13 . 0 78 . 0 78 . 0 13 . 0 78 . 0 78 . 0 5 HAA TTHM Lead Copper Iron EChlorination l DSM = z
In the above matrix il. The resulting matrix (E ) establishes the baseline for
iron, copper and lead deterioration in the distribution system. In order to evaluate the relative impact of chloramination, the relational matrix for chloramination (E ) is obtained in a similar manner as was done for chlorination.
on Chlorinati ation Chlora min ⎟ ⎟ ⎟ ⎠ ⎞ ⎜ ⎜ ⎜ ⎝ ⎛ − − − − − − = 10 . 0 04 . 0 04 . 0 10 . 0 04 . 0 04 . 0 5 min HAA TTHM Lead Copper Iron EChlora ation
The difference in the two matrices (E - E ) gives the relative impact of the change on the distribution system materials (i.e., iron, copper and lead). It is concluded that though the change might benefit iron and copper components of the distribution system, lead components could suffer from increased deterioration.
ation
Chlora min Chlorination
⎟ ⎟ ⎟ ⎠ ⎞ ⎜ ⎜ ⎜ ⎝ ⎛ − − = − 23 . 0 74 . 0 74 . 0 23 . 0 74 . 0 74 . 0 5 min HAA TTHM Lead Copper Iron E
EChlora ation Chlorination
The utility concludes that further studies are warranted to evaluate the impact of the change on lead components of the distribution system.
CONCLUSIONS
Changing drinking water regulations requires water systems to modify their water-sources, treatment processes and/or practices. The distribution system is at the receiving end of these changes. Relating changes in treatment practices to distribution infrastructure integrity is complicated by a number of inter-related processes taking place within the distribution system.
This paper elaborates a hierarchical relational model (HRM) for evaluating the impact of changes in treatment practices on the long-term structural and functional integrity of the distribution infrastructure. The application of proposed HRM is demonstrated with the help of an example. This can be used to identify potential distribution infrastructure problems associated with the changing water treatment practices.
ACKNOWLEDGMENTS
This paper presents results of an on-going research project, which is co-sponsored by the American Water Works Association Research Foundation (AwwaRF) and National Research Council of Canada (NRC). The authors also acknowledge the support of the National Science and Engineering Research Council (NSERC).
REFERENCES
Ashbolt, N.J. (2004). Risk analysis of drinking water microbial contamination versus disinfection by-products (DBPs), Toxicology, 198: 255-262
AWWA. (2000). Water Quality Division Disinfection Systems Committee Report: Disinfection at large and medium-size systems, Journal of American Water Works Association, 92(5): 32-43
Daniel, P.A. (1998). Balancing Multiple Water Quality Objectives, American Water Works Research Foundation, Denver, CO
Imran, S.A., Dietz, J.D., Mutoti, G., Taylor, J.S., Randall, A.A., and Cooper, C.D. (2005). Red water release in drinking water distribution systems, Journal of American Water Works Association, 97(9): 93-102
Pontius, F.W. (2004). Drinking water contaminant regulation -- Where are we heading?, Journal of American Water Works Association, 96(3): 56-69
Pontius, F.W. (2003a). Drinking Water Regulation and Health, Wiley-Interscience, New York Pontius, F.W. (2003b). Update on USEPA's drinking water regulations, Journal of American
Water Works Association, 95(3): 57-68
Roberson, J.A. (2003). Complexities of the new drinking water regulations - Everything you wanted to know but were afraid to ask, Journal of American Water Works Association, 95(3): 48-56
Sadiq, R., Kleiner, Y., and Rajani, B.B. (2004). Aggregative risk analysis for water quality failure in distribution networks, AQUA - Journal of Water Supply: Research & Technology, 53(4): 241-261
Taylor, J.S., Dietz, J.D., Randall, A.A., Hong, S.K., Norris, C.D., Mulford, L.A., Arevalo, J.M., Imran, S., Lepuil, M., Mutoti, I., Tang, J., Xiao, W., Cullen, C., Heaviside, R., Mehta, A., Patel, M., Vasquez, F., and Webb, D. (2005). Effects of Blending on Distribution System Water Quality, American Water Works Research Foundation, Denver, CO