Publisher’s version / Version de l'éditeur:
Vous avez des questions? Nous pouvons vous aider. Pour communiquer directement avec un auteur, consultez la
première page de la revue dans laquelle son article a été publié afin de trouver ses coordonnées. Si vous n’arrivez pas à les repérer, communiquez avec nous à [email protected].
Questions? Contact the NRC Publications Archive team at
[email protected]. If you wish to email the authors directly, please see the first page of the publication for their contact information.
https://publications-cnrc.canada.ca/fra/droits
L’accès à ce site Web et l’utilisation de son contenu sont assujettis aux conditions présentées dans le site
LISEZ CES CONDITIONS ATTENTIVEMENT AVANT D’UTILISER CE SITE WEB.
27th International Congress of the Aeronautical Sciences ICAS 2010 [Proceedings], 2010
READ THESE TERMS AND CONDITIONS CAREFULLY BEFORE USING THIS WEBSITE.
https://nrc-publications.canada.ca/eng/copyright
NRC Publications Archive Record / Notice des Archives des publications du CNRC :
https://nrc-publications.canada.ca/eng/view/object/?id=ba68c400-7ae0-4e4c-a3ea-dc298d3c3d46 https://publications-cnrc.canada.ca/fra/voir/objet/?id=ba68c400-7ae0-4e4c-a3ea-dc298d3c3d46 This publication could be one of several versions: author’s original, accepted manuscript or the publisher’s version. / La version de cette publication peut être l’une des suivantes : la version prépublication de l’auteur, la version acceptée du manuscrit ou la version de l’éditeur.
Access and use of this website and the material on it are subject to the Terms and Conditions set forth at
Aerodynamic performance optimization of a wind tunnel morphing wing model subject to various cruise flow conditions
Mamou, Mahmoud; Mebarki, Youssef; Khalid, Mahmood; Genest, Marc; Coutu, Daniel; Popov, Andrei Vladimir; Sainmont, Corentin; Georges, Thomas; Grigorie, Teodor lucian; Botez, Ruxandra Mihaela; Brailovski, V.; Terriault, Patrick; Paraschivoiu, Ion; Laurendeau, Eric
27TH INTERNATIONAL CONGRESS OF THE AERONAUTICAL SCIENCES
Abstract
A large-scale multi-disciplinary research project, CRIAQ 7.1, was undertaken to investigate a morphing wing concept for aircraft aerodynamic performance improvement over various flow conditions. The collaborators were Ecole de Technologie Supérieure of Montreal (ETS), Ecole Polytechnique of Montreal (EP), Bombardier Aerospace (BA), Thales Avionic Inc. (Thales) and the National Research Council of Canada (NRC). The project was mainly funded by the Consortium for Research and Innovation in Aerospace in Quebec (CRIAQ). The main objective of the morphing concept was to reduce drag by improving the extent of laminar flow on the wing surfaces, by delaying transition toward the trailing edge. The wing consisted of rigid and flexible parts, and smart material alloy actuators. The investigation was based on numerical simulations and wind tunnel tests. The simulations involved the wing-upper surface shape optimization for various cruise flow conditions, the design of the wing and its morphing skin, the design and development of the smart actuators, and the controllers.
Three types of controllers were built, following three approaches. The first controller was based on experimental pressure signal data recorded on the wing morphing skin surface. The second controller was supplied the wing aerodynamic loads (lift L and drag D). In the
third controller, the transition location on the wing, determined by infrared measurements, was used as input. The three controllers’ functionality was demonstrated during bench tests, at ETS (wind off), and in the wind tunnel (wind off and on) at NRC. Their performance and behavior seemed to differ but yielded approximately the same expected wing aerodynamic performance improvement. A 30% reduction in the wing drag was achieved. In the present paper, the three controllers and their operability are discussed briefly, followed by a thorough experimental validation of the controllers and wing shape optimizers. Also, wind tunnel data in terms of pressure signals, wing aerodynamic loads and infrared measurements are analysed for various flow conditions and optimal wing shapes. Emphasis is placed on the effect of the optimized wing shapes on the wing drag reduction. The results are presented in terms of measured and computed pressure coefficient profiles, wing loads (drag and lift), controller performance and optimizer efficiency.
1 Introduction
Aircraft control and lifting surfaces are usually based on a single-point design that limits their optimization to a single flight condition. As aircraft sweep through various flight conditions over their entire flight path, they fly a
AERODYNAMIC PERFORMANCE OPTIMIZATION OF A
WIND TUNNEL MORPHING WING MODEL SUBJECT
TO VARIOUS CRUISE FLOW CONDITIONS
M. Mamou*, Y. Mébarki*, M. Khalid*, M. Genest*, D. Coutu**, A.V. Popov**, C. Sainmont***, T. Georges**, L. Grigorie**, R.M. Botez**, V. Brailovski**,
P. Terriault**, I. Paraschivoiu***, E. Laurendeau****
*National Research Council Canada, Ottawa, Ontario, Canada
**École de Technologie Supérieure, Notre Dame West, Montréal, Québec, Canada ***École Polytechnique de Montréal, Québec, Canada
****Bombardier Aerospace, Dorval, Québec, Canada
substantial fraction of flight-time at off-design conditions, thus with relatively poor or non- optimal aerodynamic performance. These deficiencies could be eliminated by designing wings that can adapt to their optimal aerodynamic performance at any flow condition. The wing adaptation could be performed through surface flow control, wing geometry deformation or both. Surface flow control could be achieved by incorporating some passive or active devices such as, for example, blowing or sucking to energize the boundary layer, or by making use of the Coanda effect or jet flaps. Wing adaptation through structural deformation could be realized by changing the size of the wing chord and span, the wing sweep angle and the camber. This suggests reconfiguring the wing shape during flight while maintaining high aerodynamic performance efficiency, flexible maneuverability and control. However, wing deformation necessitates some additional mechanical devices and avionic hardware to be incorporated in the wing structure. Consequently, the resulting structure must meet and comply with some practical constraints, such as weight, cost, structural feasibility and maintenance requirements.
One approach for deforming the wing structure to reduce drag is to change the thickness and the camber of the wing airfoil section, which is the subject of our present investigation. That is achieved by deforming the upper surface of the wing inward and outward at different actuation points to adapt the wing for various flow conditions or to multi-design points, while maintaining a high aerodynamic efficiency.
It has been well known for decades that a laminar boundary layer induces less drag than a turbulent boundary layer, and hence requires less fuel consumption to deliver sufficient thrust to counteract the viscous drag. However, nature prefers to drive the boundary layer to a turbulent state while leaving some genuine possibilities to delay artificially transition, through active flow surface deformation to favour a stabilizing pressure gradient. Recent advances in smart actuators have allowed researchers to consider morphing wing technology to improve the large
laminar flow run on a wing surface and to morph the wing according to the changes in the flight condition.
More recently, efforts have been focused on investigating and designing actuators for wing skin deformations while reducing the weight penalty, operability, power and cost. Shape memory alloys (SMAs) are good candidates to be used for controlled actuation devices. SMAs change their molecular lattice into a variety structures when the temperature changes. This change is accompanied by a size variation of the SMAs that favour their use as mechanical actuators. They can be manufactured in several forms such as wires, strips and torque tubes [1].
A thorough literature review on the current status of aircraft wing shape morphing and its challenges has been performed [2]. The review focused on recent advances in morphing technologies, conceptual design and prototype fabrication, and also contained an assessment of wing shape morphing performance. The wing shape morphing concept actuators relied mostly on SMAs, piezoelectric and shape memory polymers. To reduce the weight penalties, actuators based on SMA material are the most suitable for use in morphing wing design.
Many theoretical and experimental investigations have been performed to demonstrate the morphing wing technology feasibility and provide proof of concept. The experiments have been conducted either through bench tests, wind tunnel tests or flight tests with a full or reduced scale. Flight tests have been performed for an optimized wing-flap configuration to maximize the laminar flow run over the wing surface [3]. The wing was designed with a morphing flap that could self-adjust for a wide range of wing lift coefficients by optimizing the wing L/D over the entire mission. The flap, which extended from 70% to 100% of the wing chord, was driven by two electrical servo motors. The test data registered low drag achieved by extending the laminar flow region to up to 65% of the wing chord.
Elsewhere, an experimental wind tunnel investigation of a morphing wing optimized using a genetic algorithm has been performed [4]. The algorithm was based on the measured
AERODYNAMIC PERFORMANCE OPTIMIZATION OF A WIND TUNNEL MORPHING WING MODEL SUBJECT TO VARIOUS CRUISE FLOW CONDITIONS
wind tunnel data in terms of loads (lift and drag) using a strain-gauge balance. The morphing concept was applied to maximize the wing lift through a wide range of angles of attack. Wing surface actuation was ensured by a single servo actuator located between two attachment points. The actuators executed a vertical displacement to change the wing camber. Two servo actuators were also used and provided a practical optimized wing shape to control the aerodynamic performance.
In another example of morphing wing applications, a combined theoretical and experimental investigation of the performance of a morphing wing has been conducted [1] using SMAs as actuators. At various subsonic flow conditions, the optimal wing shape was obtained when the lift-to-drag ratio was maximized. The wing airfoil shape optimization was based on a genetic algorithm combined with structural and aerodynamic analyses. Wind tunnel tests confirmed the increase of lift for various flow conditions for the optimized wing shape obtained by activating the SMA actuators wires.
In the current project, which is regarded as the first advanced technology demonstration of its kind in Canada, the Consortium for Research and Innovation in Aerospace in Quebec (CRIAQ), with industries (BA and Thales) granted funds and support to academia (ETS and EP) and NRC to undertake a thorough investigation to design, fabricate, optimize and test a morphing wing in a controlled environment [5-27]. The investigation relied on the development and design of the actuation controllers coupled with enhanced optimizers. The project teams focused on manipulating the aerodynamic boundary layer transition behaviour to improve the drag characteristics of a wing, and hence reduce fuel burn and emissions, which have a strong impact on the environment. The collaborative work involved numerical modeling and conceptual demonstration of the morphing principles on a “live” wing model placed inside the wind tunnel under controlled wind conditions. Certain types of surface-flow-fluctuation interrogating sensors were located at strategic locations across the wing surface. These sensors detected the local
pressure fluctuations that naturally occur inside the laminar or turbulent boundary layers. Those fluctuating signals were transferred to a controller system to determine the transition location while simultaneously driving SMA actuators to adjust and deform continuously the wing skin with the purpose of delaying transition towards the wing trailing edge. The prototype went through various successful phases ranging from open-loop control [9, 18, 19] to closed-loop control [16, 17, 20, 21]. Through those phases, the wing profile, under various flow conditions, was deformed to achieve an optimal shape that delivered the minimum drag.
Other factors for controlling the wing optimization in the wind tunnel were discovered during the course of the project. Those factors led to the design and construction of two additional simplistic and more practical controllers relying on real-time measured wing loads (lift and drag) and real-time detection of the transition location on the wing surface using infrared (IR) measurements [16, 17]. The IR measurements [27] were used at each measured point in the wind tunnel to assess the performance of the morphing wing assembly hardware and the controllers in open- and closed-loops.
In terms of wing aerodynamic performance, depending on the flow conditions, a 30% drag reduction was achieved [5-7], which could result in significant savings in fuel consumption and less greenhouse gas emissions. The morphing wing model, instrumentation, optimization techniques, computational fluid/structure dynamics (CFD/CSD) and wind tunnel data are comprehensively described, discussed and analyzed in the present paper for specific cruise flow conditions.
2 Morphing Wing Model and Concept
The main objective of the current research work is to improve the aerodynamic performance of an experimental aircraft wing that operates at various cruise conditions. The improvement is realized through viscous drag reduction by promoting a large laminar flow run on the upper surface of the wing. To achieve this
aerodynamic ability, regardless of the flow conditions, the wing upper surface is subject to controlled and well-studied deformation (in-flight morphing) to keep the drag at its lowest possible value. In the current application, the wing is equipped with new morphing actuation mechanism hardware with suitably designed controllers.
2.1 Optimization of the Wing Skin Shape
As displayed in Fig. 1, for a given flow condition, the wing shape was deformed inward or outward at two actuation points to yield an optimized shape. A genetic algorithm-based optimization code was used [5, 6]. The wing flow configuration was defined by the Mach number (M), Reynolds number (ReC) based on
the wing chord, angle of attack (α) and front and the aft actuator displacements ( 1 and 2,
respectively). The wing shape was optimized according to the values of M, Re and the lift coefficient (L). The code XFoil was used to compute the aerodynamic performance of the wing. For a given original wing shape, where the value of L is known, the corresponding angle of attack was obtained. The actuator displacement variables 1 and 2 were regarded
as the optimization control variables, with a maximum displacement of 8 mm. As the objective of the optimization process was to reduce the drag by promoting a large laminar flow run over the airfoil upper surface, a fitness function based on the total drag was considered. To this end, 35 optimized airfoil sections were obtained, corresponding to 35 flow conditions defined by the Mach number, which was varied from 0.2 to 0.3 in increments of 0.025, and by the angle of attack, which was varied from -1o to +2o in increments of 0.5o.
Fig. 1: Wing airfoil section optimization.
2.2 Wing Model
A basic laminar supercritical wing model was chosen for the bench tests and as the wind tunnel morphing prototype model. The supercritical airfoil model was designed and manufactured by de Havilland Aircraft of Canada Ltd in 1984 [32], which was later bought by Bombardier Aerospace. The wing model was designed for cruise conditions at a Mach number of 0.75 and a lift coefficient of 0.6. For the present work, the model was tested at an off-design Mach number ranging from 0.2 to 0.3. For these flow conditions, the wing was equipped with a morphing upper surface skin and could be optimized during flight to lower the drag by promoting an extended laminar flow region.
2.2.1 Wing Airfoil Section
The airfoil section of the basic wing model was the WTEA-TE1 airfoil with a trailing edge insert TE1. The thickness to chord ratio was 16%. The wing had a chord length of 0.5 m and a span of 1.12 m (see Fig. 2). As the original wing geometry data were not available, the airfoil section was built from the measured 80 pressure tap locations on the lower and upper surfaces of the wing. The nose of the airfoil could contain some discrepancies from the theoretical airfoil owing to the limited number of pressure taps incorporated around the nose region. The trailing edge of the wing was blunt and had a thickness of 0.5% of the chord.
Fig. 2: de Havilland WTEA-TE1 airfoil profile with measured pressure taps locations (circles) and a close-up view of the trailing edge.
2.2.2 Wing Model: Rigid Part
The wing model consisted of two main parts: a flexible part, which was subject to deformation, and a rigid part supporting the actuation system
WTEA-TE1 airfoil
Trailing edge Flexible skin
Actuators
AERODYNAMIC PERFORMANCE OPTIMIZATION OF A WIND TUNNEL MORPHING WING MODEL SUBJECT TO VARIOUS CRUISE FLOW CONDITIONS
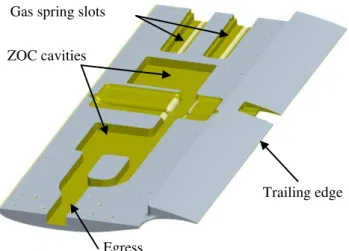
and the flexible part. A layout of the rigid part is displayed in Fig. 3 with various cavities to house the actuator gas springs, pressure-scanning (ZOC) modules, the power supply cables and instrumentations wires (egress). The rigid part, made of aluminum alloy 7075, was designed and fabricated at NRC.
Fig. 3: Rigid part of the wing model and the inner cavities and slots for instrumentations hardware.
2.2.3 Wing Model: Flexible Part
After a thorough design investigation and many bench tests, the wing flexible skin part was manufactured with a laminated composite structure using the Huntsman 8602 Reinfusion low-viscosity (175 cP) epoxy resin system and two types of plies [12-14]. The manufacturing set up is displayed in Fig. 4, where low-modulus unidirectional carbon and 2 × 2 twill woven hybrid carbon/Kevlar are shown. The mold that mimicked the upper surface of the WTEA-TE1 airfoil profile was built from an aluminum alloy. The flexible skin laminate was obtained using vacuum-assisted resin injection and transfer molding. Steel stiffeners were incorporated in the inner surface of the laminate to ensure stiffness and spanwise shape deformation uniformity. This approach does not affect the chordwise flexural behavior of the laminate. The stiffeners were mounted exactly along the actuations lines.
Mounted on the rigid part, the flexible skin was attached rigidly at 1% chord below the wing leading edge, covering the upper surface
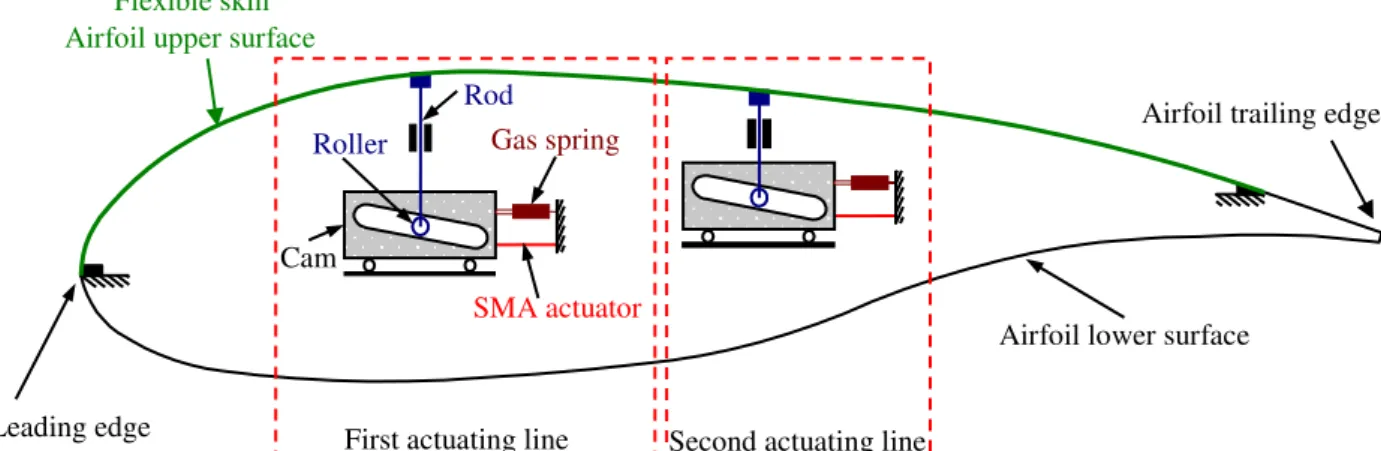
of the wing up to 74% chord where it was attached softly to the rigid structure using a compensation spring (see Fig. 5). Two actuation lines were attached to the wing at 25.3% and 47.6% chord, respectively. The flexible portion of the wing spanned from 3% to 74% chord. The flexible skin deformation was ensured by two SMA wires, as independent actuators, located inside the wing box. The SMA wire contractions and expansions, depending on the temperature, were translated into a vertical displacement up to 8 mm at the actuation points.
Fig. 4: Aluminum mold and flexible extrados manufacturing set up.
Fig. 5: Morphing wing and actuation system assembly.
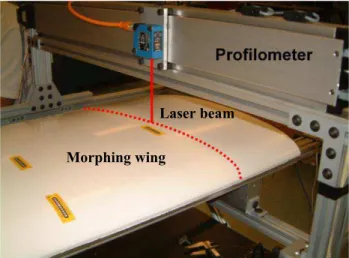
The SMA actuators were driven to deform the flexible wing skin into an optimal shape for a given flow condition under aerodynamic pressure loads. However, without an aeroelasticity study, it is difficult to predict the optimal shape. During bench tests, following CFD optimization results computed in terms of the actuator displacements, the experimental airfoil shapes, measured with a laser beam as shown in Fig. 6, were compared with the predicted shapes with an acceptable level of
Gas spring slots
Egress ZOC cavities
agreement. To take into account the aerodynamic pressure load effect on the skin deformation, an aero-structures analysis was performed to obtain the optimal shapes of the airfoil under wind-on conditions [5-7, 9]. The analysis was based on the XFoil CFD code, which computes the aerodynamic performance, the pressure loads on the airfoil and transition location, coupled with a structured solver (ANSYS) to predict the wing skin deformation subject to the aerodynamic loads, (see Fig. 7). The optimization process was performed iteratively until convergence was reached, where the optimized wing skin deformation corresponded to the actual aerodynamic loads.
Fig. 6: Wind off bench test: laser beam measurement of the optimized morphed flexible skin shapes.
Fig. 7: Finite element model of the active structure.
2.2.4 SMA Actuators and Their Mechanism The wing upper surface deformation was realized with two actuations points. SMA wires were used as actuators [10-12, 14]. They were made of a nickel-titanium alloy, which changes its size (contraction or shrinking) according to its temperature. When an SMA wire is heated through the Joule effect, the atoms in the
crystalline structure lattice realign and force the material to recover its original shape, and hence the change in the resultant length of the wire. This property of changing the wire length is used for actuation purposes [8-17]. With this concept, the SMA wires can execute deflections in the flexible skin by contracting or stretching forces, and can provide an infinite number of shapes and sizes for the flexible skin, thus covering a wide range of cruise conditions.
In the present application, as displayed in Fig. 8, two actuation lines were used, each containing three SMA wires (1.8 m in length each). The SMA wires drove a cam that slid, in the spanwise direction, on a supporting plate. The spanwise translating motion was translated into vertical displacements using rollers and rods. A compression gas spring was also used as a recall for the airfoil to regain its original shape when the SMAs were not powered. When the SMAs wires were heated they contracted causing the cam to move to the right and upward pushing the flexible skin outward. As mentioned above, the heating was realized by supplying a controlled electrical current through the wires. Cooling of the SMA wires causes the cam to execute a reverse motion, pulling the skin inward. The cooling phase was realized by cutting off the electrical current and letting the wires undergo a natural cooling. The cam horizontal displacement was converted into a vertical displacement of the rods at a ratio of 3 to 1. For the optimized airfoil shapes, an approximately 8 mm maximum vertical displa-cement was achieved for the rods, which required a maximum horizontal displacement of 24 mm from the cam. The two actuation lines could be controlled independently through imposing individual displacements ( 1 and 2
ranging from 0 to 8 mm). A calibrated proportional-integral-derivative (PID) controller ensured the stability of the SMA actuator response with a ±0.02 mm precision using a linear potentiometer feedback having ±0.15 mm accuracy on the full 8 mm stroke.
The instrumented morphing wing model is illustrated in Fig. 9, which shows the two actuation lines and their respective gas springs, the flexible skin, the fences, the pressure sensors taps and the controller.
Laser beam Morphing wing
AERODYNAMIC PERFORMANCE OPTIMIZATION OF A WIND TUNNEL MORPHING WING MODEL SUBJECT TO VARIOUS CRUISE FLOW CONDITIONS
Fig. 8: SMA actuation system.
Fig. 9: Morphing wing model, flexible skin, and controller and actuators hardware.
3 Wing Model Instrumentation 3.1 Pressure sensors
Unsteady pressure measurements on the morphing part of the wing (flexible skin) were performed using high sampling rate sensors. Altogether, 32 pressure transducers (16 Kulites
and 16 optical sensors) were incorporated in the flexible skin. To minimize the flow disturbance that might be caused by the pressure tap opening, the Kulites and the optical sensors were installed within a cavity underneath the flexible skin and sensed the surface flow perturbations through minute holes having a
Gas spring Roller
First actuating line
SMA actuator
Rod
Cam
Flexible skin Airfoil upper surface
Leading edge
Airfoil trailing edge
Airfoil lower surface Second actuating line
diameter of 0.5 mm. In order to avoid the effect of possible turbulent wedges occurring on the skin surfaces, the sensors were distributed chordwise at the mid-span of the wing following a V-shape distribution. The angle between the wing mid-line and the sensors rows was 15o, as displayed in Fig. 10. The spacing between the sensors taps was not uniform and was constrained by the inner morphing mechanism hardware.
For complementary wind tunnel data, static pressure measurements were systematically recorded using conventional pressure taps distributed on the rigid part of the wing. There were 42 pressure taps installed on the rigid part; 30 on the lower surface of the wing spanning the whole chord length and 12 on the upper surface covering from 70% of the chord to the trailing edge. The pressure taps were 0.5 mm in diameter and their locations were kept identical to those of the de Havilland model displayed in Fig. 1. Two 2.5-psi ZOC modules having 32 channels each were used and installed inside the wing model cavities. The two ZOCs were connected to the NRC wind tunnel Hyscan system.
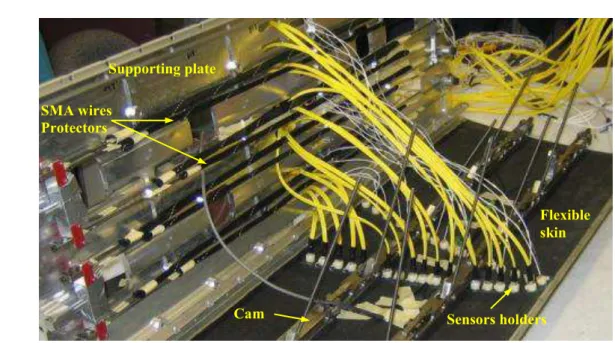
The actual hardware and instrumentation of the morphing wing part assembly is displayed in Fig. 11. The pressure sensors were
incorporated in the flexible skin using cylindrical shape holders, allowing for a small cylindrical cavity between the lower surface of the flexible skin and the inner holes of the holders. The SMA wires, which were fixed to the supporting plate, were wrapped in thermal proctors to avoid any burn damage that might compromise the performance of the sensors. The wire temperatures could reach 120oC. The closed assembly of the flexible skin and the supporting plate is displayed in Fig. 12. The actuator gas springs are clearly visible in the pictures.
Fig. 10: Kulites and optical sensors installation layout on the flexible skin.
Fig. 11: Flexible skin, SMA wires, supporting plate and actuation lines assembly, optical sensors fiber optics (yellow) and Kulite transducers wiring (white).
SMA wires Protectors Flexible skin Cam Supporting plate Sensors holders Optical sensors Kulites sensors x =0 mm x=350 mm L ea din g ed ge
Fig. 12: Flexible skin, the supporting plate assembly, optical sensors fiber optics (yellow) and Kulites transducers wiring (white).
3.2 Wake Rake
A wake rake consisting of 21 total and 4 static pressure taps was mounted at the mid-span of the wing to survey the pressure across the wing wake (Fig. 13). The pressure tubes were uniformly distributed along the rake with a spacing of 1cm. The rake was mounted at 1.1 chords behind the trailing edge of the wing and attached to the tunnel floor. While the wing was pitched, its wake profile was always captured within the rake span. In general, with the actual pressure tube spacing and the distance from the wing trailing edge, between 8 to 12 taps were sufficient to capture the wing wake at all angles of attack. A photograph of the wake rake is presented in Fig. 13. An electronic pressure scanning module (2.5-psi ZOC 33) was used for the wake pressure scanning. The wing drag computed from the pressure rake was obtained by curve fitting the measured points and then integrating using the Matlab program
curve fitting functions. Simpson and trapezoidal integration methods were also considered.
Fig. 13: Pressure wake rake installed behind the trailing edge at the mid-span of the wing.
3.3 Infrared Measurements
Infrared (IR) measurements were performed to determine optically the location of the transition from laminar to turbulent flow over the flexible skin surface. The flexible part of the wing, made of composite material, was coated with a flat black paint. Its measured emissivity, = 0.85, was fairly independent of the viewing angle up to 60° and it was suitable for high-quality infrared measurements. Therefore the useful region used in the IR data was limited to 0.03 < x/c < 0.70 and 0.69 < y/c < 1.46, as outlined in Fig. 14.
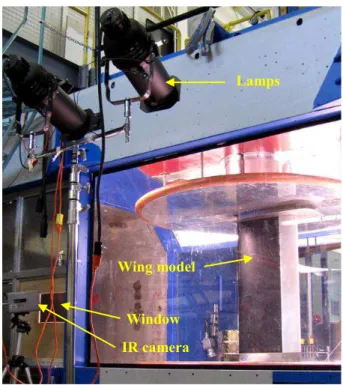
The infrared camera used in the test was a FLIR SC3000 camera equipped with a 240×320 pixel QWIP detector. It operated in the infrared wavelength range of 8-9 m and was cooled down to 70°K to reduce thermal noise. The camera measurements provided a resolution of 0.02°C at a maximum sampling rate of 60 frames/second. It was equipped with its default lens (FOV = 20°×15°), and installed 1.5 m away from the model with an optical axis oriented in the horizontal plane at 30° with respect to the wing surface mid-chord normal. Optical access was provided through a customized window on the side wall of the test
Static tube Total tube
Supporting plate
Gas spring
section opposite the upper surface. A picture of the IR camera setup is shown in Fig. 15.
Although visible, the last 30% of the wing chord (the rigid portion of the wing), made of uncoated aluminum, could not be considered in the IR image analysis owing to the low emissivity of aluminum, which is less than 0.1.
Fig. 14: 2-D Morphing wing model in normalized coordinates. The IR camera was capturing the wing area delineated in red color between 0 < x/c < 0.7 and 0.69 <
y/c < 1.46.
The principle of transition detection using IR is based on the difference in convective heat transfer between the air flow over the model surface and the model itself. It is well known that heat transfer is considerably affected by the nature of the boundary layer, whether it is laminar or turbulent. A turbulent boundary layer provides a significant enhancement of the heat exchange, compared to that of a laminar flow regime. With a significant temperature difference between the main flow and the model, regions of high heat transfer (turbulent flow) alter the local surface temperature more rapidly than regions of low heat transfer (laminar flow).
In wind tunnel testing, artificial temperature differences between the air flow and model can be introduced either by controlling the model temperature (heating) or by the air temperature (cooling). In the present
study, different means of increasing the model temperature were used; the most efficient one was external heating of the model using scene projectors (see Fig. 15). This approach allowed insitu visualization and acquisition of contrasted infrared images, while the model geometry was changed (during an open- or closed-loop control).
The live display of the flow behavior on the flexible skin surface provided by the infrared camera was used to provide an additional control parameter for closed-loop airfoil morphing control, as well as to assess the presence of contamination and turbulent wedges. Turbulent wedges are localized spots of triangular shaped turbulent flow in a laminar region. These wedges can be triggered by model imperfections or dust contamination under inspection near the leading edge. When the level of contamination was estimated unacceptable or likely to affect the wake drag measurements, the test was interrupted and the model was carefully cleaned.
Fig. 15: Infrared camera hardware and setup in the wind tunnel test section.
3.4 SMA Actuator Controllers
For the morphing actuation system control, up to four controllers were designed and
Lamps IR camera Wing model Window x/c y/c
AERODYNAMIC PERFORMANCE OPTIMIZATION OF A WIND TUNNEL MORPHING WING MODEL SUBJECT TO VARIOUS CRUISE FLOW CONDITIONS
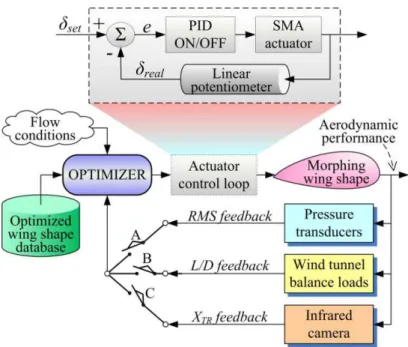
developed. To control the actuation system to produce optimized wing shapes, two approaches were adopted. The first involved simulations and hardware in the loop, and was performed for open-loop control. CFD and CSD simulation results of the airfoil shapes and actuator displacements for an optimal shape, according to the flow conditions, were used as input for the integrated controller, as displayed in Fig. 16 (with open connectors A, B and C), which provided the right current intensity for the SMA wires to execute the prescribed actuator displacements. The imposed predicted optimized displacement was intended to yield an optimized wing shape that produced a lower drag for a particular flow condition and angle of attack. This approach was validated by parallel measurement using the infrared camera. The predicted CFD-CSD results for the wing drag and transition locations were in good agreement with the measured data and the infrared flow visualization.
The second approach involved hardware in-the-loop and optimizer simulation. This approach was applied for closed-loop control to provide an automated and self wing adaptation to any flow condition. As displayed in Fig. 16, three controllers were designed and developed; they are illustrated on the same graph (with closed connectors A, B or C). Here, these controllers did not rely on the CFD-CSD database, but on the measured data as input.
The first controller’s (A, or RMS-Controller) optimization task was based on the pressure signals collected on the flexible skin. The transition location is characterized by the location of a sharp peak of the pressure signal RMS profiles. When the flow undergoes a transitional regime, the pressure fluctuations become intensive and can be easily detected by the pressure sensors recording data at a high sampling rate (15 kHz in the present work). The location of the RMS peak location was linked to the actuator displacements through the controllers and the optimizer. The optimizer has
the task to determine the best combination of the two actuator displacements to delay transition towards the trailing edge.
The second controller (B, or L/D-Controller), was based on the wind tunnel balance measured loads (drag and lift), for which the ratio L/D was taken as the objective function of the optimizer, linked to the two actuator displacements. The wing is supposed to achieve its optimized shape when the ratio L/D is maximized. This corresponded to situations where the wing drag is minimal or when the transition location reaches its downstream limit. This controller appears straightforward as it relies directly on the live measured load.
The third controller (C, or IR-Controller) used the infrared measured transition location as input. Combined with an optimizer, the controller tried to find the best compromise between the actuator displacements and the farthest-downstream transition location. This controller, although relying on visual readings of the transition location, appeared to perform well within an acceptable period of time.
Overall, the SMA actuators were found to perform well in controlling the morphing skin, but they had some serious disadvantages. First, they required a continuous power supply with substantial electrical energy. Second, they operated at a high temperature, up to 120oC, which can affect the instrumentation tubing and wires. To keep the temperature at an acceptable lower level, the wing model was designed to take into account the SMA heating effects, where natural and forced ventilation could be applied. After each test, the model was opened and examined for any burning of the hardware and instrumentation wiring and tubing. Fortunately, only the SMA thermal protectors suffered slightly from burning. The thermal protectors might have contributed to the slower response of the SMA during the cooling, as the wires were not directly exposed to ventilation.
Fig. 16: A schematic diagram of the open- and closed-loop controllers.
4 Wind Tunnel Facility
All the tests for the CRIAQ 7.1 project were performed at the NRC-IAR 2×3 m2 wind tunnel, which is a world-class facility for low-speed aerodynamics tests. It has been used extensively by industry, academia, and the government of Canada for research and development in steady and unsteady aircraft aerodynamics, surface/marine vehicle aerodynamics/hydrody-namics and bluff-body aerodyaerodynamics/hydrody-namics. The wind tunnel provides enhanced capabilities for flow measurement and visualizations. Advanced integrated data acquisition and control systems complement the aerodynamic capabilities of the facility and can be easily tailored to each customer's test requirements. A picture of the overall wind tunnel facility is displayed in Fig. 17. The tunnel is a closed-circuit operating at atmospheric boundary conditions. The facility is equipped with a cooling/heating system to control the air flow temperature, which is suitable for infrared measurements.
The wind tunnel test section is 4.5 m long with a 1.93×2.74 m2 cross-section. The corners contain fillets tilted at 45o at a height of 35.6 cm. The cross-section area measures 5.04 m2. The tunnel test section follows a conical shape at a small taper (3.3 mm/m) that
compensates for walls boundary layer growth in order to maintain zero static-pressure gradient. Turntables were installed on the tunnel roof and floor. The maximum turbulence level in the tunnel is 0.14%. The floor turntable is linked to the tunnel balance mounted underneath the floor. The balance provides the three force and three moment components at 6 Hz. The air inside the tunnel is driven by a 2m-diameter four-blade fan at a fixed pitch angle. The speed is controlled by the power supply. The maximum air speed that can be achieved is ~140 m/s for an empty tunnel. For the current application, the model was tested up to M = 0.3 (~ 100 m/s). The temperature was varied from 15oC to 30oC. Most of the tests were performed around 24oC.
Fig. 17: A scaled model of the overall view of the NRC-IAR 2×3 m2 wind tunnel facility.
Fan
AERODYNAMIC PERFORMANCE OPTIMIZATION OF A WIND TUNNEL MORPHING WING MODEL SUBJECT TO VARIOUS CRUISE FLOW CONDITIONS
5 Wing Model and Wind Tunnel Set Up
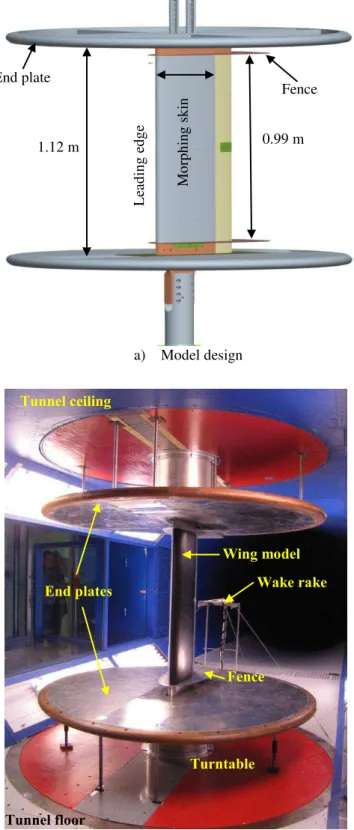
The morphing wing was a two-dimensional model. To realize two-dimensional flows in the wind tunnel, the wing model was installed vertically in the tunnel between two large end plates having a diameter of 1.83 m each, as shown in Fig. 18. To enhance flow two-dimensionality and reduce the end plates wall effects, two fences were incorporated in the model near the end plates. The gap between the end plates and the fences was 0.06 m. The thickness of the end plate was 0.03 m. The fence shapes were represented by a half ellipse with a blunt trailing edge. The fences protruded 0.035 m at the wing leading edge and 0.17 m at the wing trailing edge. The wind model pedestal was mounted directly on the tunnel balance in a cantilever position without any mechanical link to the large end plates. Therefore, only the aerodynamic loads from the wing and its fences were transferred to the balance. To avoid any mechanical fouling, a small gap between the wing ends and the plates was left. The angle of attack of the wing was changed by rotating the turntable including the large end plate. For measuring the wing drag at the mid-span of the wing, a wake pressure rake was installed behind the wing trailing edge. The rake was mounted on two metal struts and secured by two thin cables attached to the tunnel floor to avoid serious vibration and buffeting. All the power supply cables and sensors wiring were shrouded below the lower end plate. For flow uniformity and symmetry, a dummy shroud was added on the top of the upper plate.
5.1 Wind Tunnel Flow Conditions
The tests were performed at various flow conditions and angles of attack. The Mach number was varied from 0.2 to 0.3 with an increment of 0.025. The wing pitch angle was varied from -1o to +2o with an increment of 0.5o. With the wind tunnel set up as displayed in Fig. 18, the aerodynamic performance corrections for solid and wake blockage effects were not obvious. For ease, the test section calibration was performed with the actual set up without the wing model. The calibration was obtained by measuring the total and static pressures, at
the model location between the two end plates, for a Mach number sweep from 0.15 to 0.3.
a) Model design
b) Model set up in the wind tunnel
Fig. 18: Model design and set up in the wind tunnel test section
Afterwards, 2D model corrections [34] were performed by considering the wing solid and
1.12 m 0.99 m End plate Fence L ea din g ed ge Mo rp hin g sk in End plates Wing model Wake rake Fence Turntable Tunnel ceiling Tunnel floor
wake blockage effects. As the wing optimized shapes were computed for the design Mach number values, a reverse correction process was performed in such a way that the corrected measured data would correspond to the design values.
5.2 Test and Procedures
For each flow condition and wing pitch angle, a tare run with wind off was performed. The wind speed was adjusted to the desired value. A measurement point was taken after the temperature had settled to a uniform value. Then one of the SMA controllers was activated to bring the wing to its optimal shape in open- or closed-loop control, and another measurement point was taken. At each measurement point, the recorded data were the unsteady pressure signals from the Kulite and optical sensors sampled at 15kHz, the mean static pressure from the pressure taps, the wing loads (drag, lift and pitching moment), and mean values of the wake rake total and static pressures. The SMA controllers in the closed-loop control received live data from the pressure sensors and balance loads.
6 Results and Discussion
The results of the morphing wing model are presented in terms of comparisons between CFD and wind tunnel test data, infrared measurements of the transition locations and controller performances.
6.1 Wind Tunnel Data Analysis
A large number of runs were performed for various flow conditions and wing pitch angles. To give an overview of the wind tunnel results, a few cases are considered here.
6.1.1 Effect of Morphing on Wing Pressures and the Lift and Drag Coefficients
To illustrate the effect of wing morphing on the surface pressure distribution and the measured lift and drag coefficients, a comparison of the wind tunnel results is discussed here.
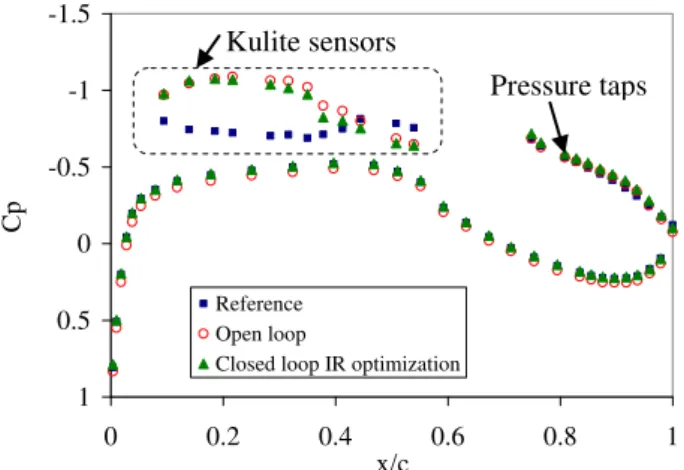
Figure 19 displays the mean pressure coefficient distribution at the mid-span
cross-section of the wing for the reference airfoil shape and the morphed shape that was obtained with the open-loop and closed-loop controllers based on the transition location obtained using infrared measurements. The pressure coefficients were measured by the Kulites transducers (the first 12 points on the suction side), and the remaining pressures were measured using static pressure ports located on the rigid part of the wing. For the non-optimized wing shape, there was a small suction on the upper surface. The optimized shapes exhibited higher suctions with approximately the same pressure distribution for the two optimized shapes (open- and closed-loop control).
Fig. 19: Mean surface pressure coefficients measured by Kulites and static pressure taps: M = 0.3, α = 2° and
ReC = 3.3×10⁶.
Figure 20 displays the wake rake pressure coefficient profile measured for the same flow conditions and Fig. 21 shows a close-up view of the total pressure coefficients in the wake region. The four static pressure ports (measuring Cp = -0.154), visible in Fig. 20, were used for the wake computation. As the reference static-pressure tube of the wake rake ZOC module was placed at the wing model location (between the two end pates), the total pressure coefficient was about 0.85 rather than 1. As indicated by the wake total pressure profile for these configurations (especially Fig. 21), the wing optimization caused a substantial drag reduction of about 20%, as summarized in Table 1. The lift coefficient also increased by 11% to 14%, depending on the optimization method. Therefore, to keep the same lift coefficient, a reduction of about 1° in the angle
-1.5 -1 -0.5 0 0.5 1 0 0.2 0.4 0.6 0.8 1 x/c Cp Reference Open loop
Closed loop IR optimization
Kulite sensors
AERODYNAMIC PERFORMANCE OPTIMIZATION OF A WIND TUNNEL MORPHING WING MODEL SUBJECT TO VARIOUS CRUISE FLOW CONDITIONS
of attack was required. The discrepancy between the measured balance and wake drags, shown in Table 1, was due to the combined influence of the wing tip effects and the presence of the end plates and the fences, which all contributed to the balance drag, but not to the wake drag. For that reason, the wake drag data were judged to be more reliable.
Fig. 20: Wake rake mean pressure coefficients: M = 0.3, α = 2° and ReC = 3.3×10⁶. Overall view of the pressure
rake profile.
Fig. 21: Wake rake mean pressure coefficients: M = 0.3, α = 2° and ReC = 3.3×10⁶. Close-up view of the pressure
rake profile.
Reference Open-loop (MDO) Closed-loop (IR) L (balance) 0.4882 0.5571 0.5433 D (balance) 0.0366 0.0373 0.0379 D (wake rake) 0.0091 0.0071 0.0074 XTR/c (%) 21 47 48
Table 1: Aerodynamic loads for M = 0.3, α = 2° and
ReC = 3.3×10⁶.
6.2 Open- and Closed-Loop Controllers Performances
The results in terms of wing aerodynamic performance improvement owing to the morphing wing shape are discussed for particular wind tunnel runs. Both open-loop and closed-loop controls of the morphing wing are considered.
6.2.1 Morphing Wing Open-Loop Control The open-loop control relied on already optimized airfoil shapes obtained through the multi-disciplinary optimization method (MDO) using CFD, CSD and genetic algorithm (GA). This open-loop control was a direct command to the SMA actuators with one set of input for the actuators displacements ( 1and 2). In this case,
the open-loop could be referred to as a controller with simulation (MDO) in the open-loop.
The open-loop optimization airfoil shape was based on CFD, CSD and GA [5-7]. These numerical simulations were obtained at given Mach numbers to determine the optimized airfoil profile and angle of attack that would provide, at constant lift, the greatest extent of a laminar boundary layer and hence minimum viscous drag.
To illustrate the effect of wing shape on the boundary layer transition, IR results are shown in Fig. 22 at a constant flow condition: M = 0.3 and = 2°, for the reference wing (without actuation) and the morphed wing. The transition was delayed from 22% chord (reference wing) to 51% chord (actuation with the maximum 8 mm stroke). Another two examples of open-loop optimization are shown in Fig. 23 for M = 0.25 and = 2°, where the transition location was delayed downstream from 22% to 53% chord, and in Fig. 24, where two IR results were obtained at a constant lift coefficient (L), and the transition location moved from 22% to 58% chord.
-0.4 -0.2 0 0.2 0.4 0.6 0.8 1 -0.4 -0.2 0 0.2 0.4 Cp Reference Open loop Closed loop IR 0.65 0.75 0.85 -0.11 -0.06 -0.01 0.04 Cp Reference Open loop Closed loop IR Static pressure Total pressure y/c y/c
a) b)
Fig. 22: Effect of wing morphing on transition location at M = 0.3 and constant = 2°: a) reference wing, b) morphed wing with actuators strokes 1 = 2 = 8 mm.
a) b)
Fig. 23: Effect of wing morphing on transition location at M = 0.25 and constant = 2°: a) reference wing, b) morphed wing with actuators strokes 1 = 6.00 mm and 2 = 7.74 mm.
a) b)
Fig. 24: Effect of wing morphing on transition location at constant CL obtained at M = 0.20: a) reference wing at = 2°, b) optimized wing at = 1°, actuators strokes 1 = 5.61 mm and 2 = 7.60 mm.
AERODYNAMIC PERFORMANCE OPTIMIZATION OF A WIND TUNNEL MORPHING WING MODEL SUBJECT TO VARIOUS CRUISE FLOW CONDITIONS
6.2.2 Morphing Wing Closed-Loop Controllers Unlike the open-loop cases, the angle of attack was not modified during the closed-loop control in order to maintain constant lift coefficient. In all cases, the morphed wing lift coefficient was usually slightly larger than that of the reference airfoil, which could be translated into up to 1o of difference in the angle of attack. The selected angle of attack was that of the reference wing configuration. Before each closed-loop control test, the wing shape was brought back to the initial reference shape.
The first closed-loop controller to be discussed is the one fed with the real-time Kulite pressure signals collected on the flexible skin surface. The most critical identifier of the transition location, while using the pressure signals, is the RMS of the pressure fluctuations. The transitional regime is usually characterized by high RMS pressure fluctuations. The live infrared measurements were used to assess the performance of the Kulite sensors for transition detection. The Kulite sensor RMS signals (peak of the RMS profile) were used to modify the profile shape to delay the peak (transition) towards the trailing edge. For this purpose, the three RMS-controllers were considered [20]: a PID-switch, Fuzzy control and real-time optimization. For each method, live experimental data were displayed, as shown in Fig. 25, including the predicted and the measured pressure coefficients on the flexible skin, the flexible skin shape and the real-time RMS of the pressure coefficient. Also, to locate transition, the theoretical values of the perturbations amplification rate are shown for the reference and the optimized wings. Figure 25b shows the real-time actuators stroke positions; the lower plateaus represent the wing shape in its reference state ( 1 = 2 = 0 mm) and
the upper plateaus refer to the morphed optimized wing shape ( 1 = 4.29 mm, 2 = 7.07
mm). The increasing displacement curves correspond to the heating phase of the SMA and the decreasing ones refer to the cooling phase.
An example of closed-loop control at M = 0.3 and = 0.5° using the three sub-controlers is given in Fig. 26b-d, which can be compared with the open-loop control in Fig.
26a. The location of the transition XTR/c is given for each case in the figure caption. The solutions found by the closed-loop iterations agreed well with the open-loop solution. At higher air speeds, more contamination (dust owing to tunnel vibration) appeared, as shown by the increasing number of turbulent wedges in the images displayed in Fig. 26.
(a)
(b)
Fig. 25: a) Live display of the pressure coefficients (CP),
perturbation amplification parameter (N) and pressure coefficient RMS, b) actuator displacements, for M = 0.2 and α = 0o. 50 100 150 200 250 300 350 -1 0 1 2 3 4 5 6 7 8 0 Time [s] Disp lacem en ts dY1 , d Y2 (v ) [m m ] =1°, Mach=0.2 act #1 desired act #1 obtained act #2 desired act #2 obtained 400 70 1 2 1 an d 2 [mm] 1 2
a) b)
c) d)
Fig. 26: RMS closed-loop control performance at M = 0.3 and = 0.5°: a) open-loop control: XTR/c = 57%, b) Closed-loop
control (PID): XTR/c = 56%, c) Closed-loop control (Fuzzy): XTR/c = 56%, d) Closed-loop control (real-time):
XTR/c = 58%.
The second method was based on the real-time optimization of the balance signal L/D. The idea was in this case to find the optimum (lift, drag) polar by maximizing the L/D ratio at a given flow condition. The third method was real-time optimization of the transition location based on the infrared data, instead of the Kulite pressure measurements.
Other examples of closed-loop optima-zations (L/D and IR) are shown in Fig. 27 for
the same flow condition, and compared with the reference case (a) and open-loop case (b). In general, the closed-loop optimizations provided a similar extent of laminarity as the open-loop control (within +/- 1%). This is an excellent result since the closed-loop optimization is intended to be used in real aircraft instead of the open-loop control. However, a side-effect of closed-loop optimizations is that the wing shape was modified at a constant angle of attack, thus
Turbulent wedges
AERODYNAMIC PERFORMANCE OPTIMIZATION OF A WIND TUNNEL MORPHING WING MODEL SUBJECT TO VARIOUS CRUISE FLOW CONDITIONS
changing the pressure distribution and hence the lift coefficient. Keeping the lift constant, as for the open-loop control, seems quite critical for real flight applications. The open-loop control has the advantage of not requiring the use of detectors or sensors in the model.
The L/D controller and the optimizer are displayed in Fig. 28 [16]. The optimizer was robustly designed to achieve convergence (optimized wage shape) within a reasonable period of time. The wind tunnel data (wing loads) were provided live at 2Hz to the controller. However, the SMA actuator responses controlled the overall time response
as they required much time to cool. At each iteration (data point), based on the previous recorded measured data, the optimizer had the task to find the optimal actuator displacements to maximize the L/D. The searching path is displayed in Fig. 28b, and resembles a polygon searching path. The optimizer tried to minimize the radius of the polygon until it reached a small prescribed value, at which the whole system was deemed to be converged. Overall, it took about 5 minutes to achieve the convergence state.
a) b)
c) d)
Fig. 27: Effect of closed-loop optimization on transition location at M = 0.3 and = 0.5°: a) reference wing (no actuation):
XTR/c = 25%, b) open-loop control: XTR/c = 57%, c) L/D closed-loop control: XTR/c = 57%, d) IR closed-loop control:
Fig. 28: Real-time closed-loop control (a) and optimizer (b) results based on the balance loads (L and D) for M = 0.2 and α = 0.5o
.
Figure 29 : Real-time closed-loop control and optimizer results (optimizer searching path, histories of L, D, transition location and actuators strokes) for M = 0.2 and α = 0.5o: (a-b) L/D optimizer (c-d) IR-optimizer.
AERODYNAMIC PERFORMANCE OPTIMIZATION OF A WIND TUNNEL MORPHING WING MODEL SUBJECT TO VARIOUS CRUISE FLOW CONDITIONS
For the real-time L/D-closed-loop and IR-loop controllers, the results are displayed in Fig. 29 for M = 0.2 and α = 0.5o. In Fig. 29a-b,
the optimizer is based on the measured balance load data, where the time history of the optimization path, the actuators strokes and the loads are displayed. In Fig. 29c-d, the optimizer is based on the IR measurements, which gives the location of the transition on the flexible skin, in real-time. Similarly, the time-history of the actuator strokes and the transition location are displayed. As depicted in Fig. 29, the closed-loop optimized shape using the transition point location as a feedback appears to allow up to 1% chord of laminarity extension over the wing compared to the L/D feedback optimizer. For the same flow conditions, the two L/D-closed-loop and IR-closed-L/D-closed-loop controllers yielded approximately the same wing aerodynamic performance, with slightly different actuators strokes.
6.3 Comparison Between Simulations and Wind Tunnel Measurements
An Euler solver coupled with a viscous boundary layer module was used for flow simulations past the wing model as mounted in the wind tunnel test section. In addition, for quick design and optimization of the wing shapes for various flow conditions, the XFoil CFD code coupled with the ANSYS structured solver was used.
The CFD results were used in the controller described above for the open-loop optimization. They also served as the initial data for the three closed-loop controllers. Figure 30 presents the pressure coefficient profile for the reference wing (Fig. 30a) and the optimized morphed wing (Fig. 30b). Overall, a good agreement between CFD (with the XFoil code)
and the experimental data was obtained for the pressure coefficients and the transition locations. A small discrepancy was noticed, which could be attributed to the nature of the flow solver, which uses the panel method with a boundary layer correction approach. It also might be due to the rigid wing structure deformation due to the forces of the gas springs and the SMA actuators. Figure 31 shows the L-α curve and the drag polar. The CFD results were taken at the middle span of the wing. The agreement with the measured data was reasonable. For this situation, the wing was optimized for low angles of attack, with the optimized shape obtained for M = 0.275, which could be altered by the aerodynamic forces below and above the optimized pitch angle. Also, in the experiment, the loads of the wing fences and the effect of the end plates were transferred to the balance, which made it difficult to perform an accurate comparison. Figure 32 displays the gain in the wing drag when the wing was morphing from the reference shape to the optimized one. The results are illustrated in terms of the transition location and the drag reduction. From Fig. 32, it appears that the multi-disciplinary approach was efficient as it predicted the largest laminar run and the lowest wing drag.
7 Optical Sensor Measurements
Throughout this paper, the authors did not discuss the performance of the optical sensors that were used for transition detection on the flexible wing skin. Preliminary optical sensor results in static and dynamic mode tests [29-31] revealed their inability to deal with transitional flows and high pressure fluctuations, thus their data were not included in the analyses.
(a)
(b)
Fig. 30: Pressure coefficient distribution and transition location for M = 0.25 and α = 2o, a) reference wing, b) morphed
optimized wing. -1.5 -1 -0.5 0 0.5 1 0 0.1 0.2 0.3 0.4 0.5 0.6 0.7 0.8 0.9 1 Cp Flow conditions M = 0.250 ReC= 2.8 106 L = 0.5 Transition location (CFD)
Transition location(EXP)
Infrared measurement Transition location x/c -1.5 -1 -0.5 0 0.5 1 0 0.1 0.2 0.3 0.4 0.5 0.6 0.7 0.8 0.9 1 Cp Flow conditions M = 0.250 ReC= 2.8 106 L = 0.46 Transition location (CFD) Transition location (EXP)
Infrared measurement
x/c
Transition location
×
AERODYNAMIC PERFORMANCE OPTIMIZATION OF A WIND TUNNEL MORPHING WING MODEL SUBJECT TO VARIOUS CRUISE FLOW CONDITIONS
Fig. 31: Wing load coefficients: a) lift coefficient L versus α, b) wing polar L versus D for M = 0.275. 1 = 4.88 mm and 2 = 6.63 mm.
Fig. 32: Wing load coefficients: a) lift coefficient L versus α, b) wing polar L versus D for M = 0.275.
8 Conclusions
Multi-disciplinary research was performed to assess the performance of a morphing wing in drag reduction, by delaying the location of transition from laminar to turbulent flows towards the trailing edge. The morphing wing shapes, for any cruise condition, were obtained using SMA actuators and well-designed controllers. Open-loop and closed-loop controllers were tested with success in the wind tunnel.
Three types of controllers equipped with various optimizers were considered. The first controller relied upon the RMS pressure fluctuations collected from the flexible skin.
The tasks of the controller were to locate the RMS pressure fluctuations peak (transition location) and move it towards the trailing edge. The second controller used the model balance loads as feedback for the optimizer. The optimizer target was to find the optimum actuator strokes to maximize the wing lift to the drag ratio (L/D). The third controller considered the transition location captured with an infrared camera as a feedback. Similar to the RMS controller, the optimizer task was to delay the transition location to the farthest location from the leading edge.
Computational fluid dynamics was considered for the morphing wing shape design
-0.4 -0.2 0.0 0.2 0.4 0.6 0.8 1.0 -6 -4 -2 0 2 4 6 Experiment Numerical L α -0.4 -0.2 0.0 0.2 0.4 0.6 0.8 1.0 0 0.002 0.004 0.006 0.008 0.01 0.012 Experiment (wake) Numerical D L
for various flow conditions and angles of attack. The CFD results served as command data for the open-loop controllers and as initial data for the closed-loop controllers. Overall, good agreement was obtained between the CFD and the measured data in terms of drag improvement. The wing drag was reduced by at least 30% by promoting laminar flow on the wing flexible skin. This drag reduction for an aircraft can be translated directly into a substantial reduction in fuel consumption and emissions.
Acknowledgements
The authors would like to thank the NRC Design and Fabrication Services (DFS), and wind tunnel staff for their full support and help with the CRIAQ 7.1 project. Special thanks go to Mr. B. Jahraus (Instrumentation Technologist) who played a key role in model instrumentation and providing live data to the model controllers. The authors acknowledge the contribution of C. Fischer, S. Bérubé and J.S. Ratelle in the design and fabrication of the morphing wing part, and the contribution of E. Morellon in the experiment. The authors also express their sincere appreciation to the Consortium for Research and Innovation in Aerospace in Quebec (CRIAQ), the Natural Sciences and Engineering Research Council of Canada (NSERC), Bombardier Aerospace, Thales Avionics and the Institute for Aerospace Research (IAR) for their financial support. The authors would like to thank sincerely Dr. P. Molaret from Thales Avionic who provided guidance and constructive criticism which had a strong impact on completing the project within the allotted time.
References
[1] Strelec JK, Lagoudas DC, Khan MA and Yen J. Design and implementation of a shape memory alloy actuated reconfigurable airfoil, Journal of Intelligent
Material Systems and Structures, Vol. 14, No. 4-5, pp
257-273, 2003.
[2] Sofla AYN, Meguid SA, Tan KT and Yeo WK. Shape morphing of aircraft wing: Status and challenges, Journal of Materials and Design, Vol. 31, pp 1284–1292, 2010.
[3] Hetrick J, Osborn R, Kota S, Flick P and Paul D. Flight testing of mission adaptive compliant wing,
48th AIAA/ASME/ASCE/AHS/ASC Structures,
Structural Dynamics, and Materials Conference,
23-26 April, Honolulu, Hawaii, 2007.
[4] Boria F, Stanford B, Bowman S and Ifju P. Evolutionary optimization of a morphing wing with wind-tunnel hardware in the loop, AIAA Journal Vol. 47, No. 2, pp 399-409, 2009.
[5] Sainmont C, Paraschivoiu I and Coutu D. Multidisciplinary approach for the optimization of a laminar airfoil equipped with a morphing upper surface. Proceedings of the NATO AVT-168
Symposium on Morphing Vehicle, Evora (Portugal),
2009.
[6] Sainmont C, Paraschivoiu I, Coutu D, Brailovski V, Laurendeau E, Mamou M, Mebarki Y and Khalid M. Boundary layer behaviour on a morphing airfoil: Simulation and wind tunnel tests. Proceedings of the
CASI Aero 2009 Symposium, Kanata (Ontario,
Canada), 2009.
[7] Sainmont C. Optimisation d'une aile d'avion à profil adaptable : Etude numérique et expérimentale.
Mémoire de maîtrise en génie mécanique, Ecole
polytechnique de Montréal, 2009.
[8] Coutu D, Brailovski V, Terriault P. Promising benefits of an active-extrados morphing laminar wing. Journal of Aircraft, Vol. 46, No. 2, pp 730-731, 2009.
[9] Coutu D, Brailovski V, Terriault P, Mamou M, Mébarki, Y. Coupled Aero-structural Model for Morphing Laminar Wing Optimization in Wind-Tunnel. Submitted in the Journal of Aircraft, December 2009.
[10] Georges T, Brailovski V, Morellon E, Coutu D, Terriault P. Design of shape memory alloy actuators for morphing laminar wing with flexible extrados.
ASME Journal of Mechanical Design, Vol. 131, No.
9, pp 091006-1 – 091006-9, September, 2009. [11] Georges T, Brailovski V, Morellon E, Coutu D,
Terriault P. Design of shape memory alloy actuators for morphing laminar wing with flexible extrados.
ASME Conference on Smart Material, Adaptive Structures and Intelligent Systems, Oxnard, Ca,
USA, 2009.
[12] Brailovski V, Terriault P, Coutu D, Georges T., Morellon M, Fischer C, Bérubé S. Morphing laminar wing with flexible extrados powered by shape memory alloy actuators. ASME Conference on Smart
Material, Adaptive Structures and Intelligent
Systems, Ellicot City, Maryland, USA, 2009.
[13] Coutu D, Brailovski V, Terriault P. Optimized design of an active structure for an experimental morphing laminar wing. Accepted for publication in
the Aerospace and Science Technology Journal,
January 2010.
[14] εorellon E, Développement d’actionneurs en alliage à mémoire de forme pour un prototype d’aile d’avion adaptative. Mémoire de maîtrise en génie
mécanique. École de technologie supérieure,
Montréal, QC, Canada, 2010, pp. 130, 2010.
[15] Coutu D, Conception et exploitation d’une structure active pour une aile laminaire adaptative expérimentale. Thèse de doctorat en génie
mécanique. École de Technologie Supérieure,
Montréal, QC, Canada, 2010.
[16] Coutu D, Brailovski V, Terriault P, Mamou M, Laurendeau E. Real-time optimization of a research morphing laminar wing in a wind tunnel. ASME