Publisher’s version / Version de l'éditeur:
Vous avez des questions? Nous pouvons vous aider. Pour communiquer directement avec un auteur, consultez la première page de la revue dans laquelle son article a été publié afin de trouver ses coordonnées. Si vous n’arrivez pas à les repérer, communiquez avec nous à [email protected].
Questions? Contact the NRC Publications Archive team at
[email protected]. If you wish to email the authors directly, please see the first page of the publication for their contact information.
https://publications-cnrc.canada.ca/fra/droits
L’accès à ce site Web et l’utilisation de son contenu sont assujettis aux conditions présentées dans le site LISEZ CES CONDITIONS ATTENTIVEMENT AVANT D’UTILISER CE SITE WEB.
INTERFLAM 2007, 11th International Conference on Fire Science and
Engineering [Proceedings], pp. 1139-1147, 2007-09-03
READ THESE TERMS AND CONDITIONS CAREFULLY BEFORE USING THIS WEBSITE.
https://nrc-publications.canada.ca/eng/copyright
NRC Publications Archive Record / Notice des Archives des publications du CNRC : https://nrc-publications.canada.ca/eng/view/object/?id=9326b72e-9c0f-4378-ae92-91887af8b524 https://publications-cnrc.canada.ca/fra/voir/objet/?id=9326b72e-9c0f-4378-ae92-91887af8b524
NRC Publications Archive
Archives des publications du CNRC
This publication could be one of several versions: author’s original, accepted manuscript or the publisher’s version. / La version de cette publication peut être l’une des suivantes : la version prépublication de l’auteur, la version acceptée du manuscrit ou la version de l’éditeur.
Access and use of this website and the material on it are subject to the Terms and Conditions set forth at
The Use of fire statistics in guiding research and code development
http://irc.nrc-cnrc.gc.ca
T h e u s e o f f i r e s t a t i s t i c s i n g u i d i n g r e s e a r c h
a n d c o d e d e v e l o p m e n t
N R C C - 4 9 2 4 3
T h o m a s , R .
A version of this document is published in / Une version de ce document se trouve dans: Interflam 2007, 11th International Conference on Fire Science and Engineering, London, UK., Sept. 3-5, 2007, pp. 1139-1147
The material in this document is covered by the provisions of the Copyright Act, by Canadian laws, policies, regulations and international agreements. Such provisions serve to identify the information source and, in specific instances, to prohibit reproduction of materials without written permission. For more information visit http://laws.justice.gc.ca/en/showtdm/cs/C-42
Les renseignements dans ce document sont protégés par la Loi sur le droit d'auteur, par les lois, les politiques et les règlements du Canada et des accords internationaux. Ces dispositions permettent d'identifier la source de l'information et, dans certains cas, d'interdire la copie de documents sans permission écrite. Pour obtenir de plus amples renseignements : http://lois.justice.gc.ca/fr/showtdm/cs/C-42
THE USE OF FIRE STATISTICS IN GUIDING
RESEARCH AND CODE DEVELOPMENT
Russell Thomas Fire Research Program, National Research Council of Canada
ABSTRACT
There has been a long tradition of collecting fire statistics in many countries around the world. In most cases the collection of statistics have entailed the records of the number of deaths, injuries and the total losses incurred through fire incidents. The majority of the statistics have focused upon fires in buildings, although there have also been considerable financial losses due to other types of fires that often do not get recorded or are included but without being identified as such. The statistics that do exist are, for a variety of reasons, often incomplete or contain errors of one sort or another.
There is some value to be gained by these gross statistics, allowing for national comparisons of fire deaths and injuries, but these statistics are in general of little use to the research and codes
communities in their current format. In order to gain useful information, researchers and codes authorities need to be able to obtain and analyze fire related statistics that reflect a greater level of detail. The major problem in obtaining statistical data on fire incidents in sufficient detail, is
obtaining an unbiased sample of events and being sure that they do not include systematic biases due to the sampling techniques adopted.
This paper will look at both long-term national trends and at the subsets developed to look at specific research issues. The studies will include consideration of the impact of specific regulations, such as smoke alarms and low ignition propensity cigarettes, on fire statistics. The impact of sub-reported fires that generally represent fires that did not grow to a significant size and self-extinguished or fires that were suppressed at an early stage, will also be considered.
In many countries, changes to demographics are beginning to have an impact on the fire statistics. Many developed countries are starting to see the impact of the post Second World War population “bulge” with a growing percentage of the population moving into their post 60’s. As a result many countries will over the next 30 years see a greater percentage of their elderly living longer.
Concurrent with this a growing population of those less able, also a greater percentage will, exhibit difficulties with reacting promptly and appropriately to incidents, such as fires. What can the regulators and the fire community learn from the existing fire statistics that may help them prepare better for such changes and what can the research community do to develop the appropriate information and tools for the future?
INTRODUCTION
There has been a long tradition of collecting fire statistics in many countries around the world. In most cases the collection of statistics have entailed the records of the number of deaths, injuries and the
total losses incurred through fire incidents. The majority of the statistics have focused upon fires in buildings, although there have also been considerable financial losses due to other types of fires that often do not get recorded or are included but without being identified as such. What statistics that exist, are often incomplete or contain errors of various sorts.
In various countries, there are different means of collecting aggregate fire statistics and the degree of participation in these data collection activities varies significantly. In the UK, this data is collected on a national scale and should represent a full collection from all active fire departments in the country. The key US fire statistics data collection activity is focused in the United States Fire Administration (USFA) with their National Fire Incident Reporting System (NFIRS). Participation in this is on a voluntary basis and currently represents data from ~38% of fire departments in the country. Most other countries have a system that follow one or other of these models with more or less rigor.
INTERNATIONAL COMPARISONS
One of the few consistent sources of international comparisons on National fire losses has been
the annual report of the Geneva Association and their Information Newsletter on “World Fire Statistics.”1
These reports cover a number of aspects of the cost of fire around the world and are generally collected within the context of the insurance industry.
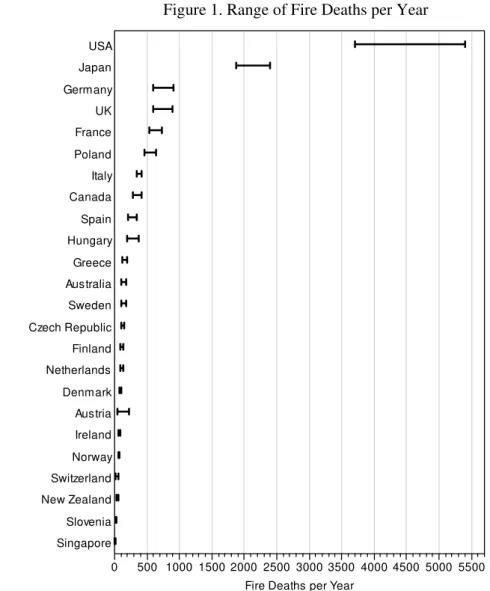
Figure 1. Range of Fire Deaths per Year
Singapore Slovenia New Zealand Switzerland Norway Ireland Austria Denmark Netherlands Finland Czech Republic Sweden Australia Greece Hungary Spain Canada Italy Poland France UK Germany Japan USA Count ry 0 500 1000 1500 2000 2500 3000 3500 4000 4500 5000 5500 Fire Deaths per Year
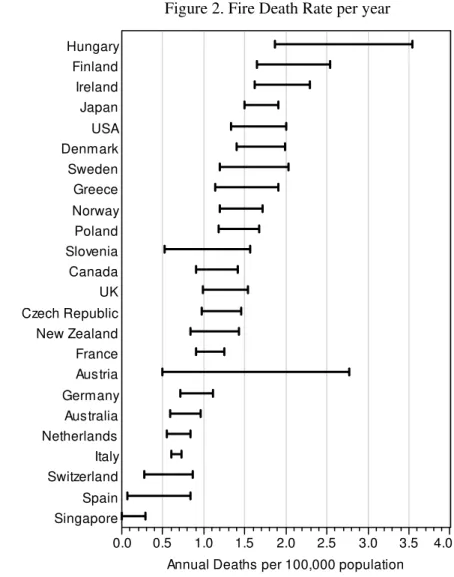
The data does provide a basis for some level of comparison among the different nations in the world although there are certainly a number of sources of error in carrying out such comparisons. If we express the data in terms of the raw numbers, such as number of fire deaths, we can get a strikingly different picture. As can be seen in figure 1, in terms of the raw number of fire deaths, the USA and Japan have more fire deaths than the rest of the reporting nations. If on the other hand, these numbers are considered in terms of the number of individuals at risk of dying in a fire then figure 2 shows a somewhat different picture.
Figure 2. Fire Death Rate per year
Singapore Spain Switzerland Italy Netherlands Australia Germany Austria France New Zealand Czech Republic UK Canada Slovenia Poland Norway Greece Sweden Denmark USA Japan Ireland Finland Hungary Coun tr y 0.0 0.5 1.0 1.5 2.0 2.5 3.0 3.5 4.0
Annual Deaths per 100,000 population
In terms of fire death rate over this period, Hungary moves from 10th position in terms of number of
deaths to first position in terms of death rate per 100,000 of population. In a similar fashion, the USA moved from first position to fifth position.
Although expressing the fire deaths in terms of the numbers of individuals at risk, i.e. the population of the country, seems to bring these numbers to a more even representation, we are still faced with a number of other sources of errors in drawing direct comparisons amongst these data. These can range from the degree or rigor with which the statistics are collected within a jurisdiction through to differences in terms of the definition as to what is considered to be a fire death as this can actually changes amongst, and actually within, some of these jurisdictions. For example in Canada some of the Provincial and Territorial jurisdictions include only fire related deaths that occur within structures whereas others include fire deaths that are as a result of road accidents and outdoor fires. Likewise, there can be over and undercounting of fire deaths where jurisdictions overlap e.g. Native Reservations within Provincial and Territorial
boundaries and, although less likely to occur in terms of fire death statistics, differences in the reporting of fire incidents between full-time and volunteer fire departments.
There have been a number of attempts to account for the observed similarities and differences in fire deaths and fire incidences between the various countries. These have included similarities/differences in climates, construction types, social customs, regulatory climate and social conscience with regard to having a fire in one’s home. It is unlikely that any one of these factors alone can be sufficient to explain the observed ranking of the death rates in Figure 2.
COMPLETENESS OF FIRE DATA
Collection of fire data with regard to fire deaths within a jurisdiction may perhaps be the most reliable set of data-points, even with some of the issues identified above, and from that point on, the reliability and completeness of the data sets become more questionable. One of the most fundamental data points that is needed for a complete picture of fires and fire risk is a reliable indication of the number of actual fires that occur and the percentages of them that grow beyond the initial item ignited. For the development of safety requirements in codes, etc; we also need to have a good understanding of the context in which these fires did or did not grow beyond the initial item.
There have been various attempts to at least gain some estimate of the actual ratio of reported/recorded fires to unreported fires. Perhaps one of the most reliable of these comes from the UK comparisons
derived from their British Crime Survey2 and the Survey of English Housing3 where in 2000 to 2004/5
they estimated that the official fire statistics were only reporting approximately 14% (2000) to 22% (2001 to 2004/5) of all actual domestic fires. Other attempts to derive estimates of the reported to nonreported fires have ranged from approximately 1 in 9 to 1 in 5.
Attempts to ascertain the rigor of the data reported for fires that have been attended by fire service personnel have generally indicated that there are occasionally deliberate miss-classification of a fire in order to minimise the need for data recording/reporting or even reporting of a false-alarm when a fire had occurred. Substantiation of such cases is of course difficult and probably at a relatively low incidence. On the other hand, estimates of damage costs are often underestimated as many fire service personnel, including volunteer departments, have limited formal training in making such estimates. With insured properties, it is sometimes possible to gain better cost estimates but even then there may be a number of insurers involved in a single incident and this can add significantly to the difficulty of obtaining a complete cost estimate.
For the codes developers and the research community, the key information required to aid in decision-making includes information on the fire source, point or object of fire origin, the context of the fire, the involvement of secondary and subsequential objects, the rate and size of fire growth and the impact of fire suppression and fire fighting activities. Information on the type and degree of impact on the occupants and their behaviour before and during the fire are also important in understanding the nature of the hazard and possible future mitigation strategies.
USES OF STATISTICS
In general, most code writing bodies do not monitor their jurisdictions fire statistics on an ongoing basis to identify emerging trends. When these data are collected, it is usually in the context of the fire service and their need for performance reporting or as part of their legislated role. There are some
notable exceptions to this and perhaps the best known of these is the National Fire Protection Association, where there has been a long term policy of surveying and analysing fire related data to obtain early indications of potential problems and to evaluate the impact of changes to standards and codes.
By far the greatest use of fire statistics by code agencies has been to support specific code or standards related initiatives or to monitor the impact of specific changes to codes/standards/legislation. The introduction of a requirement for smoke alarms in Canada in the mid to late 1970’s appears to be clearly related to a significant reduction in fire deaths (the majority of these being residential fire deaths). As can be seen in Figure 3, this was not only true in the case of deaths per 100,000 (this was also a period of significant population growth) but also in terms of total fire deaths.
Figure 3. Canadian Total Fire Deaths by Year
100 200 300 400 500 600 700 800 900 1000 Fire D eat hs 0.50 1.00 1.50 2.00 2.50 3.00 3.50 4.00 4.50 5.00 Fire D eat hs per 100, 000 populat ion 1930 1940 1950 1960 1970 1980 1990 2000 Year
Left Scale: Fire Deaths
Right Scale: Fire Deaths per 100,000 pop
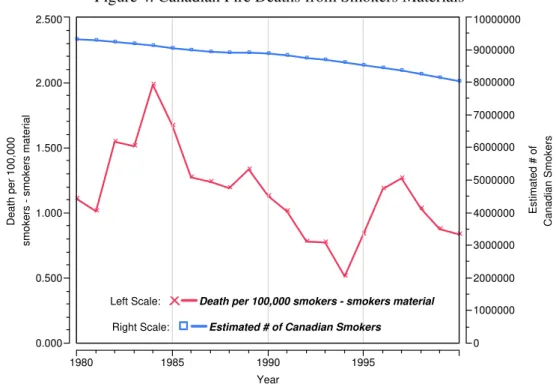
-With the recent introduction of legislation in Canada to require that all cigarettes sold to be low ignition propensity cigarettes, there has been a review of the historic level of fires associated with cigarettes to establish a baseline for future assessment of the legislations impact on this source of fires. It is important to remember when looking at such statistics that the appropriate reference when establishing a rate type measure is understood.
In figure 4, the death rate from smokers’ materials (a general class that includes cigarettes and related materials) is expressed in terms of the current estimate of the population of smokers. Also as one can see from the graph, the numbers of smokers in Canada has been decreasing consistently over recent years where as the number of smokers dying from smokers materials has been moving between 0.5 and 2.0 per 100,000 smokers during the same period. In Canada this results in approximately 21% (SD=5) of fire
deaths being associated with smokers’ materials and that figure is slightly higher in the US at 24%5. It
will
be interesting to observe the next 5 to 10 years what degree of impact the move to low ignition propensity cigarettes will have on the rate of fire deaths from smokers’ materials in Canada.
When looking at long-term trends, the application of a smoothing algorithm to the data to extract the
underlying trends (Tukey6) often makes the picture clearer. Figure 5 provides 85 years of data on the
number of fires in Canada and the associated deaths. It is usually assumed that there is a reasonable degree of association between the number of fires and fire death rates. There are though some noticeable exceptions to that in the data presented in figure 5 where there is a continuing upward trend in the number
of fires in the 1930’s and early 40’s with an actual decrease in fire deaths through the same period. A similar trend was also evident in the period of 1955 to 1960 and 1975 to 1980 when there was little change in the number of death with significant increases in the number of fires.
Figure 4. Canadian Fire Deaths from Smokers Materials
0.000 0.500 1.000 1.500 2.000 2.500 Death per 100,000
smokers - smokers material
0 1000000 2000000 3000000 4000000 5000000 6000000 7000000 8000000 9000000 10000000 Estimated # of Canadian Smokers 1980 1985 1990 1995 Year
Left Scale: Death per 100,000 smokers - smokers material
Right Scale: Estimated # of Canadian Smokers
Figure 5. Canadian Fires and Fire Related Deaths Over the Last 85 Years
0 100 200 300 400 500 600 700 800 900 1000 1100
Fire Deaths - Smoothed
0 5000 10000 15000 20000 25000 30000 35000 40000 45000 50000 55000 60000 65000 70000 75000 80000 85000 CA # fires - Smoothed 1920 1930 1940 1950 1960 1970 1980 1990 2000 Year
Left Scale: Fire Deaths - Smoothed
Right Scale: CA # fires
-Although in the last 3 decades, there has been a consistent decrease in both the number of fires and the numbers of fire deaths in Canada, these changes have not always been at the same rate. Of particular interest is the fact that although both of these measures are decreasing at the present time, they are doing so at different rates (Figure 6). If one looks at these data in terms of fire deaths per 100 fires (using data
for one & two family houses) there has been a recent upturn in the number of deaths associated with the fires (Figure 7). One explanation for this is that although there is a decrease in the number of household fires, the fires that are occurring now are, in fact, more likely to be lethal than they had been previously.
Figure 6. Number of fires and number of fire deaths - 1 & 2 Family Homes
0.00 5000.00 10000.00 15000.00 20000.00
Number of Fires smoothed
0.00 20.00 40.00 60.00 80.00 100.00 120.00 140.00 160.00 180.00 200.00 220.00 240.00 Fatalities Smoothed 1992 1993 1994 1995 1996 1997 1998 1999 2000 Year
Left Scale: Number of Fires smoothed Right Scale: Fatalities Smoothed
Figure 7. Deaths per 100 fires – 1 & 2 Family Homes
1.10 1.15 1.20 1.25 1.30 1.35 1.40 1.45 1.50 1.55 Fatalities per 100 f ires s m oot hed 1991 1992 1993 1994 1995 1996 1997 1998 1999 2000 2001 Year
FIRE STATISTICS AND DEMOGRAPHIC TRENDS
In many countries, particularly the developed countries, changes to demographics are beginning to have an impact on the fire statistics. Many countries are starting to see the impact of the post second world war population “bulge” with a growing percentage of their population moving into there post 60’s. As a result many countries will, over the next 30 years, see a greater percentage of their elderly living longer.
Many of these post 60’s are entering this period of life generally much fitter and active than their parents at the same age although with time they will begin to exhibit difficulties with reacting promptly and appropriately to incidents, such as fires.
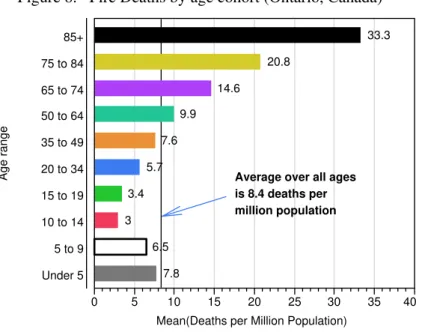
Studies looking at trends in age related fire deaths, indicate that those in the 60 + age bracket have an above average chance of dying in a fire and that by the time they reach 75, they have almost a three times above average chance of dying in a fire. Those in the 85+ bracket are over four times as likely to die in a
fire (see Figure 8). These figures are also reflective of those in other countries7 where the same trend is
found with slight changed due to the underlying demographics.
Figure 8. Fire Deaths by age cohort (Ontario, Canada)
Under 5 5 to 9 10 to 14 15 to 19 20 to 34 35 to 49 50 to 64 65 to 74 75 to 84 85+ Age range 7.8 6.5 3 3.4 5.7 7.6 9.9 14.6 20.8 33.3 0 5 10 15 20 25 30 35 40 Mean(Deaths per Million Population)
Average over all ages is 8.4 deaths per million population
As one can see from long-term trends (Figure 9), Canada has been very successful in reducing the percentage of fire related deaths among children over the last 80 years through a wide range of measures. While not forgetting to continue the work with children, there is a need to move the focus to measures that address the increasing risk of fire related deaths amongst our elderly and the less able in our communities.
Figure 9. Percentage of Fire Deaths by Gender and Age
15.00 20.00 25.00 30.00 35.00 40.00 45.00 50.00 55.00 60.00 65.00
Percentage of Total Deaths
1930 1940 1950 1960 1970 1980 1990 2000 Year
SUMMARY
etc, are useful for international comparisons and also for studying long-term trends. Caution should be used when trying to associate any specific trend in the data to changes in regulations without identifying the appropriate measures and base cases. Taking this into account, there are benefits to be gained from studying underlying trends in these datasets when appropriately smoothed to remove random noise components.
Changes in terms of the increase in fire deaths per 100 fires in 1 & 2 family housing seems to indicate that fires in these settings are becoming relatively more lethal. There are many possible reasons for this, ranging from the types and quantity of materials being brought into the house by the occupants, to changes in the actual materials and designs used to construct the homes. Studies need to be undertaken to establish the possible causes of these changes in the lethality of such fires and to identify how they can be avoided.
The changes in the demographics in many of the developed countries are beginning to have an impact on the fire statistics. This is generally due to the impact of the post second world war population “bulge” which is now resulting in a growing percentage of the population moving into there post 60’s. As a result many of these countries will over the next 30 years see a greater percentage of their elderly living longer. In part this will result in a growing population of those less able and a greater percentage of the population who will exhibit difficulties with reacting promptly and appropriately to incidents, such as fires. This and the existing fire statistics indicate that regulators and the fire community need to prepare for such changes and the research community needs to develop the appropriate information and tools for the future?
REFERENCES
1
World Fire Statistics Centre, 2006, World Fire Statistics #22, The Geneva Association, CH-1208 Geneva, Switzerland. http://www.genevaassociation.org/WFSC.htm
2
Office of the Deputy Prime Minister, 2003; 2004 “Fires in the Home: findings of the 2001/2 British Crime Survey” And “Fires in the Home: findings of the 2003/4 British Crime Survey”
London, UK
.
http://www.communities.gov.uk
3
Office of the Deputy Prime Minister, 2006, “Fires in the Home: findings from the
2004/05Survey of English Housing”, London, UK.
http://www.communities.gov.uk
4
Munich Re, 2006/2, Schadenspiegel -Special feature issue - Risk factor of fire, 80802
München, Germany, pp 23
http://www.munichre.com/en/
5
National Fire Protection Association, 2007, Research & Reports: Major causes of fire. Boston, USA.
http://www.nfpa.org/
6
Tukey, J.W., 1977, Exploratory Data Analysis, Addison-Wesley, Reading, Massachusetts, USA.
7
Communities and Local Government, 2007, Fire Statistics, United Kingdom, 2005, London,