Publisher’s version / Version de l'éditeur:
ACM Transactions on Multimedia Computing, Communications and Applications,
9, 2, 2013-05-01
READ THESE TERMS AND CONDITIONS CAREFULLY BEFORE USING THIS WEBSITE. https://nrc-publications.canada.ca/eng/copyright
Vous avez des questions? Nous pouvons vous aider. Pour communiquer directement avec un auteur, consultez la première page de la revue dans laquelle son article a été publié afin de trouver ses coordonnées. Si vous n’arrivez pas à les repérer, communiquez avec nous à [email protected].
Questions? Contact the NRC Publications Archive team at
[email protected]. If you wish to email the authors directly, please see the first page of the publication for their contact information.
NRC Publications Archive
Archives des publications du CNRC
This publication could be one of several versions: author’s original, accepted manuscript or the publisher’s version. / La version de cette publication peut être l’une des suivantes : la version prépublication de l’auteur, la version acceptée du manuscrit ou la version de l’éditeur.
For the publisher’s version, please access the DOI link below./ Pour consulter la version de l’éditeur, utilisez le lien DOI ci-dessous.
https://doi.org/10.1145/2457450.2457453
Access and use of this website and the material on it are subject to the Terms and Conditions set forth at
Identity verification based on handwritten signatures with haptic
information using genetic programming
Alsulaiman, Fawaz A.; Sakr, Nizar; Valdes, Julio J.; El Saddik, Abdulmotaleb
https://publications-cnrc.canada.ca/fra/droits
L’accès à ce site Web et l’utilisation de son contenu sont assujettis aux conditions présentées dans le site LISEZ CES CONDITIONS ATTENTIVEMENT AVANT D’UTILISER CE SITE WEB.
NRC Publications Record / Notice d'Archives des publications de CNRC:
https://nrc-publications.canada.ca/eng/view/object/?id=1451a431-40fb-496b-9d33-982b0b47a0cc https://publications-cnrc.canada.ca/fra/voir/objet/?id=1451a431-40fb-496b-9d33-982b0b47a0cc
Identity Verification based on Handwritten Signatures
with Haptic Information using Genetic Programming
FAWAZ A. ALSULAIMAN and NIZAR SAKR, University of OttawaJULIO J. VALD ´ES, National Research Council Canada, Institute for Information Technology
ABDULMOTALEB EL SADDIK, University of Ottawa
In this paper, haptic-based handwritten signature verification using Genetic Programming (GP) classification is presented. A comparison of GP-based classification with classical classifiers including Support Vector Machine, k-Nearest Neighbors, Na¨ıve Bayes and Random Forest is conducted. In addition, the use of GP in discovering small knowledge-preserving subsets of features in high dimensional datasets of haptic-based signatures is investigated and several approaches are explored. Subsets of features extracted from GP-generated models (analytic functions) are also exploited to determine the importance and relevance of different haptic data types (e.g., force, position, torque, and orientation) in user identity verification. The results revealed that GP classifiers compare favorably with the classical methods and use a much fewer number of attributes (with simple function sets).
Categories and Subject Descriptors: I.5.1 [Pattern Recognition]: Design Methodology—Classifier design and evaluation; H.5.2 [Information Interfaces and Presentation]: User Interfaces—Haptic I/O
Additional Key Words and Phrases: Haptics, Biometrics, Genetic Programming, user verification, classification
1. INTRODUCTION
Haptics, derived from the Greek word “haptesthai” which means the sense of touch, is an emerging area of research that enables the sensing and manipulation of virtual environments through touch. Its applications [Sakr et al. 2010a; Saddik et al. 2007; Sakr et al. 2010b; Cha et al. 2009; Orozco et al. 2008] are wide, and range from surgical simulation to gaming and entertainment. Many of haptics’ current applications involve the analysis and interpretation of acquired haptic information in order to possibly reveal certain patterns in the data. Haptic-based biometrics is one example of such applica-tions. Biometric systems provide a solution to ensure that protected services are solely accessible by a legitimate user. This is achieved while relying on users’ behavioral and/or physiological character-istics. The two primary uses of biometrics are in user verification and identification. User verification is a one-to-one comparison of a person’s biometric template with his or her original sample previously stored in the system. The verification result is a “match” or “no-match”. Conversely, user identifica-tion is a one-to-many comparison problem where a biometric template is compared against a biometric
Author’s address: Fawaz A. Alsulaiman, Nizar Sakr, Abdulmotaleb El Saddik, 800 King Edward Ave., Ottawa, Ontario, K1N 6N5, Canada; email: [email protected], {fawaz, abed}@mcrlab.uottawa.ca; Julio J. Vald´es, 1200 Montreal Road, Ottawa, Ontario, K1A 0R6 Canada ; email: [email protected].
Permission to make digital or hard copies of part or all of this work for personal or classroom use is granted without fee provided that copies are not made or distributed for profit or commercial advantage and that copies show this notice on the first page or initial screen of a display along with the full citation. Copyrights for components of this work owned by others than ACM must be honored. Abstracting with credit is permitted. To copy otherwise, to republish, to post on servers, to redistribute to lists, or to use any component of this work in other works requires prior specific permission and/or a fee. Permissions may be requested from Publications Dept., ACM, Inc., 2 Penn Plaza, Suite 701, New York, NY 10121-0701 USA, fax +1 (212) 869-0481, or [email protected].
c
2010 ACM 1544-3558/2010/05-ART1 $10.00
database with the attempt to identify an unknown individual. The possible use of haptic devices in biometric systems has been suggested in recent years to enhance user identification and verification performance over more traditional techniques, such as those based on handwritten signatures [Saddik et al. 2007; Orozco et al. 2008].
Haptic data, which depict trajectory, cutaneous as well as kinesthetic information, essentially con-sist of position, velocity, orientation, torque and force information that are directly acquired from a haptic interface upon a user’s interaction with a predefined virtual environment. However, regardless of the intended haptic application, the number of resulting features are usually significantly large (in the thousands range) as the recorded information typically consists of multidimensional time-varying data. Consequently, reduction of the number of acquired features through, for example, feature selec-tion methods, could be beneficial. Specifically, a smaller subset of features reduces the space complexity of the classification problem (e.g., in haptic-based biometrics) which may translate into better discrim-ination performance.
User identity verification and identification using high-dimensional haptic information has been little explored in the literature. Initial work [Orozco et al. 2006] in this area examined users’ haptic-based biometric characteristics using a maze application, in particular an environment which enables participants to solve a haptic-enabled virtual maze. The authors applied different techniques, including Hidden Markov Models, spectral data analysis and time warping to explore the possibility of real-time (and continuous) haptic user verification. Their preliminary results demonstrated that a verification rate of up to 78.8% with a 25% false acceptance rate (FAR) can potentially be achieved. In more recent work, El-Saddik et al. [2007] relied on haptic datasets acquired using two different applications in order to thoroughly explore the feasibility of a based user authentication system. The haptic-enabled applications corresponded to the aforementioned virtual maze application, and a haptic-based virtual check (virtual equivalent of a real bank check). The primary contribution of El-Saddik et al.’s [2007] paper is the application of a feature selection method that relies on a relative entropy measure, which the authors interpreted as a pseudo-metric that defines the distance between an individual’s features and those of the entire population of users. Their best results demonstrated that a verification probability of 95% with a 4.5% FAR can be achieved when datasets acquired using the virtual maze application are considered. However, when datasets acquired using the virtual check application are analyzed, a verification probability of up to 98.0% with a 25% FAR is obtained. However, while a 98% verification rate is an excellent result, a 25% FAR is considered quite poor. In particular it suggests that there is a 25% chance of an invalid input (e.g., invalid user signature) to be incorrectly accepted. In subsequent work [Orozco et al. 2008], the authors extended their approach to include a combination of Principal Component Analysis and Dynamic Time Warping (DTW) to allow for an important size reduction of recorded digital haptic signatures while maintaining an adequate verification rate. Their reported results suggested a verification rate of up to 92% with a 25% FAR.
Similar research was conducted by Iglesias et al. [2007], however, their focus was on haptic signa-ture analysis using a visual data mining approach. Their datasets were acquired using the previously mentioned virtual maze and virtual check applications, as well as a virtual phone on which users can haptically dial a number (virtual equivalent of a cellular phone). A single dataset was acquired using each of the aforementioned applications, for a total of three different datasets. First, the authors at-tempted to explore user-behavior-similarity across the three applications (for a single user and using all the acquired features) using 3D visual representations of the recorded data; specifically, 3D virtual spaces were constructed using a classical optimization technique. The experiments were then repeated using only subsets of features in order to assess the impact of different attributes on user-behavior. In follow-up work [Iglesias et al. 2008; Iglesias et al. 2008], the authors used the same visual data mining approach discussed in Iglesias et al. [2007] in order to explore the within-user variations and
between-user variations of haptic-based handwritten signatures (this dataset was collected with the virtual check application). Malek et al. [2006] explored the possible benefits of haptics in graphical password authentication systems; specifically in preventing shoulder surfing attacks. A shoulder surfing attack occurs when an adversary captures a legitimate user’s password by direct observation (over a user’s shoulder) or by recording the person’s authentication session. The authors’ haptic-enabled scheme proved to partially prevent shoulder surfing attacks as adversaries can only capture and reproduce the graphical component of the password, i.e., ‘hidden’ force-feedback (and velocity) information re-mained undetectable and irreproducible. More detailed experiments were presented in subsequent work [Orozco et al. 2006] where Artificial Neural Network and Nearest-Neighbor’s classifiers were ex-ploited to authenticate graphical passwords using strictly ‘hidden’ haptic information. Their results suggested that on average successful verification probabilities of 90.1% and 92.0% were achieved using the Artificial Neural Network and Nearest-Neighbor’s algorithms respectively.
In all of the related works [Saddik et al. 2007; Orozco et al. 2008; Iglesias et al. 2007; Iglesias et al. 2008; Iglesias et al. 2008; Malek et al. 2006; Orozco et al. 2006], however, when preprocessing the dataset, the authors distribute the high dimensional attributes of each signature across different
in-stances, i.e., position, velocity, orientation, torque and force data acquired at time t1 are assigned to
instance Inst1, data acquired at time t2 are assigned to instance Inst2, etc., yielding a number of
in-stances per user signature with only few attributes per instance. An alternative (and perhaps more intuitive) approach, would be to assign all the generated haptic data attributes per signature to a single instance, i.e., each instance contains the entire (haptic-based) signature for a single user. This approach can lead to better analysis and interpretation of the haptic dataset, and improve discrimi-nation between users. However, it comes at the expense of having to deal with instances that possibly consist of thousands of attributes. In one of the authors’ recent papers [Sakr et al. 2009] haptic feature vectors were redefined using the approach suggested above (all haptic data attributes associated with a single signature are assigned to a single instance). The paper explored the use of rough set theory for feature selection in high-dimensional haptic-based signature datasets. However, feature selection was performed strictly on full datasets (rather than on training datasets) to investigate its potential use as a preprocessing step for feature generation techniques in visual data mining of haptic data. In subsequent work [Sakr et al. 2010b], the authors investigated the use of rough set theory for feature selection in haptic-based signature identification systems (i.e., feature selection is strictly performed on training datasets). Two rough set-based methods for feature selection are analyzed, the first was a greedy approach while the second relied on genetic algorithms to find minimal subsets of attributes. In another recent paper [Sakr et al. 2010a] haptic-based handwritten signatures are analyzed within a visual data mining paradigm while relying on unsupervised construction of virtual reality spaces using classical optimization and genetic programming (GP). The purpose (similar to Iglesias et al.’s work) is to present the high dimensional dataset in some visual form, enabling a user to gain insight into the data to identify potentially useful and ultimately understandable patterns, rapidly and with ease.
This paper relies on genetic programming techniques to discover minimal knowledge-preserving subsets of features in high dimensional datasets of haptic-based handwritten signatures. In particular, the analysis of the suggested technique makes use of two datasets acquired using the aforementioned virtual check application. The first dataset corresponds to 130 haptic-based handwritten signatures ac-quired from 13 different participants (10 signatures per participants). The second dataset corresponds to 1000 haptic-based handwritten signatures acquired from 20 different participants (50 signatures per participant). The contributions of this paper are as follows: Haptic signatures verification using GP-based classification is performed. More specifically, gene expression programming (GEP), a variant of the classical GP algorithm is exploited to (1) find analytic functions that can behave as classifiers
in high-dimensional haptic feature spaces and (2) discover minimal knowledge-preserving subsets of features. Furthermore, in order to overcome the class imbalance problem typically observed in user identity verification systems, two sampling techniques, namely over-sampling and random-under-sampling, are considered. In addition, relevant features emphasized in GP models are selected using two proposed methods: (1) The union of all variables present in generanted GP-models, and (2) the selection of a subset containing the most frequent attributes. This is performed by inspecting the cumulative frequency distribution of all variables present in generated GP models. Furthermore, a comparison of GP-based classification with classical classifiers (Support Vector Machines (SVM), k-nearest neighbors (k-NN), Na¨ıve Bayes and Random Forest), is provided. Additionally, minimal sub-sets of features extracted from GP-generated models are exploited to determine the importance and relevance of different haptic data types (e.g., force, position, torque, and orientation) in user identity verification. Ultimately, this will shed light on the relative importance of haptic-specific data types (i.e., force, torque, and orientation) in user verification.
The rest of the paper is organized as follows. In Section 2 an introduction to the basic concepts and methods exploited in this work is provided. In Section 3 gene expression programming based classification and feature selection are described. In Section 4 the experimental settings are described. In Section 5 the results are illustrated. Finally, conclusive remarks are outlined in Section 6.
2. CONCEPTS AND METHODS
2.1 Evolutionary Computation
Evolutionary Computation [Fogel 2000] is a general term for several computational techniques which are inspired and/or based to some extent on the evolution of biological life in nature. It comprises the study of the foundations and applications of certain heuristic techniques based on the principles of natural evolution. An Evolutionary Algorithm (EA) is an iterative and stochastic process that operates on a set of individuals (population). Each individual represents a potential solution to the problem being solved. This solution is obtained by means of an encoding/decoding mechanism. Initially, the population is randomly generated (perhaps with the help of a construction heuristic). Every individual in the population is assigned, by means of a fitness function, a measure of its goodness with respect to the problem under consideration and this value is the quantitative information the algorithm uses to guide the search. An Evolutionary Computation (EC) algorithm consists of the following general steps: (1) Build the initial population.
(2) Evaluate the objective function (fitness function). (3) While the termination criteria are not met:
—Apply evolutionary operators (selection, reproduction, crossover, mutation, etc.). —Evaluate the objective function.
2.2 Genetic Programming (GP)
Evolutionary algorithms have been historically divided into several categories. The methods differ primarily in the operators they exploit; more specifically, the differences lie in the implementation of the selection, reproduction, and evolutionary operators. Genetic Programming (GP) is a particular EC algorithm introduced by Koza [John and Langley 1989; Koza 1992; 1994]. It is an extension of the genetic algorithm (GA) and aims at evolving computer programs, which ultimately are functions.
2.2.1 Gene Expression Programming (GEP). A particular variant of GP called Gene Expression Programming (GEP) [Ferreira 2006] encompasses individuals that are in fact expression trees encoded as simple strings of fixed length (chromosomes) and representing entities of different sizes and shapes;
generally nonlinear expressions. For the interplay of the GEP chromosomes and the expression trees (ET), GEP uses an unambiguous translation system to transfer the language of chromosomes into the language of expression trees and vise versa [Ferreira 2006]. The set of genetic operators applied to GEP chromosomes always produces valid ETs. The chromosomes in GEP itself are composed of genes structurally organized in a head and a tail. The head contains symbols that represent both functions (elements from a function set F ) and terminals (elements from a terminal set T ), whereas the tail contains only terminals. Therefore, two different alphabets occur at different regions within a gene. For each problem, the length of the head h is chosen, whereas the length of the tail t is a function of
h and the number of arguments of the function with the largest arity (nmax). The length of the tail is
evaluated by t = h(nmax− 1) + 1 (see Appendix A about GEP encoding).
GEP chromosomes are usually composed of more than one gene of equal length. Moreover, for each problem the number of genes as well as the length of the head has to be chosen. Accordingly, each gene encodes a sub-ET and the sub-ETs interact with one another forming a more complex multi-subunit ET. For this interaction a connection or linking function has to be selected, which connects the different sub-ETs [Ferreira 2006]. Typical choices for the linking function are addition or multiplica-tion. Additionally, to evaluate GEP chromosomes, different fitness functions can be used. The fitness
fi of the individual i is expressed by some inverse relation w.r.t. an error measure, or by some
posi-tive relation w.r.t. a correlation or similarity measure. To evaluate GEP chromosomes, several fitness functions could be considered and their selection is both problem and user dependent. For example, there are different fitness functions available that have been used in other GEP applications such as boolean concept learning or logic synthesis [Ferreira 2006]. Typical choices are the absolute error or the relative error (see Appendix B).
Every evolutionary computation technique uses genetic operators to introduce diversity within a population. GEP defines, according to the structural organization of the chromosomes, different kinds of genetic operators, in particular: inversion, mutation, one point recombination, two point recombina-tion, gene recombinarecombina-tion, root insertion sequence transposirecombina-tion, insertion sequence transposirecombina-tion, gene transposition, random numerical constants (RNC) mutation (the creation of floating-point constants is considered necessary for symbolic regression. In GEP, this is achieved using RNC. In particular, GEP uses an extra terminal “?” and an extra domain Dc composed of the symbols chosen to represent the random constants), Dc mutation, Dc inversion, and Dc insertion sequence transposition [Ferreira 2006]. A more thorough description of each GEP operator is described in Appendix C.
2.2.2 Genetic Programming for Classification, Feature Selection and Generation. The nature of GP as a search algorithm enables it to solve a variety of problems including classification and regression [Espejo et al. 2010; Eggermont et al. 2004]. The flexibility of this technique allows for the adjustment of many variables that affect the evolutionary process such as whether to have a static or dynamic threshold in forming regions of the output space [Zhang and Smart 2006] [Zhang and Smart 2004] [Loveard and Ciesielski 2001]. Moreover, it permits for the adaptation of GP to be used on feature selection and generation. Krawiec [Krawiec 2002] proposed a GP based procedure for feature con-struction where individuals consist of fixed length vectors. Features in each vector are constructed using a set of analytical functions computed using GP. Krawiec [Krawiec 2002] follows a wrapper ap-proach, where evaluations on the training set are conducted using the same classifier exploited during the testing phase. Moreover, Krawiec [Krawiec 2002] adopted a GP flavor [Koza 1994] that inherits the well-known disadvantage of traditional GP algorithms, i.e., the generation of invalid expressions (phenotype). This problem is overcome with the GEP algorithm exploited in this work as it permits a functional genotype/phenotype relationship where modification performed in the genome always re-sult in syntactically correct expression trees. In [Krawiec and Bhanu 2005], Krawiec et al. propose a
method based on Cooperative Coevolution (CC) [B.Draper et al. 2000] which maintains several popu-lations (of individuals) where selected individuals from each population together form what is referred to as an organism. More specifically, a joint evaluation scheme is performed, forcing the populations to cooperate. Consequently, this approach can be exploited to divide a complex problem into smaller subproblems without explicit or complete a priori knowledge of their objectives. Friedlander et al. [Friedlander et al. 2011] proposed a feature ranking method using genetic programming. This ap-proach constructs a feature weight vector based on the frequency of features and their corresponding fitness values. The weights are used as probabilities to bias the selection of the most frequent termi-nal variables during GP subtree-based mutation. During each generation, the feature weight vector is updated while considering all individuals in the population. Similar work proposed previously by Ok et al. [Ok et al. 2000] where only the top 10% of the solutions are considered when computing the feature weight vector. However, in their approach, re-initialization of the original feature space is performed to omit irrelevant terminal variables. In more recent work, Neshatian et al. [Neshatian and Zhang 2009a] [Neshatian and Zhang 2009b] proposed a GP system to measure the relevance of feature subsets in binary classification problems. Their system follows a filter approach where subset of features are considered and evaluated (rather than a per-feature approach). Subsets of features are ranked using a measure defined by the authors, namely the relative measure (RM). Consequently, the highest ranked subset of features is selected.
2.3 Classical Classification and Feature Selection Techniques
2.3.1 Support Vector Machine. Support Vector Machines [Boser et al. 1992; Vapnik 1998; en Fan et al. 2005] (SVM) were introduced to solve pattern classification and nonlinear regression estimation problems. The aim of Support Vector classification is to derive a computationally efficient approach of learning accurate separating hyperplanes in a high dimensional feature space (see Appendix D). In the linearly separable case (i.e., no mapping function required), SVMs attempt to find the hyperplane (class boundary) with the maximum distance from the nearest training patterns. In the nonlinear case, where the data isn’t linearly separable, a transformation to a higher dimensional space can be performed. With an appropriate nonlinear mapping φ(·) to an adequate high dimension, data from two categories can always be separated by a hyperplane. In order for this mapping to be computationally feasible, a
kernel function K(xi, xj) ≡ φ(xi)Tφ(xj) is typically exploited. Many commonly used functions can be
exploited to perform this mapping, including polynomial, radial basis functions and certain sigmoid functions.
2.3.2 k-Nearest Neighbor Classifier. The k-Nearest Neighbor (k-NN) technique is a particularly simple nonparametric classifier that is extensively used in various pattern classification problems [Aha et al. 1991; Duda et al. 2000]. Nonparametric methods are exploited in problems where a suit-able parametric model is not availsuit-able or parameter estimation may be too costly. In addition, as non-parametric techniques make fewer assumptions, they tend to be more robust, and their applicability is much wider than their parametric counterparts. In the k-NN rule, a test instance x is classified by assigning it to the pattern class that appears most frequently amongst the k nearest mining samples. If no single class appears with the greatest frequency, then the class with the minimum average dis-tance from x is selected. The disdis-tance metric that is most commonly used in nearest-neighbor methods
is the Euclidean distance which is defined as dist(x, y) =pPn
i=1f (xi, yi) where f (xi, yi) = (xi− yi)2.
2.3.3 Na¨ıve Bayes. The Na¨ıve Bayesian classifier is used in supervised inductive problems where the objective is to accurately predict the class membership of test instances, given a set of labeled (con-tains class information) training instances. It relies on two important simplifying assumptions (hence the name na¨ıve): (1) All attributes are assumed to be independent from each other given the class, and
(2) hidden or latent attributes have no affect on the prediction performance [John and Langley 1995] (see Appendix E). The classifier is entirely defined by the conditional probabilities of each attribute given the class. Moreover, Na¨ıve Bayes models a numeric attribute using a certain probability distribu-tion, which is generally assumed to be Gaussian. Despite the simplification assumptions that underlie its design, the Na¨ıve Bayesian classifier is widely known for its robustness, producing classification accuracies comparable to other much more sophisticated methods in practical settings, even when the independence assumption does not hold.
2.3.4 Random Forest. Random forest is a classifier that employs an ensemble of decision trees for high-performance classification [Breiman 2001; Kuncheva 2005]. Each tree is built on a randomly selected subset of the training data, where final classification of a test sample is based on a majority vote determined from all the trees in the forest. Specifically, there are three factors that contribute to the individuality of each tree:
(1) Each tree is trained with a distinct set of n instances which are drawn independently with replace-ment from the original training set of (n) instances.
(2) If the dataset comprises instances of M features, then, at each node of each tree a split is deter-mined by searching through m ≪ M randomly chosen features.
(3) Each tree is grown to the maximum size and kept with no pruning.
The generalization error of the ensemble of tree classifiers depends directly on the strength of the individual trees in the forest and the correlation between them. Moreover, it has been shown [Breiman 2001] that high-accuracy (lower generalization error) Random Forests have lower correlation between classifiers and higher strength. In fact, an appropriate selection of the parameter m (the size of the random subset of features) plays an important role in achieving this goal due to the following factors: (1) Increasing the value of m increases the correlation between any two trees in the forest. However,
an increase in the correlation leads to an increase in the error rate of the forest.
(2) Increasing the value of m increases the strength of each individual tree and results in a decrease in the forest error rate.
Accordingly, m is generally selected such that the best compromise between strength and correlation is achieved. The Random Forest algorithm has proven to be very effective when dealing with high-dimensional datasets due to its parallel nature (computationally effective), its impressive classification accuracy, and its low sensitivity to noisy data when compared to other similar techniques, such as boosting.
2.3.5 Feature selection using subset size forward selection. Subset size forward selection is a wrap-per based, computationally efficient, attribute selection method proposed by Gutlenin et al. [Gtlein et al. 2009]. It is specifically designed to handle high dimensional datasets. First, the method searches the feature space to determine the optimal subset size. Then, a forward selection is performed to de-termine relevant attributes to a maximum of the chosen optimal subset’s size. In addition, correlation based feature selection [Hall 1999] is used as an evaluation method where high correlation with the class and low inter-correlation among selected features is desired. Weka’s implementation of this algo-rithm has been exploited in this work. [Hall et al. 2009]
2.4 The Unbalanced Dataset Problem
One important challenge that must be considered in this work is the unbalanced nature of the ex-ploited haptic datasets. The unbalanced dataset problem generally occurs in two class domains when the number of instances belonging to one class (majority class) is significantly larger than the number
of instances belonging to the other class (minority class). In real life applications, it is often possible to have classes that vary significantly in the number of instances. This might occur due to a lack of sufficient knowledge about the minority class (the class containing only few instances), e.g., difficulties to collect information about rare species. Accordingly, solving the problem of unbalanced datasets is of utmost importance as it can negatively affect a classifier’s performance. In fact, in such scenarios, classifiers can often predict the majority class with relatively high accuracy yet always misclassify the minority class; although in many data mining applications, such as in medical diagnosis domains, clas-sification of the minority class is of crucial importance. In addition, a classifier can achieve a very high overall accuracy; However, still perform poorly when classifying the minority class [Alsulaiman et al. 2009]. Many solutions have been proposed to solve the problem of unbalanced datasets. A trivial solu-tion is to resample the data by either oversampling the minority class or under-sampling the majority class. The re-sampling techniques are either performed randomly or intelligently. Kubat and Matwin [Kubat and Matwin 2004] adopted Tomek’s technique [Tomek 1976] where only instances of the major-ity class are removed to solve the unbalanced datasets problem. More specifically, it removes redundant and border line instances. They named their technique One-Sided Selection (OSS). Chawla et al. [2002] proposed SMOTE, an approach that over-samples the minority class with synthetic examples using the k-nearest neighbors. The number of chosen nearest neighbors depends on the oversampling rate. In order to generate a synthetic sample, their technique initially chooses at random one of the k-nearest neighbors of a certain minority class sample. Then, it randomly generates a synthetic sample that falls on the line separating the two genuine samples. In addition, the authors combined their approach with the randomly under-sampling (the majority class) technique. Pazzani et al. [1994] suggested as-signing cost values to different data instances as another possible solution to the unbalanced datasets problem. They considered both the predicted classes and the actual classes in their costs assignment procedure. Japkowics and Stephen [Japkowics and Stephen 2002] performed several experiments that tackle this problem. Their experiments revealed that class imbalance is affected by four main factors: degree of class imbalance, the size of the training sets provided, complexity of the resulting concept and the type of classifier used. Similarly, Hulse et al. [2007] performed a comprehensive experiment based on 35 real world benchmark datasets and 11 learning algorithms. In total, seven sampling techniques were compared. In their experiments, it was observed that the performance of the sampling techniques depended directly on the learning algorithms used. Nevertheless, the authors ranked the random
ma-jority under-samplingas the sampling technique with the best results followed by the random minority
over-samplingmethod. The former technique works by randomly omitting some instances of the ma-jority class in order to balance the datasets. The latter technique is performed by randomly replicating samples of the minority class based on the number of instances of the majority class. It was concluded that the two aforementioned simple sampling techniques performed much better than other intelligent schemes such as SMOTE [Chawla et al. 2002] and OSS [Kubat and Matwin 2004].
Aside from the simple sampling and intelligent sampling techniques, another approach to solving the class imbalance problem is to design fitness functions that can directly achieve this goal. Bhowan et
al.[2009] proposed a genetic programming-based approach to solve the unbalanced dataset problem;
in particular, they suggested four different fitness functions. The authors showed that using overall classification accuracy as a fitness function evolved programs that were biased towards the majority class, despite having a high overall discrimination accuracy. Their suggested fitness functions have as an objective to improve the overall classification performance, while maintaining a high minority class classification. Conversely, Doucette and Heywood [Doucette and Heywood 2008] proposed a generic model for the evolution of GP classifiers under unbalanced datasets while relying on a strategy con-sisting of two components: sub-sampling and robust fitness function design. The authors utilized the Area Under the Curve (AUC) measurement as a cost function for GP based classification. Moreover,
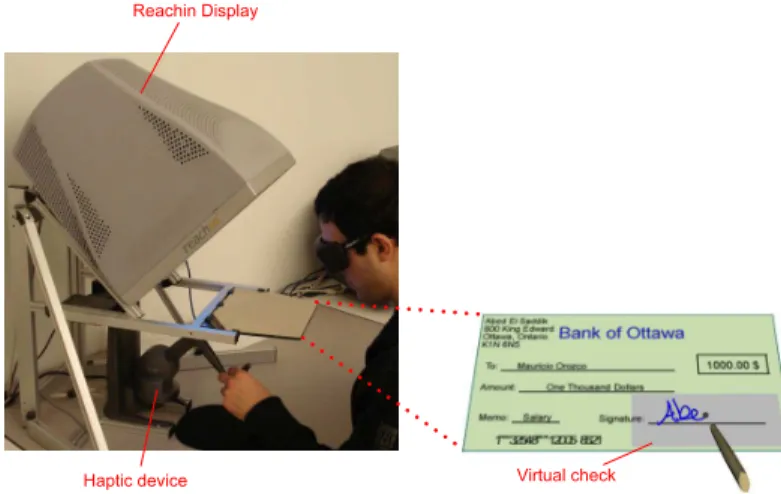
Fig. 1: Haptic-enabled virtual check application.
the authors applied a simpler representation of a Dynamic Subset Selection model [Gathercole and Ross 1994] where exemplars are selected from the training datasets with a uniform probability and equal representation for both major and minor classes.
Bhowan et al. [Bhowan et al. 2011a] investigated the possibility of using a GP dynamic class-threshold instead of the standard GP fixed class-class-threshold to solve the class imbalance problem. A comparison between the two strategies using four different fitness functions designed to solve the class imbalance problem, is presented. Only a slight improvement when using two of the four fitness functions was observed in the obtained results. In addition, Bhowan et al. [Bhowan et al. 2010] pro-posed modifications to their previously propro-posed fitness functions [Bhawan et al. 2009]. A comparison between the enhanced single-objective fitness functions and a multi-objective approach which evolved the pareto front with the objective accuracy of the minority and majority classes, is provided. Bhowan’s study resulted in better performance fitness functions. Moreover, the utilization of multi-objective GP has the advantage to select the desired classifier based on the evolved pareto front. Recently, a multi-objective GP that uses ensembles of solution to vote for class membership has been proposed in [Bhowan et al. 2011b]. In this paper, random majority under-sampling (RUS) and the random
minor-ity over-sampling(ROS) were used to treat the unbalanced datasets found in user verification systems. This will be further illustrated in Section 5.
3. GENE EXPRESSION PROGRAMMING CLASSIFICATION AND FEATURE SELECTION
In this paper, GEP is exploited to achieve two different objectives: (1) generate analytical functions that can act as binary classifiers, and (2) to discover minimal knowledge-preserving subsets of
fea-tures. In the former case, a generated analytical function f (v1, · · · , vn), where v denotes the variables
(attributes), is evaluated and the computed result (which corresponds to a binary-class prediction) is compared to a threshold τ as follows:
h ∈ Cp; fi(v1, · · · , vn) ≥ τ (1)
where h is the predicted class, Cp is the positive class and Cn is the negative class. In the latter
case, GP-generated functions are exploited to identify relevant features (from the function variables) in high dimensional (haptic) datasets. In this work feature selection is achieved using a conservative approach. Specifically, relevant features are selected based on a union of all variables exploited in a set
of GP models (analytical functions) of cardinality NGP generated using NGP independent GEP runs
(on the same dataset). This can be mathematically described as follows: Let Vp = {v1, v2, · · · , vNVp},
NVp= card(Vp) be the set of predictor variables (i.e., features, attributes) of a dataset and let y be the
predicted variable. Additionally, let FGP = {F1, F2, · · · , FNGP}, NGP = card(FGP) be a collection of GP
models estimating y and derived from the same data set having VP and y as predictor and predicted
variables respectively. The models in FGP have the form
ˆ
yk = Fk(vk1, vk2, · · · , vkpk) (3)
with k ∈ [1, NGP] and arity pk ∈ [1, NVp]. The set VGPk = {vk1, vk2, · · · , vkpk} contains the arguments of
the k-th GP model. ˆyk is the estimation of y produced by the k-th GP model with arguments given by
vkj ∈ Vpfor all k ∈ [1, NGP]. Define the set
RVp,FGP = (Vp/FGP) = "NGP [ k=1 Vk GP # ⊆ Vp (4)
and call it the relevant subset of Vp given FGP. It represents the (minimal) subset of predictor
vari-ables required by the collection of GP models estimating y. From it, a relevant ratio is defined as λRVp,FGP = card(RVp,FGP)/NVp, as a measure of the degree of dimensionality reduction achieved by
variable selection associated to FGP models. Along the same lines, the set
IVp,FGP = {Vp− RVp,FGP} (5)
is defined as the irrelevant subset of Vpgiven FGP. Clearly, it is the set of variables not present in any
of the FGP and therefore, superfluous from the point of view of the GP models. An irrelevant ratio is
defined as λIVp,FGP = 1 − λRVp ,FGP.
In addition, an alternative approach is investigated to exploit and further analyze GP-based feature
selection. It considers that Rα
q ⊆ RVp,FGP where R
α
q is the subset of most frequent attributes,
under-stood as those contained within the α-percentile of the cumulative frequency distribution. Specifically,
this refers to the cumulative frequency distribution of all variables exploited in NGP models (analytical
functions) generated using NGP independent GEP runs (on the same dataset). In our case α was set to
0.01 as it will be further discussed in Section 5.
4. EXPERIMENTAL SETTINGS
In this section, the haptic-enabled virtual check application as well as the haptic data acquisition and preprocessing steps will be described. Furthermore, the GEP algorithm settings will be provided.
4.1 Haptic-enabled Virtual Check Application
The experiments are performed using the Reachin Display [ab. Reachin Display. ], which integrates a haptic device with stereo graphics for an immersive and high quality 3D experience. The Reachin visuo-haptic interface enables users to see and touch virtual objects at the same location in space. The haptic stimulus is sensed using the SensAble PHANTOM Desktop force-feedback device, which is equipped with an encoder stylus that provides 6-degree-of-freedom single contact point interaction and positional sensing. Furthermore, the visual stimuli as depicted in Fig. 1, consist of a virtual pen
and a virtual check on which users can record their handwritten signature. Conversely, the haptic stimuli are force and frictional feedback that attempt to mimic the tactile sensations felt when signing a traditional paper check. More specifically, the check is built on an elastic membrane surface with particular texture features, providing the users with a user-friendly and realistic feel of the virtual object. Moreover, similar to conventional dynamic signature verification technologies, the virtual check application records a wide array of attributes that depict a user’s physical and behavioral traits.
4.2 Haptic Datasets
4.2.1 Haptic Dataset 1 (HS1). The haptic-based handwritten signatures are diligently obtained from 13 different participants, where 10 signatures are collected per individual. The data acquired de-pict various distinct haptic features as a function of time. A number of haptic data types are considered that characterize the instantaneous state of the haptic system, including, three-dimensional position, force (pressure exerted on the virtual check), torque, and angular orientation. Also, haptic data are recorded at 100 Hz. As the data is time-varying, the resulting number of attributes per signature is in fact the number of haptic data types considered (position, force, torque, etc.) times the number of samples recorded per data type during each signature acquisition. This evidently leads to significantly large feature vectors that encompass thousands of haptic-based attributes. In order to ensure accurate discrimination between the signatures, the obtained feature vectors were normalized to a common length of 10000. Essentially, the acquired haptic data types are re-sampled (upsampled/downsampled) when necessary to ensure a common feature vector length across all instances. The latter feature vec-tor length was selected in such a manner to minimize the information loss that is most apparent when downsampling is performed. Consequently, the computed preprocessed dataset contains 130 instances, where each consists of 10000 features.
As aforementioned, in this paper we are concerned with biometric identity verification (as opposed to identification), which is a two-class classification problem (dichotomization), where a dichotomizer assigns class labels A (accept identity claim) or B (reject identity claim) to observed feature vectors x. The preprocessed dataset is therefore rearranged into 13 distinct datasets (one for each class), where in each only the instances of a single class are labeled accept (A = 1), whereas the remaining instances are labeled reject (B = 0). It is clear that the obtained datasets are highly unbalanced as the number of instances belonging to the accept class is much smaller than the number of instances associated with the reject class. Nonetheless, the obtained biometric identity verification datasets were then first divided into 60% training and 40% test sets, and also divided into 80% training and 20% test sets. Let’s refer to the former datasets as IMB 60, and the latter datasets as IMB 80. The rearranged verification datasets were then preprocessed using random under-sampling (RUS) the majority class technique and the random over-sampling (ROS) the minority class method, as discussed in Section 2.4. This is achieved in order to obtain balanced versions of the datasets. The computed datasets, similar to the unbalanced case, were then divided into 60% training and 40% test sets, and also divided into 80% training and 20% test sets. Let’s refer to the former datasets as RUS 60 and ROS 60, whereas the latter datasets as RUS 80 and ROS 80.
4.2.2 Haptic Dataset 2 (HS2). The second dataset consists of 3-D position, force, torque, and ori-entation data. Furthermore, this dataset includes a signature length feature which represents the original length of each recorded signature prior to data preprocessing. In particular, the introduction of signature length information as a separate feature is important since signature-size normalization (performed during data preprocessing) removes information describing the original length of the ac-quired signatures. Moreover, this new dataset of haptic-based handwritten signatures encompasses 1000 signatures acquired from 20 different users (50 signatures/user). The feature vectors in this dataset were normalized (upsampled/downsampled) to a common length of 9601 features (9600 is the
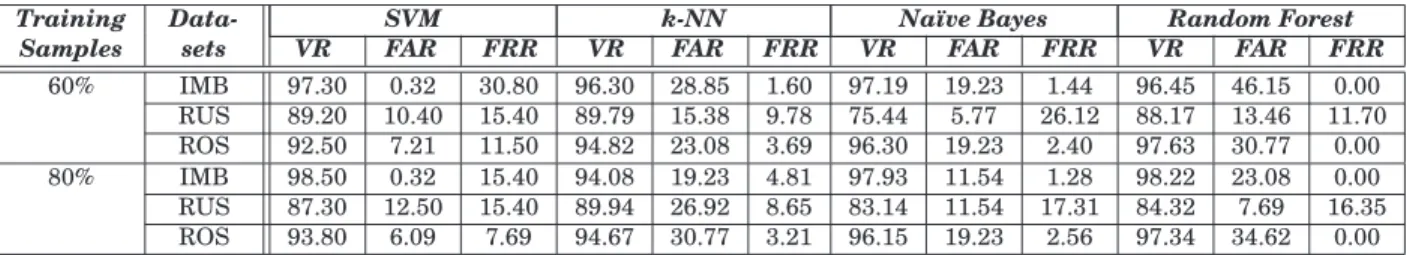
Table I. : Average VR, FAR, and FRR for unbalanced, RUS and ROS datasets for HS1. The results are obtained with parameter-fine-tuning of each reference classifier.
Training Data- SVM k-NN Na¨ıve Bayes Random Forest
Samples sets VR FAR FRR VR FAR FRR VR FAR FRR VR FAR FRR
60% IMB 97.30 0.32 30.80 96.30 28.85 1.60 97.19 19.23 1.44 96.45 46.15 0.00 RUS 89.20 10.40 15.40 89.79 15.38 9.78 75.44 5.77 26.12 88.17 13.46 11.70 ROS 92.50 7.21 11.50 94.82 23.08 3.69 96.30 19.23 2.40 97.63 30.77 0.00 80% IMB 98.50 0.32 15.40 94.08 19.23 4.81 97.93 11.54 1.28 98.22 23.08 0.00 RUS 87.30 12.50 15.40 89.94 26.92 8.65 83.14 11.54 17.31 84.32 7.69 16.35 ROS 93.80 6.09 7.69 94.67 30.77 3.21 96.15 19.23 2.56 97.34 34.62 0.00
length of the 3-D force, position, torque, and orientation data + 1 feature representing the original length of the signature). Similar to Section 4.2.1, the vector length was selected in such a manner to minimize the information loss that is most apparent when downsampling is performed. Consequently, the computed preprocessed dataset contains 1000 instances, where each consists of 9601 features.
Similar to 4.2.1 the preprocessed dataset is therefore rearranged into 20 distinct datasets (one for each class), where in each only the instances of a single class are labeled accept (A = 1), whereas the remaining instances are labeled reject (B = 0). Moreover, The obtained biometric identity verification datasets were then only divided into 60% training and 40% test sets. Considering the (large) size of this dataset, its division into 80% training and 20% testing as was performed on the first dataset was not found to be necessary.
4.3 Gene Expression Programming Algorithm Settings
The GEP experiments were performed using an implementation developed at the National Research Council of Canada [Vald´es et al. 2007], based on the ECJ environment [Luke et al. 2007].
The parameter-values used in the GP experiments were: No. generations = 100000, Population size = 1000, No. chromosomes/individual = 1, No. genes/chromosome = 3, Gene head size = 8, Linking function = addition, No. constants/gene = 2, Bounded range of Constants = [0,10], Inversion rate = 0.1, Mutation rate = 0.044, is-transposition rate = 0.1, ris-transposition rate= 0.1, One-point recombination rate= 0.3, Two-point recombination rate= 0.3, Gene recombination rate= 0.1, Gene transposition rate= 0.1, rnc-mutation rate = 0.01, dc-mutation rate = 0.044, dc-inversion rate = 0.1, Function set (e.g.,
{function1(weight), function2(weight), . . . })= {add(1), sub(1), mult(1), div(1)}.
It can be seen that the mathematical expressions are composed of one chromosome per individual and each chromosome is made from 3 gene expressions, all linked by the addition operator. The gene expressions can be formed using constants, the independent variables associated with each problem, and any of the functions listed. The weightings for the functions allow the user to give a preference to some operators over others. In this case, all operators (addition, subtraction, multiplication, and division) were assigned equal weight values (refer to Section 2.1 for a concise description of the GEP algorithm and its parameters). For each of the presented experiments a set of 100 runs was performed with random seeds. Moreover, it is important to mention that during each run, there are in fact 1000 different functions that are obtained (since the process is initiated with a population of size 1000). This will be further discussed in Section 5.
5. RESULTS
A series of experiments have been performed to evaluate the proposed approach and to illustrate the possible advantages of using genetic programming techniques in a haptic-based identity verification system.
Table II. : Classification results of reference classifiers after applying Subset Size Forward Selection algorithm for HS1. Values in bold denote equal or better results in comparison with Table I.
Training Data- Av. No. of SVM k-NN Na¨ıve Bayes Random Forest
Samples set Attributes VR FAR FRR VR FAR FRR VR FAR FRR VR FAR FRR
60% IMB 149.5 95.86 0.48 48.08 95.71 0.32 51.92 97.34 0.48 28.85 95.71 0.96 44.23 RUS 777.1 82.84 17.31 15.50 88.17 10.90 23.08 79.14 21.79 9.62 77.07 30.62 19.23 ROS 243.1 96.60 0.96 32.75 94.82 0.00 67.31 95.27 4.01 13.46 95.86 1.12 40.38 80% IMB 133.3 96.75 0.33 38.50 96.75 0.00 42.31 97.34 0.32 30.77 95.86 0.00 53.85 RUS 547.8 80.46 19.87 15.50 88.46 10.90 19.23 81.66 18.27 19.23 79.29 21.15 15.38 ROS 219.6 97.34 0.96 23.05 97.04 0.00 38.46 96.15 3.21 11.54 95.86 0.64 46.15
Table III. : Classification results based on the average performance of all GP-generated analytical functions (100 analytical functions per class) using HS1 data set.
60% 80%
Datasets VR FAR FRR No. of No. of VR FAR FRR No. of No. of
(%) (%) (%) Variables Operations (%) (%) (%) Variables Operations
IMB 91.49 5.65 42.85 7.67 22.63 93.88 4.04 31.15 8.41 18.36
RUS 58.29 42.36 33.89 17.61 94.05 60.08 40.72 30.35 15.75 90.09
ROS 89.97 8.14 32.60 6.42 9.28 91.43 6.48 33.58 7.04 9.13
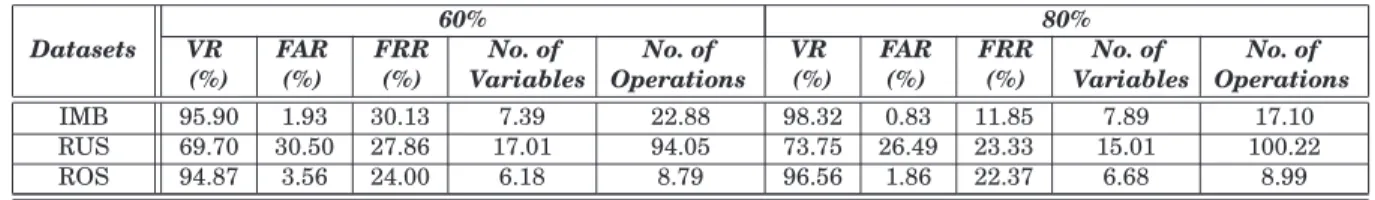
Table IV. : Classification results based on the average performance of the first quartile of the best GP-generated analytical functions (per class) for 13 Users (HS1).
60% 80%
Datasets VR FAR FRR No. of No. of VR FAR FRR No. of No. of
(%) (%) (%) Variables Operations (%) (%) (%) Variables Operations
IMB 95.90 1.93 30.13 7.39 22.88 98.32 0.83 11.85 7.89 17.10
RUS 69.70 30.50 27.86 17.01 94.05 73.75 26.49 23.33 15.01 100.22
ROS 94.87 3.56 24.00 6.18 8.79 96.56 1.86 22.37 6.68 8.99
5.1 Haptic-based Identity Verification using Classical Classifiers
This first experiment is used as a basis for comparison between classical classifiers and genetic pro-gramming techniques when applied to the haptic-based identity verification problem. Specifically, this experiment is conducted in order to observe the binary-classification behavior of classical classifiers (described in Section 2.3) when considering unbalanced, random undersampled and random oversam-pled versions of the haptic-based signatures dataset. The classical classifiers were evaluated using the WEKA environment [Hall et al. 2009], and the LIBSVM [Chang and Lin 2001] tool. Additionally, fine-tuning of the parameters for each reference classifier was conducted using the grid search method and 5-fold cross-validation on the training data. In Table I, the verification success rate (VR), False Acceptance Rate (FAR), and False Rejection Rate (FRR) results using SVM, Na¨ıve Bayes, k-NN, and Random Forest classifiers on haptic dataset 1 for (IMB 60, RUS 60, ROS 60, IMB 80, etc.) are pre-sented. Similarly Table VII presents the classification results for Na¨ıve Bayes, k-NN, and Random For-est classifiers on HS2. It can be observed that preprocessing the data using RUS and ROS techniques resulted in positive and negative outcomes depending on the considered dataset and the selected clas-sifier. For example, in Table I when the SVM classifier is applied, an improvement in FRR is obtained, at the expense of a decrease in the VR and the FAR. This is an encouraging result as it partially solves the class imbalance problem. Another important observation is that, in all cases, when RUS datasets
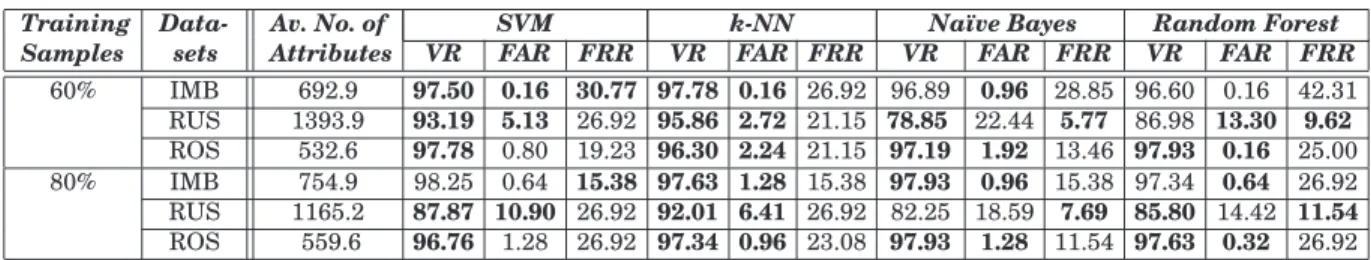
Table V. : Classification results using the union of all the features that appear in the generated GP models (per class) for 13 Users. Values in bold denote equal or better results in comparison with Table I.
Training Data- Av. No. of SVM k-NN Na¨ıve Bayes Random Forest
Samples sets Attributes VR FAR FRR VR FAR FRR VR FAR FRR VR FAR FRR
60% IMB 692.9 97.50 0.16 30.77 97.78 0.16 26.92 96.89 0.96 28.85 96.60 0.16 42.31 RUS 1393.9 93.19 5.13 26.92 95.86 2.72 21.15 78.85 22.44 5.77 86.98 13.30 9.62 ROS 532.6 97.78 0.80 19.23 96.30 2.24 21.15 97.19 1.92 13.46 97.93 0.16 25.00 80% IMB 754.9 98.25 0.64 15.38 97.63 1.28 15.38 97.93 0.96 15.38 97.34 0.64 26.92 RUS 1165.2 87.87 10.90 26.92 92.01 6.41 26.92 82.25 18.59 7.69 85.80 14.42 11.54 ROS 559.6 96.76 1.28 26.92 97.34 0.96 23.08 97.93 1.28 11.54 97.63 0.32 26.92
are considered, a decrease in the VR is achieved (p < 5, Wilcoxon Signed Rank Test [Wilcoson 1945]). This is possibly due to the significantly reduced number of training objects that result when the RUS method is applied. Conversely, in most cases, the use of RUS datasets enhanced the FAR when both Random Forest and Na¨ıve Bayes are exploited (p < 0.05). Thus, RUS is potentially a useful technique when Random Forest or Na¨ıve Bayes classifiers are used. Furthermore, it can be noticed that k-NN, despite its simple nature, achieved results that are nearly equivalent or superior to SVM classifiers. However, k-NN did not achieve any significant improvements in the results when balanced RUS and ROS (Wilcoxon Signed Rank Test [Wilcoson 1945], p > 0.05) datasets are considered.
5.2 Haptic-based Identify Verification using Classical Attribute Selection method
In this section, a recent classical attribute selection method 2.3.5 is used to form a base for comparison between feature selection using a classical machine learning approach and genetic programming. The
subset size forward selectionmethod was performed using the WEKA environment [Hall et al. 2009]. Reduced feature subsets were used as inputs to the reference classifiers. The classification results are shown in Table II and Table VIII when HS1 and HS2 are considered, respectively. In Table II the subset size forward selection method produced a relatively small subset of feature in comparison to the original 10000 attributes with comparable classification performance results. Similar results are observed in Table VIII when HS2 is considered.
5.3 Haptic-based Identify Verification using Genetic Programming
In this section, a series of experiments were performed to investigate the use of genetic programming techniques in haptic-based handwritten signature verification. For each of the 13 subsets (HS1) in
IMB 60, 100 independent GEP runs were conducted, i.e., 100 different analytical functions are gener-ated for the 1st subset, 100 different analytical functions are genergener-ated for the 2nd subset, etc. It is important to mention that during each run, there are in fact 1000 different functions that are obtained (since the process is initiated with a population of size 1000), however, only the GEP model with the best discrimination performance is selected (using the training datasets). This procedure is repeated with the other five computed datasets: IMB 80, RUS 60, RUS 80, ROS 60, and ROS 80. Similarly, for (HS2) each of the 20 subsets IMB 60, 100 independent GEP runs were conducted. The same pro-cedure is repeated for RUS 60 and ROS 60. An analysis of the results is conducted in the following subsections.
5.3.1 Classification. In Table III, the VR, FAR, and FRR results using genetic programming-generated models and on all datasets (IMB 60, RUS 60, ROS 60, IMB 80, etc.) are presented. Specifically, the classification results are based on the average performance of all generated analytical functions i.e., 100 analytical functions per subset (class). However, in order to capture the best GP individuals that
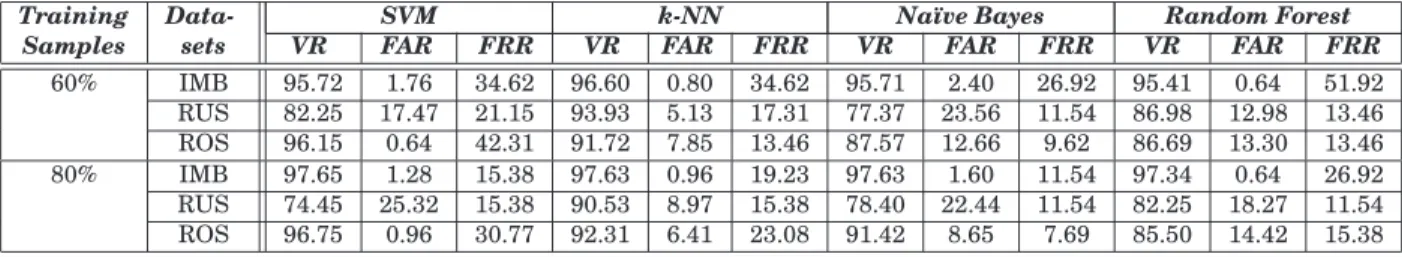
Table VI. : Classification results using the most frequent 100 features that appear in the generated GP models (per class) for HS1.
Training Data- SVM k-NN Na¨ıve Bayes Random Forest
Samples sets VR FAR FRR VR FAR FRR VR FAR FRR VR FAR FRR
60% IMB 95.72 1.76 34.62 96.60 0.80 34.62 95.71 2.40 26.92 95.41 0.64 51.92 RUS 82.25 17.47 21.15 93.93 5.13 17.31 77.37 23.56 11.54 86.98 12.98 13.46 ROS 96.15 0.64 42.31 91.72 7.85 13.46 87.57 12.66 9.62 86.69 13.30 13.46 80% IMB 97.65 1.28 15.38 97.63 0.96 19.23 97.63 1.60 11.54 97.34 0.64 26.92 RUS 74.45 25.32 15.38 90.53 8.97 15.38 78.40 22.44 11.54 82.25 18.27 11.54 ROS 96.75 0.96 30.77 92.31 6.41 23.08 91.42 8.65 7.69 85.50 14.42 15.38
Table VII. : Average VR, FAR, and FRR for unbalanced, RUS and ROS datasets for HS2.
Training Data- SVM k-NN Na¨ıve Bayes Random Forest
Samples sets VR FAR FRR VR FAR FRR VR FAR FRR VR FAR FRR
60% IMB 99.89 0.24 0.10 96.98 2.95 4.50 99.88 0.05 1.5 99.59 0.0 8.25 RUS 98.19 0.07 0.27 96.89 3.07 4.0 94.84 5.36 1.50 98.00 2.08 0.50 ROS 97.08 0.00 2.96 97.35 2.5 5.50 99.84 0.08 1.75 99.63 0.01 7.25
Table VIII. : Classification results after applying Subset Size Forward Selection algorithm on HS2.
Training Data- Av. No. of SVM k-NN Na¨ıve Bayes Random Forest
samples set Attributes VR FAR FRR VR FAR FRR VR FAR FRR VR FAR FRR
60% IMB 73.15 99.45 5.06 0.32 99.49 0.18 6.75 99.83 0.07 2.25 99.64 0.00 7.25 RUS 115.65 98.22 19.23 0.27 99.50 0.29 4.50 94.54 5.72 0.50 95.16 4.97 2.25 ROS 137.1 99.48 5.24 0.28 99.75 0.00 5.00 100.00 0.00 00.00 99.75 0.00 5.00
Table IX. : Classification results based on the average performance of GP-generated analytical functions (per class) for the HS2
dataset when considering (a) all the generated models (analytic functions), and (b) only the first quartile of the best models. (a)
60%
of Data- VR FAR FRR No. of No. of
set (%) (%) (%) Vars Operations
IMB 99.24 0.45 6.59 8.11 11.34 RUS 78.38 22.55 3.86 6.53 9.18 ROS 97.41 2.38 6.54 7.93 11.76
(b)
60%
of Data- VR FAR FRR No. of No. of
set (%) (%) (%) Vars Operations
IMB 99.65 0.16 3.94 8.00 11.53 RUS 86.85 13.92 3.85 6.19 8.05 ROS 98.94 0.86 4.77 7.82 11.20
demonstrate better GP performance, the first quartile of the best GP models (per subset) are selected. Selection is achieved based on each model’s classification accuracy of test data. The average classifica-tion performance of the first quartile of the top GP models is illustrated in Tables IV and IX(b) when HS1 and HS2 are considered, respectively. Several observations can be made from the results depicted in Tables IV and Table IX(b). First, similar to classical classifiers, the results are quite poor when RUS datasets are considered. In addition, it can be noticed that the average number of necessary variables and operations is quite small. This suggests that the GP-generated analytical functions are potentially low in complexity. It is important to mention that the number of variables refers to the number of distinct variables used in the explicit equations (duplication of identical variables are not counted). Conversely, the number of operations includes all arithmetic operations used in each function
(dupli-Table X. : Classification results using the union of all the features that appear in the generated GP models for HS2.
Training Data- Av. no. of SVM k-NN Na¨ıve Bayes Random Forest
Samples set Attributes VR FAR FRR VR FAR FRR VR FAR FRR VR FAR FRR
60% IMB 687.2 99.71 1.84 0.21 99.36 0.41 5.00 99.90 0.01 1.75 99.69 0.00 6.25 RUS 473.8 99.09 10.50 0.08 99.31 0.53 3.75 95.20 5.03 0.50 96.00 4.14 1.25 ROS 585.95 99.93 0.00 0.08 98.80 1.02 4.50 99.88 0.05 1.25 99.68 0.00 6.25
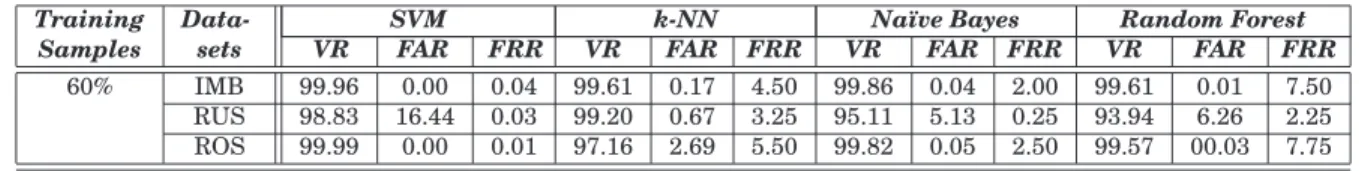
Table XI. : Classification results using the most frequent 100 features that appear in the generated GP models for HS2.
Training Data- SVM k-NN Na¨ıve Bayes Random Forest
Samples sets VR FAR FRR VR FAR FRR VR FAR FRR VR FAR FRR
60% IMB 99.96 0.00 0.04 99.61 0.17 4.50 99.86 0.04 2.00 99.61 0.01 7.50 RUS 98.83 16.44 0.03 99.20 0.67 3.25 95.11 5.13 0.25 93.94 6.26 2.25 ROS 99.99 0.00 0.01 97.16 2.69 5.50 99.82 0.05 2.50 99.57 00.03 7.75
cation of identical operations are counted). The average performance over all GP models is considered in Table III and Table IX(a). For the IMB and the ROS datasets, their classification performance is comparable (slightly lower for ROS) but somewhat lower w.r.t. the classical classifiers.
However, for HS1, only an average of 7.67 and 6.42 attributes were used by GP when considering the IMB and ROS datasets, respectively. This is in contrast to the original 10, 000 attributes exploited by the reference classifiers as well as the 149.5 (ROS) and 243.1 (IMB) attributes exploited by the reference attribute selection method (subset size forward selection). Conversely, for HS2, only an average of 8.11 and 7.93 attributes were used by GP when considering the corresponding IMB and ROS datasets, respectively. This is in contrast to the original 9601 attributes exploited by the reference classifiers as well as the 73.15 (ROS) and 137.1 (IMB) attributes generated with the subset size forward selection method. For the RUS dataset GP performance degrades, but the amount of available training instances becomes very small (12 and 16 for the 60% and 80% training sets respectively when HS1 is considered). The FAR for IMB and ROS sets is better than many of the corresponding results described in Table I, whereas for the RUS sets, the opposite is observed. Relatively simple equations (i.e., fewer operations) were required by the GP models for IMB and ROS but not for RUS. Hence, allowing more complex models (possibly extending the GEP function set as well) may result in an increase in performance.
The results of Table I and Table VII were obtained with the optimal choice of parameters for the reference classifiers (something that was not done for GP as default parameters were considered). A more balanced comparison can be made by creating an ensemble model using those in the first quar-tile of the classification accuracy empirical distribution. Then, the IMB and ROS results (Table IV and Table IX(b)) are equivalent to (and in certain cases better than) those of the reference classifiers and reference attribute selection method. However, considering that the results of the reference classi-fiers are obtained using fined tuned parameters, makes GP results more appealing. Furthermore, and very interestingly, this was performed using a very small subset of attributes (6.18 to 7.39 for [HS1], and 7.93 to 8.11 [HS2]). This is also (slightly) smaller than when all models are considered (Table III and Table IX(a)). This model selection approach used the test data as validation, only for illustration purposes. Future studies will consider a separate validation dataset. For the reference classifiers it is observed (when considering HS1) that classification performance might in certain cases degrade with an increase in the size of the training set (from 60% to 80%) (Table I), whereas for GP (Table III)
the performance consistently improved regardless of the sampling type. GP classification performance (with a simple function set and without parameter tuning) is comparable to that of well established reference classification methods with optimized parameters. This was most apparent when IMB and ROS datasets were considered. However, on average less than 10 attributes were typically exploited by GP, as opposed to the original 10, 000 (HS1), 9601 (HS2) attributes used by the reference classifiers. 5.3.2 Feature Reduction. It can be observed from Table V and Table VII that when the attributes,
selected as in Eq-4 (RVp,FGP), are used for learning with the reference classifiers, their overall
per-formance increases. In fact, it can be seen that in many cases the achieved results outperform those obtained when the entire original set of 10, 000 attributes (shown with bold characters in Table V) are considered. For example, a significant enhancement in classification performance with the k-NN clas-sifier is observed (HS1), especially the FAR which, as previously discussed, is a very critical measure in user identity verification. This behavior is remarkable since only 5% to 7.5% of the original number of attributes were involved, which is a formidable dimensionality reduction. Similarly, from Table V, it can be observed that when the ROS 60 dataset is considered a 97.78% with a 0.80% FAR is obtained with the SVM classifier. This is a very good result, especially when compared to previous work [Saddik et al. 2007; Orozco et al. 2008] where a maximum VR of 98% was achieved with, however, a poor FAR of 25%. Furthermore, a maximum of 100% with 0% FAR and 0% FRR was achieved in Table VIII and comparable results achieved when considering the subset of the most frequent features obtained from GP models (Table XI), and when the first quartile of the best GP models are selected (Table IX(b)).
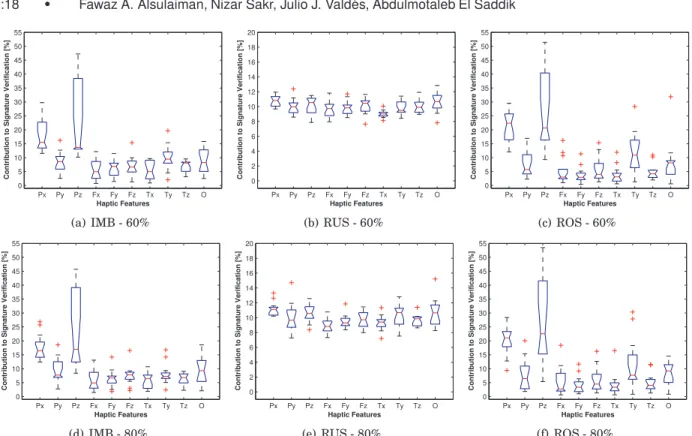
Furthermore, in an extreme feature reduction experiment (Table VI and Table XI), only 1% of the original attributes were used. However, performance decreased only slightly when analyzing HS1, and increased when HS2 was considered. This reduction rate can be made variable, thus allowing a flexible approach. In any case, this feature reduction strategy still involves more attributes than those obtained using GP-based learning as it was discussed in Section 5.3.1 (Tables III, IV, IX(a), and IX(b)). 5.3.3 Relevance of Haptic Data Types in Identity Verification. Fig. 2 present box plots of the fre-quency of different haptic data types that appear in GP-generated models when the IMB, RUS, and ROS datasets (HS1) are considered respectively. Each box has lines at the lower quartile, the median, and the upper quartile values. Lines extending from each end of the box (whiskers) are provided to show the extent of the frequency of different haptic data types found in the generated GP-models. Out-liers are represented using the ‘+’ symbol and consist of frequency values that go beyond the ends of the whiskers. It can be observed that the frequency plots of the RUS datasets differ significantly from those associated with the IMB and ROS datasets. However, RUS datasets considered in this work ap-pear unreliable (when using GP) as their classification results were consistently low, as depicted in
Tables III and IV. In addition, from Figs. 2(a)(d)(c)(f), it can be noticed that position information (Px,
Py, and Pz) appeared in GP models with a probability of approximately equal to 0.5. Accordingly, all
haptic-specific data types combined, i.e., force, torque and orientation (Fx, Fy, Fz, Tx, Ty, Tz, and O),
also appeared in GP-models with a probability of approximately equal to 0.5. This is an interesting result as the apparent importance of haptic-specific data types suggests that haptic-based signatures can potentially outperform traditional handwritten signatures (in user identity verification systems) as the latter rely strictly on position information.
6. CONCLUSIONS
Identity verification based on high-dimensional haptic information has been investigated using GP-based and classical classification techniques, as well as classical attribute selection techniques. The cases of unbalanced, undersampled and oversampled datasets scenarios were considered. A compar-ative performance of GP classifiers with respect to reference classical methods was initially studied.