AUTOMATIC PROFILER-DRIVEN PR OBABILISTIC COMPILER OPTIMIZATION by
Daniel Coore
Submitted to tle
I);EPARTMENT OF ELECTRICAL ENGINEERING AND COMPUTER SCIENCE in partial fulfillmenlt of the requirements
for the degrees of BACIIELOR OF SCIENCE
alnd
MASTER OF SCIENCE at thle
MASSACHUSETTS INSTITUTE OF TECHNOLOGY June, 1994
(Daniel Coore, 199/1. All rights reserved.
The author hereby grants to MIT permissionl to reproduce and to
distribute copies of this thlesis documellt in whole or in part.Signature of Author
-.
Dept. of Electrical Elginejng and Compter Science, May 15,1994
Certified by
Thomas Knight Jr., Prinlcip/Researfh Scientist, Thesis Supervisor
Certified by
Dr.e ter Oden, Company Supervisor, IBM
. /·h. · t. Accepted b F. R. I -3
Automatic Profiler-Driven Probabilistic Compiler Optimization
by
Daniel Coore
Submitted to the Department of Electrical Engineering and Computer Science
on May 15, 1994 in partial fulfillment of therequirements for the Degrees of Bachelor of Science and Master of Science in Computer Science
Abstract
We document the design and implementation of an extension to a compiler in the IBM XL family, to automatically use profiling information to enhance its optimizations. The novelty of this implemen-tation is that the compiler and profiler are treated as two separate programs which communicate through a programmable interface rather than as one integrated system. We also present a new technique for improving the time to profile applications which resulted from the separate treatment of the compiler and profiler. We discuss the design issues involved in building the interface, and the advantages and disadvantages of this approach to building the feedback system.
As a demonstration of the viability of this implementation, branch prediction was implemented as one of the optimizations using the feedback mechanism. The benefits of the implementation are evident in the ease with which we are able to modify the criterion that the compiler uses to decide which type of branch to penalize.
We also address some of the theoretical issues inherent in the process of feedback-based optimization by presenting a framework for reasoning about the effectiveness of these transformations.
VI-A Company Supervisor: Dr. Peter Oden
Title: Manager, Compiler Optimization Group, Dept 552C Thesis Supervisor: Thomas F. Knight Jr.
Acknowledgements
Peter Oden, my supervisor, and Daniel Prener, a second supervisor of sorts, spent much time helping me with many of the technical problems I encountered in the implementation; without their patience and willingness to help, I would never have completed it.
Ravi Nair wrote the profiler and provided all the technical support for it that I needed for this thesis. He also contributed a major part to the efficient node profiling algorithm
developed. Jonathan Brezin, as well as the rest of the RS6000 group, provided much support during my time at IBM.
Equally important was the support I received, while back at MIT, from the AI Lab Switzer-land group. They readily accepted me as one of the group, and helped me prepare my oral presentation. Michael "Ziggy" Blair provided valuable insight into aspects of the subject matter that I had not considered before. Tom Knight provided useful guidance in the presentation of this thesis.
Throughout the development of this thesis, I have relied on many friends for support and guidance. Radhika Nagpal helped me define the thesis when all my ideas were still vying for my attention in the early stages. Bobby Desai provided precious time listening to my raw ideas, and helping me refine them-he perhaps, knew more about my thesis than anyone else. Sumeet Sandhu helped me endure through the long arduous hours and helped me keep my wits about me.
All my friends from home who were always interested to know the progress of my thesis helped me stay on track, Tanya Higgins in particular has my wholehearted appreciation for that. Last, but by no means least, I owe many thanks to my family; to whom I could turn when all else failed, and who have been very supportive throughout the entire endeavour. Finally, I offer a prayer of thanks to my God, the source of my inspiration.
Contents
1 Introduction And Overview
12
1.1 Introduction . . . ... 12
1.1.1 Background ... 12
1.1.2 Implementations of Feedback Based Compilation ... . 13
1.1.3 Motivations . . . 13
1.1.4 Objectives. . . . ... 14
1.1.5 Features of This Implementation . .. . . 14
1.2 Overview of The Implementation ... 15
1.2.1 Compiling With Feedback ... 16
1.2.2 Unoptimized Code generation ... 16
1.2.3 Flowgraph Construction ... 17
1.2.4 Profiling The Unoptimized Code ... . 18
1.2.5 Annotating The Flowgraph. ...
19
1.2.6 Optimized Code Generation. ... 19
1.3 Summary and Future Work ... 19
1.3.1 Summary ... ... 20
1.4 Bibliographic Notes ... 20
2 Design and Implementation
22
2.1 Designing The Feedback Mechanism . ... 222.1.1 Necessary Properties for Feedback. ... 23
2.1.2 Types of Data to Collect. . . . ... 23
2.2 The Implementation ...
2.2.1 The Compiler ...2.2.2 Producing Code for the Profiler . 2.2.3 Reading Profiler Output ... 2.2.4 Identifying Profiler References 2.2.5 Interfacing with the Compiler . . 2.3 The Profiler ...
2.3.1 The xprof Profiler. 2.4 Bibliographic Notes. ...
3 Efficient Profiling
3.1 Introduction .
3.1.1 Description of the Problem ... 3.1.2 Efficient Instrumentation ... 3.2 Background To The Algorithm ... 3.3 Description of The Algorithm ...
3.3.1 Choosing the Edges to be Instrumented ... 3.3.2 Instrumenting the Chosen Edges ... 3.3.3 Computing the Results ... 3.4 Correctness of the Algorithm ... 3.5 Optimality of The Algorithm ...
3.5.1 An Alternate Matrix Representation ...
3.5.2 Bounds for the Number of Instrumented Edges ...3.5.3 Precisely Expressing the Required Number of Instrumented
3.5.4 Proof of Optimality ...
3.6 Running Time of the algorithm ... 3.7 Matroids. ... 3.8 Summary of Results. 3.9 Discussion ... 3.10 Bibliographic Notes. ... . . . . . . . . . . . . .. . . . . · .. . . . ·. . . . . . . . . . . . . . . . . . . . . . . Edges . · . . . . . . . . . . . . . . . . . . . . 25 26 26 27 27 28 29 30 30 31 31 31 32 33 34 36 36 37 37 38 39 40 42 44 46 47 47 48 49
...
...
...
...
...
...
...
...
...
4 Optimizing with Feedback
4.1 Introduction .
4.2 Trace Based Optimizations ... 4.3 Non-Trace-Based Optimizations ...
4.3.1 Using Execution Frequencies ...
4.3.2 Using Other Types of Feedback Information
4.4 Branch Prediction ...
4.4.1 Implementing the Transformation ...
4.5 Bibliographic Notes. ...5 A Theoretical Framework for Evaluating Feedback-Driven
5.1 Introduction .
5.2 The Generalized Framework ...
5.2.1 An Input-Independent Assessment Function. 5.2.2 Quantitative Comparison of Transformations .... 5.3 Cycle-Latency Based Assessment ...
5.3.1 Parameter Specification.
5.3.2 Handling Infinite Loops ... 5.3.3 Computing the Average Cost ...
5.4 Graph Annotation ...
5.5 Analysis of Branch Prediction ... 5.6 Bibliographic Notes. ...
6 Conclusions
6.1 Evaluation of Goals ...
6.1.1 The Design and Implementation 6.1.2 The Optimizations ... 6.1.3 Theoretical Analysis ... 6.2 Future Work.
6.2.1 The Node Profiling Algorithm ..
[O
pt imizat ions
.oo .. .. .. . .. . . .. . .o . .. ... . . . .. .,.,. ·. ** . .. ... .* ., . , ,. o. o ., ., . , ,. ,. o 50 50 51 52 52 53 53 54 55 57 57 58 59 60 61 61 62 64 64 65 6667
67 67 68 68 69 70...
...
...
...
...
...
...
...
...
...
...
...
...
...
6.2.2 Optimizations ... ... 70
6.2.3 Theoretical Issues ... 71
A The Specification File
72
A.1 Profiler-Related Commands ... 72A.2 Parsing The Profiler Output ... 72
A.3 Accumulation Switches ... 73
A.4 Computing Annotation Values ... . 74
B Invoking The Compiler
75
List of Figures
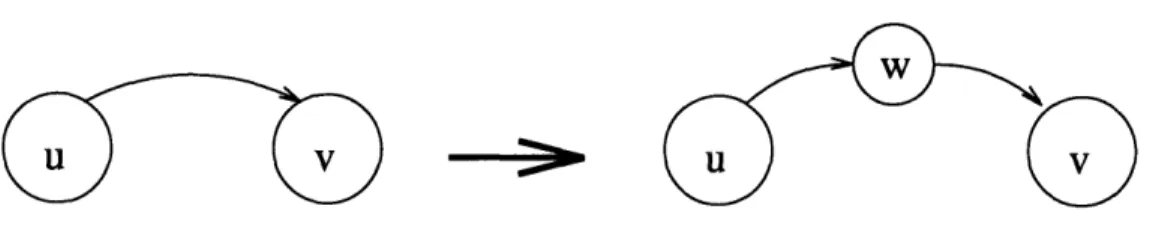
3.1 Replacing an edge with an instrumenting node ... 34
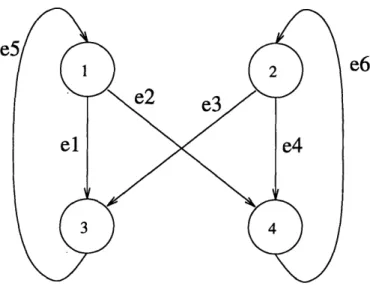
3.2 An example of a control flowgraph. ... 36
3.3 Redundant Node Information ... 48
4.1 Reordering Basic Blocks for Branch Prediction ... 54
4.2 Inserting Unconditional Branches to Reorder Instructions ... 55
4.3 Filling the Pipeline between Branch Instructions ... 56
Chapter 1
Introduction And Overview
1.1 Introduction
Traditionally, the transformations performed by optimizing compilers have been guided solely by heuristics. While this approach has had partial success in improving the running times of programs, it is clear that heuristics alone are not sufficient to allow us to get as close to optimal performance as we would like. What is needed is profiling to detect the hot
spots of the program so that transformations can focus on these areas [1].
1.1.1
Background
In the majority of compiler implementations, if any profiling was used, it was done manually, as a separate process from compilation. The data from the profiling would then be used (manually) either to modify the source code, or to provide hints to the compiler so that it would do a better job. Ideally, we would like that feedback be provided automatically to the compiler and for it to be fully dynamic. The compiler should be able to compile code, profile the execution of the output, and then attempt to recompile based on the additional information from profiling. The whole process would probably have to be iterated over several times until a satisfactory proximity to optimality was achieved - even this state would not be a final one, since the application would be recompiled as its usage pattern changed.
The idea of automatically providing feedback to the compiler to improve the effects of its optimization phase has been attempted, but research in the area has been scant. Most of the past work has emerged in connection with research on VLIW machines, however
with the decline in popularity of that architecture - particularly in industry - research in
feedback based compiler optimizations has flagged commensurately.Probably the earliest works involving feedback based compilation were done by Fisher [11]. He described Trace Scheduling as a technique, relying on information from a profiler, to determine paths through a program which were most likely to be executed sequentially. Ellis describes in detail [9], the implementation and application of Trace Scheduling to compilation techniques. Both Ellis' and Fisher's works were produced through investigative
efforts in VLIW architecture.
More recently, there have been other efforts at using feedback from profilers to direct com-piler optimizations. The bulk of this effort has come from the University of Illinois where an optimizing compiler using profiler information has already been implemented and is cur-rently being maintained [4]. Most of the background research for this thesis was centered
around the research results of that compiler.
1.1.2 Implementations of Feedback Based Compilation
One of the important problems with feedback based optimization is that it is inherently ex-pensive both in time and space. First, the need to profile when tuning is desired means that compilation time will now be dependent upon the running time of the programs compiled'. The space problems arise because of the need to constantly recompile applications. If a fully dynamic system is to be realized, the compiler must be readily accessible-probably lying dormant within the runtime system, but ready to be invoked whenever it is deemed necessary to recompile an application. In a sense, the compilation process is distributed over much longer periods which means that data structures have to be maintained between optimization attempts, thereby increasing the space required for the runtime system and the whole compilation process in general. Under this ideal view, compilation is an ongo-ing process and continues for as long as the application is beongo-ing used. While there are no implementations of such a system, there are many of the opinion that it is an attainable ideal [8], and in fact, one that represents the next generation of compiler and runtime-system interaction [3].
In all the implementations documented, the system implemented was a compromise between the way compilation is currently done and the ideal described above. Typically, there was a database per application which was updated everytime the application was profiled. The compiler was called manually whenever there was a chance for improvement in the application's performance. The profiler was called automatically from the compiler, and the recompilation using the additional profiled data was also done automatically.
Given the computing power available today, this implementation is a reasonable compromise since our present technology lacks the ability of self-evaluation that the compiler would need to be able to automatically determine when recompilation was advisable. By automating the compiler-profiler interaction, much of the tedium is expedited automatically. At the same time, maintaining manual control over the frequency of compilation ensures that the runtime system is not spending too much time trying to make programs better without
actually using them.
1.1.3
Motivations
The idea of using feedback to a compiler to improve its optimization strategy has never been very popular in industrial compilers and has remained mostly within the academic research domain. The IBM XL family of compilers is not an exception, and we would like to explore 1Profilers usually limit the amount of data collected. So there will be an upper bound on the running time, though it may be quite high.
the costs and benefits of implementing such a feedback system within the framework already present for these compilers.
In light of rapidly increasing size and scope of application programs and the constant de-mand for efficiency, coupled with ever increasing processor speeds mollifying concerns about the time investment required, we feel that it is worthwhile researching this approach to compiler optimization. Also, from an academic standpoint, the large space of unexplored problems in this area promise to provide exciting research with highly applicable results.
1.1.4
Objectives
This thesis will describe the design and implementation of such a feedback based compiler system with a specific focus on the RS6000 super scalar architecture. We hope also to address some theoretical issues inherent in the process which are still largely unexplored. The primary focus will be on the design issues involved in the implementation of the feed-back mechanism within the XL family of compilers. The secondary goal is a two-pronged endeavour: a theoretical approach to reasoning about the effectiveness of feedback-based optimizations, and an exploration of the ways in which feedback information can be applied.
1.1.5
Features of This Implementation
One important difference between the goals of this thesis and the implementations afore-mentioned is that the compiler and the profiler are considered as separate tools, which can be enhanced separately as the need arises. In the past implementations, the profiler was incorporated into the compiler and the two functioned as a single program. While there are certain advantages to this type of implementation such as greater efficiency, the compiler is restricted to receiving only one type of feedback information -whatever the embedded profiler happens to return. Having the option to easily change the profiling tool allows greater flexibility in the type of information fed back, and can for example, be invaluable in investigating how changes in program structure affect various run-time observables. Another difference in this implementation is that this work was an extension of an existing compiler to allow it to take advantage of the additional information (from profiling). This
fact meant that there were several imposed constraints that restricted the solutions to some
problems that would otherwise have been solved by the past implementations. For example, the order in which optimizations were done was critical in the compiler, and this restricted the points in the optimization phase at which the feedback data could be used.Finally, we would like to point out that this implementation does not attempt to achieve the ideal setting of a dynamic compiler constantly recompiling applications as the need arises. It is still invoked manually, as the user sees the need for improvement in the code, but it does perform all the profiler interaction automatically. While this approach is not ideal, we feel that the results that this research yields will provide important groundwork for implementing the ideal environment described earlier.
Theoretical Work
Although much work has been done to show the experimental success of feedback based optimizations, those experiments were performed under very controlled environments. Typ-ically the results of those experiments, and their ramifications, were specific to the particular programs compiled. These results were often used to cite the benefits of the particular op-timization under investigation, but we would like to be able to show with more confidence that the optimization is valuable in general (i.e. "on average") rather than merely for the programs that happened to be in the test suite. Although attempts have been made to theoretically model the behaviour of feedback-based optimizations, no models have been able to predict their stability nor even evaluate the suitability of an input as a predicting
input2 to the application.
While the design and analysis of such a model in its full specification is an ambitious task, one of the goals of this thesis was to address the issues involved with that task. Although the model developed is incomplete in that its accuracy has not been measured, we present some of the necessary features of any such model and put forward arguments for why the model is reasonable. We have presented the model, despite its incompleteness, in the hope that it will provide essential groundwork for furthering our understanding of the subject matter. Any progress in this direction will help to solidify cost-benefit analyses and will certainly further our understanding of program-input interaction and the relationships between program structure and program performance.
1.2 Overview of The Implementation
The feedback system was designed to allow the most naive of users to be able to use it without having to worry about issues that were not present before the feedback mechanism was introduced. At the same time we wanted to make it powerful enough to allow much flexibility in the manipulation of the statistical data without exposing more details of the compiler than were necessary. The few aspects of the feedback mechanism which require user interaction are hidden from the user who is not interested in them, through the use of suitable defaults.
In this manner, the user who simply wants the benefit of feedback in optimization need not worry about the type of profiler being used or any of the other issues that are not directly related to the application itself. At the same time, another user who wanted to see the effects on a particular optimization when decisions are based on different types of statistics (which may need different profilers to provide them) could specify this in a relatively painless
manner without having to know anything about the internals of the compiler. Note however,
that the second user would have to know more about the system than the first, in order to be able to change the defaults as appropriate. The general idea is to provide suitable layers of abstraction in the system that expose only as much detail as is desired by users without compromising the benefits of feedback based compilation.2
A predicting input is one which is used with the application at profile time to provide statistics that may guide the optimizations later.
1.2.1 Compiling With Feedback
There are two phases to compilation. The high-level decomposition of the whole process is as follows:
1. Phase 1
(a) Generate unoptimized executable code from source (b) Construct the corresponding control flowgraph 2. Phase 2
(a) Profile the unoptimized code from phase 1 (b) Annotate the control flowgraph with the statistics
(c) Generate optimized code based on both feedback information and on traditional heuristics
All this is abstracted away from the user through a high level program which manages the processing of the two phases without input from the user. This high level program is the vehicle through which the user interface is presented since this is the only program that the user needs to be aware of to use the feedback mechanism.
1.2.2 Unoptimized Code generation
The first phase is mainly concerned with generating executable code in a manner that preserves some kind of context about the instructions so that when the profiled data is
returned, the compiler knows to which instructions the statistics pertain. Since the compiler
is called twice, it must be able, in the second phase, to reproduce the flowgraph generated in the first phase, if it is to perform different operations on the output code in both phases with any level of consistency between the phases.To achieve that consistency, the code is largely unoptimized so that the second phase will generate the same flowgraph as the first phase does. Were the code optimized within the first phase, then the profiler, which looks at the object code produced, would provide data on instructions that the compiler would have difficulty tracking the source of. This difficulty arises because of the extensive transformations that occur when optimization is turned on within the compiler. Therefore, when the profiler returned a frequency count for a particular basic block, the compiler would not necessarily be able to figure out the connections between the flowgraph at the early stages of compilation and that basic block. The alternative would have been to have the compiler fully optimize in both passes, so that the flowgraphs would be consistent between phases, but unfortunately the implementation of the compiler does not allow certain optimizations to be repeated. Therefore, if the code were fully optimized before the statistics from profiling could be obtained, the code would not be amenable to several of the possible transformations that take advantage of the feedback data.
Actually, the requirement for producing a consistent mapping from profiled data to data structure is less stringent than pointed out above. We really only need to capture the feed-back data at some point in the optimization phase, and then introduce that data at the same
point in the second phase (see Chapter 2). The reason for this particular implementation strategy is that the compiler assumed would attempt to do all the optimizations it knew about if optimizations were turned on. Only if they had been disabled from the command line, would they be ignored. This user directed choice of optimization, while a good idea in general, caused a problem in identifying a point in the optimization process that could
be repeatedly reached with the same state on every pass. The problem is that once a point
in the process has been chosen, we want to turn off all the optimizations that come after that point, and go straight to the next phase of compilation (register allocation in thisiplementation). However, a simple jump to the next stage is not good enough because there
were some processes that had to always be done, but which followed optimizations that were conditionally done. Therefore, the solution would have been to find all the essentialsubroutines that had to be executed and then ensure that no matter which point was
cho-sen to capture the fedbakc data, all those subroutines would get executed. It was difficult,though not impossible, to separate these subroutines from the conditional optimizations,
and so we opted for the extreme choices of all or no optimizations.It turned out that there were a few optimizations that could be performed early and were repeatable and so could be done in the first phase. Ideally we would have liked to optimize the code as much as possible, while observing all the constraints imposed. The executable generated from the first phase has to be profiled on several inputs, which means that it must be executed for each of those inputs. The profiling process is the bottleneck in the whole compiilation process and so it is highly advantageous to have this code run as fast as possible.
Perhaps the biggest drawback to having the profiler and compiler separated is that there is no a priori means of communication between the two tools. Specifically, there is no way for
the compiler to associate the frequency data returned by the profiler, with the instructions
that it generates. Typically the profiler returns the addresses of the instructions along with
the frequencies of execution, but this is useless to the compiler since the addresses were assigned at bind (link) time which happens after compilation is done. The solution usedby this implementation was to use the space in the object format for line numbers to store
unique tags per basic block. The profiler could return the line number (actually what it
thought was the line number) with the instruction frequencies and the compiler would use that "line number" to decipher which instruction was being referenced and hence figure out its execution frequency. This solution has the advantage that many profilers will alreadyhave the ability to return line numbers along with instructions so that the compiler is still
easy to be compatible with. The disadvantage is that the association set up with this scheme is rather fragile, and so does not make keeping databases of profiled runs feasible since minor changes in the source will cause a complete breakdown of the tag to basic block associations.1.2.3
Flowgraph Construction
Compilation is done on a per file basis which is further broken down on a per procedure basis. A flowgraph is built for each procedure in the file. Originally, only one flowgraph was constructed at a time, and was processed all the way to code generation before processing the next procedure. In the modified implementation, we constructed all the flowgraphs for
the procedures at once, so that when the statistical data was read in the second phase, only one pass of the data file would be necessary. This approach is more efficient in terms of time since the interaction with the file system is reduced to a minimum, however there is a corresponding space tradeoff since all the flowgraphs have to be contained in memory at once. In practice, this memory constraint does not prove to be a problem because files are typically written to contain only one major procedure. It is extremely rare that files contain several large procedures.
One of the types of information that is used by most transformations is the frequencies of flow control path traversals (edge frequencies). However, this information can be expensive to obtain if the profiler does not have any more information than the program and inputs it is given to profile. In previous implementations where the compiler and profiler are integrated, the profiler can analyze the flowgraph and then decide how to optimally profile
it to obtain all the desired information. This feature is lost in this implementation since
the profiler and compiler are separated, however the edge frequency information is still as important. The solution was to require that the profiler be able to produce frequency counts for basic blocks - the nodes of the control flowgraph - and place no constraints on its ability to produce edge information. This requirement also had the side effect of making compatibility easier. In order to obtain the edge frequencies solely from the node frequencies, the compiler had to modify the flowgraphs so that there would be enough node information returned by the profiler to solve for the edge frequencies. The modification was done according to a newly developed algorithm which is based on the fact that control flow obeys Kirchoff's current law at the nodes of the flowgraph. The algorithm modifies the flowgraph optimally in the sense that the minimal number of edges are instrumented, and it works on arbitrary topologies of flowgraphs.Since in this stage, no data is available to actually solve for the edges, each edge is annotated with a symbolic expression which represents a solution in terms of the node frequencies and possibly other edge frequencies, which are all determined immediately after profiling. After the profiling is done, the actual numbers are substituted into the expressions which are then evaluated to yield the frequencies for the edges. The details of the implementation and the algorithm including arguments for its correctness and optimality are given in Chap-ter 3, however the details therein are not necessary for appreciating the practicality of the
algorithm.
1.2.4
Profiling The Unoptimized Code
The interaction between the compiler and profiler is summarized in a specification file. This file contains all the templates for reading the output of the profiler, and also all the instructions for invoking the profiler. This file is actually provided by the user, but by producing default ones for popular profilers, casual users need not have to worry about its details.
The other requirement for profiling the code is the data set on which the code should be executed while it is being profiled. This is provided through yet another file which contains all the inputs to the application that the user would like the code to be profiled with. Each line of this input file contains exactly the sequence of characters that would come after the invocation of the program under manual control. Although all users must specify this file
and create it themselves, it is a relatively painless process, since the data that is put into this file is no more than the user would have had to know about in any event. The data presented within this file is called the predicting input set since these are the inputs which ultimately get used as a basis for assigning probabilities to each branch of the flowgraph. Thus they "predict" which paths through the flowgraph are likely.
1.2.5 Annotating The Flowgraph
The profiler produces one output file per profiled run which is done once per input in the input file. Therefore, at the end of the profiling stage, there are as many profiler output files as there are inputs in the input set. The frequencies for the basic blocks, produced in each file, are accumulated and then associated with the appropriate tag for the basic block (the tag was produced within the file along with the basic block it was associated with). These accumulated values are then used to annotate the appropriate node of the appropriate flowgraph - as dictated by the tag. The final step in the annotation process
is to substitute the actual accumulated values into the expressions computed for the edge
frequencies in the flowgraph construction stage to yield the values for the accumulated edge frequencies of the flowgraph.1.2.6
Optimized Code Generation
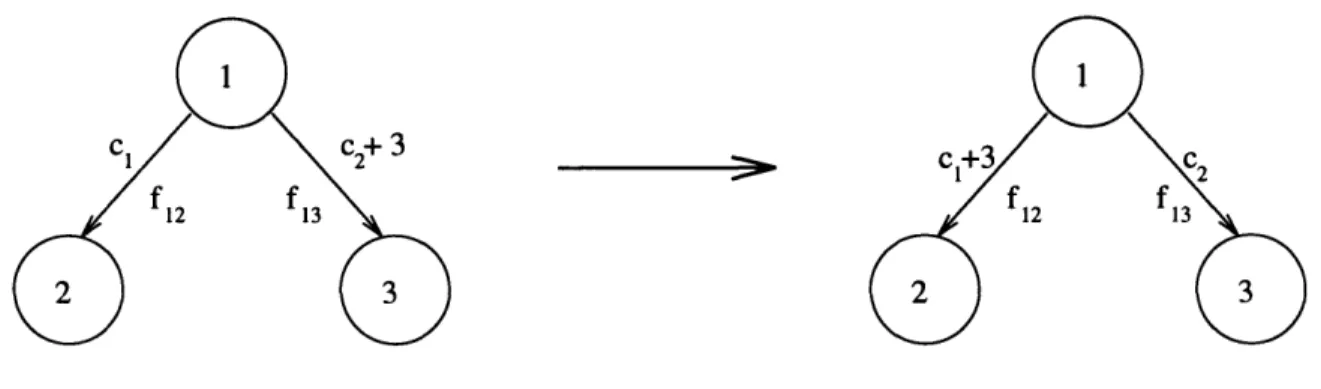
Although there are several different optimizations that are possible with feedback informa-tion available (see Chapter 4), we had enough time to implement only one of them - namely branch prediction. Even so, it was only implemented for handling the limited case of an occurrence of an if-then-else construct. This optimization was heavily machine dependent and will only be beneficial to machines with uneven penalties for conditional branch paths. This optimization was apt for the RS6000 which has a branch penalty of up to three cycles for conditional branches taken and zero cycles for conditional branches not taken;
uncondi-tional branches have zero penalty provided there are at least three instructions before the
next branch at the unconditional branch target address.
The compiler assigned probabilities to each edge based on the frequencies measured from the flowgraph annotation stage. Each edge was also assigned a cost dependent upon the inherent cost of traversing that edge and upon the number of instructions within the basic block to which the edge led. From these two quantitites, a weighted cost was computed and was compared with that of the other edge leaving the same node. If the edge with the higher weighted cost was sufficiently high (that is, above the other by some fixed threshold) then
the compiler ensured that that branch corresponded to the false condition of the predicate of
the conditional branch instruction. In this manner, edges with larger latencies and smaller probabilities are penalized more than those with smaller latencies and larger probabilities.1.3 Summary and Future Work
In our paradigm for the user interface, we wanted to go even further and provide a means of abstractly specifying optimizations in terms of the transformations they would represent
on the control flowgraph. This would have been achieved by developing a language for
manipulating the internal data structures of the compiler that could simultaneously refer to
data being produced by the profiler. This would have allowed yet another level of user -namely the compiler researcher - a convenient abstraction to the compiler. Already there are two extremes of users who are accommodated: the naive user who is not concerned with the details of the profiler being used, and the performance-driven user who is constantly attempting to find the most suitable type of statistics for yielding the best improvement in code performance. The third type of user would have been the user who not only was interested in the type of statistics being used, but also with what was being done with thestatistics.
This extension to the compiler interface is a major undertaking however, and could not be accomplished within the time frame set out for this thesis. An implementation of such an interface would prove to be extremely useful since it would not be necessary for someone to understand the internals of the compiler before being able to specify an optimization. Numerous other optimizations could have been implemented as they have been in the other implementations of feedback-based systems. For example, the entire family of trace based optimizations would make excellent use of the feedback information and would have prob-ably yielded favourable performance enhancements. These optimizations, although highly applicable were not focussed upon since their effects have been widely investigated with positive results. Other optimizations which could not be completed in time, but which would be interesting to investigate include applications of feedback to code specialization and determining dynamic leaf procedures3
1.3.1 Summary
Although rudimentary in its implementation, and lacking many of the interesting uses of feedback data, the feedback based compiler has provided useful information about dealing with feedback systems and has raised many issues to be further researched. This thesis established a modular implementation of a compiler with a feedback mechanism to guide its optimizations. The knowledge obtained from tackling the design problems that arose in the implementation will provide useful guidelines to future implementations. One of the useful results is that the expense of profiling arbitrary programs can be reduced by reducing the amount of instrumentation that would normally be done. This reduced cost of profiling enhanced the viability of a modular implementation since under normal circumstances the profiler would not have information available in integrated implementations and would therefore be expensive to run in the general case. We have also developed a framework for assessing the effect of optimizations on programs using feedback information.
1.4 Bibliographic Notes
Aho, Sethi and Ullman state that we can get the most payoff for the least effort by using profiling information to identify the most frequently executed parts ofa program [1]. They
advocate using a profiler to guide optimizations, although they do not make any mention of automating the process.
At MIT, members of the Transit Project group and Blair [8, 3] independently advocate the adaptive dynamic feedback-based compiler as the archetype compiler of the future.
In the Coordinated Science Laboratory at University of Illinois researchers have mented IMPACT [4] a feedback-based optimizing compiler that uses the feedback to imple-ment several different optimizations ranging from trace scheduling with classic optimizations
to function inlining.
Fisher first came up with trace scheduling in 1981 [10] as a means of reducing the length of instructions given to a VLIW machine. Ellis later describes in detail how this is done in his PhD thesis under Fisher [9].
Chapter 2
Design and Implementation
This chapter describes the details of the implementation and discusses the design issues that were involved. The first section describes in detail the general requirements of the compiler, profiler and the interface for them to cooperate in a mechanism for providing feedback to the compiler. The second section describes the possible implementations for the general requirements outlined in the first section, the actual implementation that was used and the reasons for choosing it. In many cases, a problem was solved in a particular way because it was the best solution in terms of accommodating the constraints imposed by the conventions of the existing tools and environment. In those cases, we try to point out what might have been ideal and any major disadvantages of the chosen implementation. As mentioned before, we chose to implement the profiler and the compiler as two separate tools for two main reasons. The first is that the system is more modular in this way, because now the compiler and the profiler can be upgraded individually so long as the protocol with their interface is not violated; therefore, maintenance is simplified. The second reason is that the compiler can be easily configured to optimize according to different types of statistics. For example, cache miss data per basic block or per instruction would provide guidance to the compiler that may help in laying out the code to improve cache behaviour. The flexibility offered by the modularity provides a powerful research tool which would be much more difficult to implement and manipulate with an integrated compiler-profiler system.
2.1 Designing The Feedback Mechanism
The first step in the design of the interface was to identify the necessary properties of the compiler and the profiler for them to be able to interact in a meaningful manner. The next step was to decide how the dynamic data (from the profiler) should be captured, what should be collected and how it should be stored. In other words, the first consideration was a question of how the data should be obtained and the second was a matter of what the collected data could be used for.
2.1.1 Necessary Properties for Feedback
The compiler produces executable code as input to the profiler, and it also reads in the output of the profiler as part of its own input. Therefore, the compiler must be able to produce an executable suitable for the profiler and also be able to parse the output of the profiler. Suiting the needs of the profiler may be done in several ways according to the profiler being used. Parsing the output of the profiler is again highly dependent on the profiler being used. Even beyond these problems of protocol specification, the compiler needs to be able to identify the instructions being referred to by the profiler when it returns
its frequency counts. Summarizing, there are three important properties that the
feedback-based compiler must have:1. It must be able to produce code suitable for the profiler.
2. It must understand the format of the profiler output.
3. The compiler must understand how the profiler refers to the instructions that are
presented to it for profiling.To elaborate the point, since the compiler and the profiler are two separate programs, they do not share any internal data structures. Therefore, the compiler's view of the code generated is very different from the profiler's view of the code executed. In particular, the compiler never sees the absolute addresses assigned to the instructions, whereas that is all
the profiler has to refer to the instructions by. Furthermore, the data actually desired is
basic block counts, so the compiler has the additional problem of identifying the basic block to which a particular instruction in the final output belonged.We mention that we desire basic block counts although profilers can usually return frequency data on many granularities of code ranging from machine operations to basic blocks. Basic block information is preferred because that granularity is coarse enough to provide a good summary of control flow from the data, and fine enough to allow information on finer granularities to be obtained. For example, knowing the frequency of execution of all the basic blocks, along with the instructions that are in the blocks, is sufficient to deduce the instruction distribution. Each instruction within a basic block is executed as many times as the basic block itself is, so by summing the frequencies for each basic block in which
a particular type of instruction appears, we can obtain the total number of times that
instruction type was executed.2.1.2
Types of Data to Collect
Deciding what kind of data to store is largely determined by the features of the profiler. In most cases, the profiler will give only various types of frequency summaries for some granularity of code - basic block, instruction, or operation for example. For these, deciding what to store is not much of a problem since we can typically store all the frequencies. However, if the profiler has the ability to return many possible types of summaries it may be too expensive to store all the possibilities. For example, one could imagine a profiler that had the ability to return information about the values of variables within the basic block,
so that at the end of the profiled run, it would also return a distribution of the range of
values assumed by the variables within a block. This type of information would be rather voluminous to store especially if it were done for several variables across several basic blocks and for an especially long profiled run. In cases like these, decisions have to be made (by the designer) about what kinds of data are relevant for the uses he has in mind.Therefore, deciding what the feedback data will be used for is highly dependent on the kind
of data that the profiler can return, and conversely, deciding what kinds of data to store
-in the cases where we have a choice - is largely dependent on the proposed uses of the data. This interdependence seems to suggest that the data stored should, in some way, be linked to a semantic model of the program, since the semantics will be the indicators of what kinds of optimizations can be done in the later phases of compilation. Also, the semantic model used should be one that the compiler is already familiar with (or will be eventually) since it represents what the compiler "knows" about the program. By annotating this model with the feedback data, the compiler will - in some sense - be able to ascribe meaning to thedata.
Having data that does not directly relate to any of the compiler's semantic models will probably be difficult to use in the optimization phase, since those statistics will be hard to describe in terms of the model that the optimization is implemented in. For example, if the semantic model for a particular optimization was the control flowgraph, and the data that the profiler returned included the frequencies of procedures called, then that data would not be as effective as if the semantic representation had been a call graph instead. In that example, if there was no consideration ever given to the call graph in the optimization phase of compilation, then it was probably not worth the space or the time to collect that
particular type of data.
We see that there is an interdependence between the data that is available in the first place, the data that is stored and the possible uses of it. In some sense, the semantic models that are available determine what kinds of data it makes sense to store, and also what might be done with the data by the optimizer. Of course, the programmer may decide that he wants to use some particular type of data for a particular optimization, but if there is no semantic model to support the data directly, then he must implement a model which can take advantage of the data he is interested in using. Not surprisingly, both the kind of data being returned and the intended uses for the data will affect when and how, during the compilation process, the data is captured.
2.1.3 When to Collect the Data
When the data ought to be captured is determined by properties of the compiler and by the intended uses for that data. How the feedback data is captured also depends on the compiler. In general, code generation has to occur at least twice. Once to give the profiler code to profile, and the second time to use the feedback data with the optimizer. How these two passes of the code generator are done is subject to two general constraints:
1. The code generated on the first pass must be done using only the state of the semantic
models at the time of data capture.
2. After the point of data capture, all of the semantic models for which data will be collected must either be exactly reproducible if necessary or remain intact after the first pass of code was generated.
The first constraint guarantees that the code to be optimized using feedback is the same
as what was profiled. The second ensures that the data retrieved is associated with the
semantic models in the appropriate way since any assumptions about the code in the first
pass of code generation will not be violated afterwards. When the profiler results are
returned, they ought to be used to annotate the semantic models present after that data
has been retrieved. In the case when this pass is a completely different run from the firstpass of the code generator, the second constraint ensures that the semantic model that
is annotated with the data will be generated to have the same structure as the semantic
data structure that produced the code that was profiled. The first condition guarantees us
that that data structure is in fact the one that corresponds to the code that was produced
in the first pass and profiled. In the case when the semantic models are preserved across the first pass of code generation, the first constraint again ensures that the data returnedcorresponds with the models.
Since the code produced will be profiled for each of the inputs given in the input set, it should be optimized as much as possible. In this way, the overall profiling time will decrease. There is a tradeoff involved, though that should be noted. There are many optimizations that we would like to use in conjunction with feedback information such as loop unrolling, and common subexpression elimination [1] with large traces obtained from application of the feedback data. Therefore, it would seem reasonable to collect the feedback data before these optimizations took place. However, we cannot use them in the code that will be profiled unless we are willing to repeat them. While repeating those optimizations might not be a bad idea in general, there is the question of whether the optimizations will adversely affect each other when they are used in the second pass of code generation.
The tradeoff then, is whether to try to produce code that can be profiled quickly, or to sacrifice time in the profiling stage of the compilation process, in the hope that the resulting optimized code will be much faster than otherwise. The two options indicate collecting the feedback data at two different possible extremes: either very early when there is no first pass optimization and therefore greater opportunity for application of feedback data or very late, when the output code will be very fast, but the feedback data will not be used very much to improve the code generated. It seems that duplicating the optimizations so that we get both benefits is the most favourable option. Failing that however, choosing some suitable compromise in optimization of the profiled code seems to be the correct action to take. A judicious choice can be made by using some of the optimizations that do not stand to gain much from feedback information, such as constant folding and propagation on the code in the first pass of code generation.
2.2 The Implementation
This section discusses the possible implementations given the design requirements discussed in the first section, and gives justification for the implementation chosen. In many instances, the chosen implementation was dictated by the constraints of the already existing system
rather than any deliberate decision. For these, we discuss how the implementation could possibly be improved if these constraints were relaxed.
2.2.1
The Compiler
The compiler used was IBM's production compiler called TOBEY1. It is written in PL.8, a subset of PL/1, which was developed several years ago explicitly for implementing an opti-mizing compiler for the then new RISC architecture. The TOBEY compiler has had several optimizations implemented in it throughout its lifetime, resulting in a highly optimizing compiler; however, it has also grown to immense proportions, with many esoteric intricacies that often proved to be obstacles to successful code manipulation.
The compiler's operations are broken down into five stages. The first stage includes all the lexing and parsing necessary to build the data structures that are used in the subsequent stages. The second stage generates code in an intermediate language called XIL, a register transfer language that has been highly attuned to the RS6000 architecture. The third stage performs optimizations on the XIL produced from the second stage and also produces XIL. Register allocation is done in the fourth stage and further optimizations are then performed on the resulting code. The fifth and final stage generates assembly code from the XIL produced in the fourth stage.
There are essentially two levels of optimizations possible within the compiler, the actual level to be used for a particular compilation is given as a compile-time parameter passed with the call to the compiler. At the lower level of optimization, only commoning is done and only within basic blocks. The higher level of optimization implements all the classic code optimizations such as common subexpression elimination and loop unrolling as well as a few which were developed at IBM such as reassociation [5]. In this implementation, there is actually a third level, not much higher than the lower one, which performs minor optimizations within basic blocks such as value numbering and dead code elimination. This was the level at which code was generated for profiling since all the optimizations at this level satisfied all the constraints mentioned earlier.
One unfortunate characteristic of the optimizations done within the TOBEY compiler is that the operation of some optimizations are not independent of others. Therefore, the XIL produced by some optimizations is not always suitable as input to those same optimizations and to others. The reason this is unfortunate is that the order in which optimizations are done is very important and requires detailed knowledge of the interdependencies to be safely modified. Two main problems arose in the implementation of the feedback mechanism
because of this: modifications to the code to accommodate the data structures for the
mechanism were often difficult or cumbersome, and some optimizations that stood to benefit from feedback information could not be done on the code that was to be profiled.2.2.2
Producing Code for the Profiler
In this implementation, the code was generated twice in two separate runs of the whole compiler. The profiler was given only the code from the first pass, and this code had minimal
1
optimizations performed on it. On the second pass, all the data structures constructed for code generation in the first pass were duplicated exactly, just as was discussed in the constraints for data collection and code generation. Since the compiler is deterministic, the code structure produced is exactly the same as that of the first pass, and hence the same as that given to the profiler. Therefore, any reference to the data structures for the code (say a control flow dependency graph) of the first pass is valid and has the same meaning as the equivalent reference in the second pass.
We could not attempt the preferable option of duplicating the optimizations used between the two code generation passes because of the incompatibility of some optimizations with others as mentioned above. Within the TOBEY compiler, there are dependencies between
the optimizations themselves, so that some cannot be performed after others, and some cannot be repeated on the same XIL code. These constraints prevented the first pass of code from being optimized too highly.
2.2.3
Reading Profiler Output
As mentioned in the earlier section, the second requirement of the compiler is that it needs
to know the format of the output of the profiler so that it can automatically extract the
appropriate statistics from the profiler's output. This requirement is essentially for au-tomation only. The first requirement would have been necessary even if the data was going to be fed back to the compiler manually. Automating the feedback process requires thatthe compiler be able to identify important portions of the profiler output and ascribe the
appropriate meaning to them. For example, the compiler must know where in the output to find the frequency count for a particular basic block.As part of the understanding that the compiler has of the profiler's output, the compiler
must know not only where to find the appropriate data, but also what ought to be done with that data. For example, it may be that the profiler produces frequency counts as well as the length of the basic block in terms of instructions. If we care about both items of information, then the compiler needs to know not only where to find these items in the whole output, but also how these data should be used in conjunction with its semantic models. This particular detail posed a small problem in the interface since it was not obvious how the user could describe what data was supposed to be interesting and how it would be interesting, without having to know too much of the compiler's innards. The solution was to settle for the fact that a control flowgraph could safely be assumed to be used by the compiler. Then any data was considered to be for annotation of that flowgraph. Ultimately, we would like something more universal than this, but that would require a sophisticated means of specifying the semantic model to use and further, the way in which the data should be used with that model.2.2.4 Identifying Profiler References
The third requirement of the compiler is that there must be some means of identifying the
instructions (and the basic blocks) that the profiler refers to when it returns its statistics.
The solution employed was to generate a tag per basic block which was unique within a file.This tag was then written out with the rest of the object code into the object files, in such
a way that it would be preserved throughout linking and loading and finally dumped into the executable where it would be visible to the profiler. The profiler would then report the
tag along with the frequency for the instruction associated with the tag.
There were two potential problems with this proposed solution. The first was that while the
format of the object file was rather liberal and would allow such tags within it, there was no simple way to force the linker and loader to reproduce those tags within the executable since the format of the executable, XCOFF2, is quite rigid, and the linker discards unreferenced items. The second problem was that since this data inserted by the compiler was custom data within the executable, the average profiler would not have been capable of returning that data - defeating the central goal of wide compatibility.The solution to both problems was to use the line number fields within the executable to contain the tags. Since the XCOFF format already had space to accommodate line numbers, no additional modification was necessary, either to the XCOFF format or to the linker and loader, to preserve the tags from the object files. Also, since the line number is a standard
part of the
XCOFFformat, the chances that the profiler will be able to return that data field
are high. The limitations of this solution are that the tags are restricted to being at most 16 bits wide which turned out to be suboptimal, and that the line number information, which is very useful while debugging, is unavailable while the tags are being reported. That second limitation is not a problem in general since on the second pass, we can restore the actual line numbers to the fields. In the second pass, there is no need to have profiler tags since the compiler will not be profiling the output of the second phase. Were the compiler to continually massage the same code over and over by repeatedly profiling and recompiling, then we would be forced to permanently substitute tags for line numbers, in which case an alternate solution would probably have to be found.2.2.5
Interfacing with-the Compiler
Designing the interface between the compiler and the profiler is, perhaps, the most impor-tant part of the entire project. The specification of the interface determines the kinds of profilers that are compatible with the compiler, and what features, if any, of the compiler will need to be preserved when it is upgraded. A second aspect of the interface was that between the compiler and the user. This aspect allows the user to be able to specify the manner in which the feedback data should be processed as well as indicate to the compiler
which parts of the profiler data should be considered important.
An integrated user/profiler interface was developed because of the close interrelation be-tween their functions. It should be noted however, that the user interface aspect was not stressed. So while it provides the user with means of expressing manipulations on the feed-back data, it could only offer modest expressive power, and an admittedly esoteric syntax for using it.
All the programmable aspects of the interface were specified in one file called the specification
file. This file contained all the directives to the compiler to allow it to communicate with
the profiler according to the requirements outlined above. In particular, the specification file contained information on how the compiler should call the profiler, parse its output and
2
also choose which parts of the profiler output were important.
One disadvantage to incorporating this type of generality in the interface is that there is a danger of escalating the complexity to such levels that even simple tasks become tedious or difficult to express. To alleviate this problem, a specification file was designed for the particular profiler being used. One of the input parameters to the compiler was the name of the specification file to use in interfacing with the profiler. This particular specification file was set up as the default, so that a simple call to the compiler with feedback turned on would use the default profiler, without the user having to worry about it. One could envision several specification files being implemented, one for each popular profiler available, so that many different types of feedback might be available without the user having any detailed knowledge of the system. At the same time, the compiler researcher who may care to investigate the effects of different types of feedback information available from the same profiler would want the expressive power offered by the programmable interface to allow him to pursue his research. We feel that this implementation of the interface provides a suitable compromise between simplification of use and expressive power available.
2.3 The Profiler
Almost any profiler could be used as part of a feedback mechanism, and so it would not be very instructive to try to identify essential features of a profiler for this purpose. However, there are several restrictions on the profiler that can be used with this implementation of
the feedback mechanism, and this we discuss in detail below.
Since a central goal of this implementation was for the system to be able to use the re-sults of many profilers, the requirements on them were kept to a minimum. The essential requirements of any profiler compatible with the system are three:
1. It must be able to produce frequency counts for basic blocks.
2. It must be able to return the source line number corresponding to an instruction in
the executable.
3. It must return along with that line number, the source file name.
The first requirement is necessary - even if that data will not be used for optimizations -because the algorithm that determines edge frequencies depends on these values. Although, a limitation of sorts, it is not very serious, since in most instances, this piece of information is exactly what an optimization is looking for. The real limiting factor of this requirement is that the exact counts are needed as opposed to a program counter sampled profile of the program. This immediately excludes a large class of profilers from being compatible, although this limitation is mitigated by the fact that profilers of that class typically work at a coarser granularity than the basic block. Most of those profilers-prof and gprof are examples-report sampled timing information on procedures and so tend to provide useful information for annotating a call graph, rather than a control flowgraph.
The ideal situation is for a profiler to be able to return both types of frequency counts and have both the call graph and control flowgraph as views of the program at two different
granularities. The call graph which would be annotated by the sampling profiles would help direct the basic block profiler by indicating the hot procedures. This feature would be ex-tremely important in an adaptive dynamic implementation of feedback based optimization, but in this static setting, profiling at the coarser level is left up to the user.
2.3.1
The xprof Profiler
The profiler used with this implementation was the xprof profiler, designed and implemented by Nair [14]. One important feature of this profiler was that it did not require the instru-mentation of nodes to be done by the compiler. That is, unlike prof and gprof, there was no
parameter that needed to be passed to the compiler to allow the output to be compatible
with xprof. This profiler could return various types of frequency information ranging from instruction type summaries to basic block frequencies. The primary mode of usage in the implementation for this thesis was for it to return basic block frequencies.Along with the frequency of execution of a basic block, and its tag (line number), the xprof profiler could also return the start and end addresses of the basic blocks it encountered. These two values together indicated the size of the basic block in terms of instructions, which was used to help weight the branch proabilities in the implementation of branch prediction (see Chapter 4.
2.4 Bibliographic Notes
gprof and prof are profilers that are part of the UNIX standard. They both sample the
machine state periodically and report a summary of the relative frequencies of the proce-dures that were executed. In contrast, xprof returns actual basic block counts for all the procedures executed.
Reassociation was developed by John Cocke and Peter Markstein at IBM [5] and was a more general technique than the similar, independent implementation by Scarborough and Kolsky [17].


![Figure 4.3: Filling the Pipeline between Branch Instructions branches [11].](https://thumb-eu.123doks.com/thumbv2/123doknet/14133581.469373/56.918.214.756.114.457/figure-filling-pipeline-branch-instructions-branches.webp)