Publisher’s version / Version de l'éditeur:
Canadian Journal of Chemistry, 89, pp. 423-432, 2011-03-01
READ THESE TERMS AND CONDITIONS CAREFULLY BEFORE USING THIS WEBSITE.
https://nrc-publications.canada.ca/eng/copyright
Vous avez des questions? Nous pouvons vous aider. Pour communiquer directement avec un auteur, consultez la
première page de la revue dans laquelle son article a été publié afin de trouver ses coordonnées. Si vous n’arrivez pas à les repérer, communiquez avec nous à PublicationsArchive-ArchivesPublications@nrc-cnrc.gc.ca.
Questions? Contact the NRC Publications Archive team at
PublicationsArchive-ArchivesPublications@nrc-cnrc.gc.ca. If you wish to email the authors directly, please see the first page of the publication for their contact information.
NRC Publications Archive
Archives des publications du CNRC
This publication could be one of several versions: author’s original, accepted manuscript or the publisher’s version. / La version de cette publication peut être l’une des suivantes : la version prépublication de l’auteur, la version acceptée du manuscrit ou la version de l’éditeur.
For the publisher’s version, please access the DOI link below./ Pour consulter la version de l’éditeur, utilisez le lien DOI ci-dessous.
https://doi.org/10.1139/V10-144
Access and use of this website and the material on it are subject to the Terms and Conditions set forth at A Förster resonance energy transfer (FRET) approach for enhancing fluorescence contrast in phase-separated membranes
Carter Ramirez, Daniel M.; Ding, Jason; Guan, Jack; Vobornik, Dusan; Carnini, Anna; Ogilvie, William W.; Jakubek, Zygmunt J.; Johnston, Linda J.
https://publications-cnrc.canada.ca/fra/droits
L’accès à ce site Web et l’utilisation de son contenu sont assujettis aux conditions présentées dans le site LISEZ CES CONDITIONS ATTENTIVEMENT AVANT D’UTILISER CE SITE WEB.
NRC Publications Record / Notice d'Archives des publications de CNRC:
https://nrc-publications.canada.ca/eng/view/object/?id=42f6e266-5262-4592-9061-0bca57efa47e https://publications-cnrc.canada.ca/fra/voir/objet/?id=42f6e266-5262-4592-9061-0bca57efa47e
A FRET Approach for Enhancing Fluorescence Contrast in
Phase-Separated Membranes
Daniel M. Carter Ramirez,a,b Jason Ding,a Jack Guan,a Dusan Vobornik,a Anna Carnini,a William W. Ogilvie,b Zygmunt J. Jakubeka and Linda J. Johnstona
a
Steacie Institute for Molecular Sciences, National Research Council Canada, Ottawa. ON Canada K1A 0R6
and
b
Department of Chemistry, University of Ottawa, Ottawa, ON Canada
Abstract
The partitioning of the dye-labeled lipid probe, NBD-DHPE, has been examined by fluorescence microscopy in phase-separated lipid bilayers with mixtures of co-existing liquid-ordered and fluid phases. This probe shows slightly higher fluorescence intenisty in the ordered domains but undergoes a contrast reversal to give a more strongly fluorescent fluid phase in the presence of >0.2% Texas Red-DHPE (TR-DHPE). The change in contrast is shown to result from Förster resonance energy transfer between the NBD donor and TR acceptor in the fluid phase which has a TR concentration that is approximately 3 times higher than in the domains. An alternate approach using a nitroxide –substituted lipid that partitions into the fluid phase as quencher was also examined as a means to enhance the contrast; however, the quencher modified the behavior of the bilayer. The energy transfer method for enhancing the contrast between ordered and fluid phases was used to examine the morphology of enzyme-treated bilayers.
Introduction
The compartmentalization of the plasma membrane into functional microdomains provides an important mechanism for regulating biological processes. Lipid or membrane rafts are defined as small, dynamic, heterogeneous microdomains that are enriched in cholesterol, sphingolipids and certain proteins.1-5 They are believed to exist in a liquid-ordered (Lo) phase
that is surrounded by the bulk fluid or liquid-disordered (Ld) membrane. Rafts are postulated
to have an important functional role in modulating cell signaling by spatial and temporal control of the organization of membrane proteins. The direct visualization of rafts in cell membranes is challenging due to their small size (10-200 nm, below the optical diffraction limit) and their relatively short lifetime.6 These limitations have prompted many studies of lipid phase behavior in model membranes such as small unilamellar vesicles, giant unilamellar vesicles and supported lipid bilayers. Co-existing liquid phases have been observed for a variety of lipid mixtures with at least three components, a low melting, unsaturated
phospholipid, a high melting, saturated phosphatidylcholine or sphingomyelin and cholesterol (Chol),7-9 thus confirming one of the key concepts of the lipid raft hypothesis.
Despite the widespread use of fluorescence microscopy to study coexisting Ld and Lo
phase separation in supported membranes and in giant unilamellar vesicles, there are relatively few dyes or dye-labeled lipids that can be used to selectively label the Lo phase. For example,
the partitioning of more than 25 different fluorophores was assessed by fluorescence microscopy in giant unilamellar vesicles using a standard protocol for two different ternary lipid mixtures.10 This study examined phospholipid probes with both saturated and unsaturated acyl chains and with fluorophores attached to either the acyl chain or polar head group. Based on relative fluorescence intensities, all fluorophore-labeled phospholipids partitioned more strongly into the disordered phase, including several headgroup-labeled lipids with saturated acyl chains that would be expected to cause the least disturbance to lipid packing in the Lo
phase.10 Although cholestatrienol partitioned into the Lo phase, other studies have
demonstrated that dye-labeled cholesterol analogs show slight preferences for either Lo or Ld
phases, depending on the fluorophore polarity, and the method and location (hydroxyl vs alkyl chain) of its attachment to the sterol.11-14 Several aromatic hydrocarbons show stronger
fluorescence in the Lo phase, whereas dialkylcarbocyanine dyes have a preference for either the
Lo or Ld phase, depending on the chain length and saturation/unsaturation of the hydrocarbon
chain of the dye and the lipid composition for DOPC/SM/Chol and DOPC/DSPC/Chol
mixtures. Despite the clear preference of most lipid probes to partition into Ld phases in model
membranes, NBD-DHPE (head group labeled) partitions strongly into Lo domains in vesicles
(POPC/C16-SM/Chol, Kp (Lo/Ld) = 3.7) and fluoresces more strongly in the Lo phase in
supported planar bilayers prepared from POPC/brain SM/Chol mixtures.15,16 Interestingly, this probe has also been reported to partition into the Lo phase in giant plasma membrane vesicles,
although many other common lipid probes partition into the Ld phase in this system.17
As part of our investigations of the enzymatic generation of ceramide in bilayers with co-existing Lo and Ld phases, we had attempted to use NBD-DHPE to label Lo domains in
supported bilayers prepared from DOPC/ESM/Chol mixtures. Although this probe showed a slight preference for partitioning into the disordered phase based on relative fluorescence intensity measurements, we observed that a combination of NBD-DHPE and Texas Red-DHPE (TR-DHPE) resulted in stronger NBD fluorescence in Lo domains. Here we show that this
apparent reversal of contrast for NBD-DHPE is caused by Förster resonance energy transfer (FRET) between NBD-DHPE and TR-DHPE in the fluid phase. TR-DHPE partitions strongly into the Ld phase, leading to efficient FRET, as expected from the strong overlap of donor
NBD emission with absorption of the TR acceptor. Energy transfer was characterized in detail using a combination of fluorescence microscopy experiments for supported bilayers and measurements of FRET efficiencies based on donor fluorescence lifetimes in vesicle solution. We also examined an alternate approach using a nitroxide quencher, TEMPO-DOPC, that partitions strongly into the disordered phase, to enhance the contrast for NBD in the Lo
domains. Finally, we demonstrate that the double labeling strategy can be used to visualize the complex morphologies obtained during enzyme-restructuring of supported membranes
Experimental section Materials
Dioleolylphosphatidylcholine (DOPC), chicken egg sphingomyelin (ESM), cholesterol (Chol) and 1,2-dipalmitoyl-sn-glycero-3-phospho
ethanolamine-N-(7-nitro-2-1,3-benzoxadiazol-4-yl) (ammonium salt) (N-NBD-DHPE) were purchased from Avanti Polar Lipids (Alabaster, AL) and were used as received. Texas Red 1,2-dihexadecanoyl-sn-glycero-3-phosphoethanolamine, triethyl-ammonium salt (TR-DHPE) was obtained from Invitrogen (Eugene, OR). NBD-Chol was synthesized as described previously.13 Sphingomyelinase
(SMase) isolated from Staphylococcus aureus was obtained from Sigma-Aldrich. All aqueous solutions were prepared using 18.3 MΩ·cm Milli-Q water. SMase buffer: 125 mM NaCl, 10 mM CaCl2, 2 mM MgCl2, 10 mM HEPES, pH 7.4. Structures of the lipid probes are shown in
Scheme 1.
Preparation of supported bilayers
Small unilamellar vesicles were prepared as described previously.18 Briefly,
chloroform solutions of phospholipids and dye-labeled lipids were mixed in the appropriate ratios and the lipid films obtained after evaporating the solvent were hydrated in water. The samples were then sonicated in a bath sonicator to clarity to form SUVs with a final lipid concentration of 0.5 mg/mL. All vesicle solutions were sonicated at temperatures above the Tm
of the constituent lipids and were used immediately or stored at 4 ºC for up to 1 week prior to use.
Planar supported bilayers were formed via vesicle fusion. Vesicle solution (60 μl) and 750 μl CaCl2 (15 mM) were added to freshly cleaved mica (15- 25 μm thick for fluorescence
imaging) clamped in a liquid cell. After incubation at 45 °C for 60 min, bilayers were gradually cooled to room temperature over a period of two hours, and then washed with Milli-Q water to remove unattached vesicles before imaging.
Atomic force microscopy
Atomic force microscopy (AFM) images were obtained on a PicoSPM atomic force microscope (Molecular Imaging) in MAC-mode using magnetic coated silicon tips with spring
constants of ~0.5 N/m and resonance frequencies between 8 to 35 kHz in aqueous solutions. Either a 30 m 30 m or 5 m 5 m scanner was used with a scan rate between 0.7 – 1.3 Hz. All images shown are flattened raw data. Two independently prepared samples were imaged for each bilayer composition, and several areas were scanned for each sample. Domain heights were measured as the difference between the condensed phase domains and the fluid phase.
Fluorescence microscopy
Fluorescence images of bilayers were measured in a total internal reflection
fluorescence (TIRF) mode on an Olympus IX81 microscope equipped with a high resolution CCD camera (CoolSNAP, Photometrics, USA) and a 60x/1.45 NA Plan Apochromat TIRF objective. Fluorescence was excited with a 488 nm Ar ion laser (NBD-labeled probes) or a 543 nm Kr ion laser beam (TR-DHPE). NBD and TR fluorescence was recorded through FF01-536/40 and FF01-624/40 emission filters (Semrock, USA), respectively. For comparison of the effects of laser polarization, images were recorded using TIRF and
epifluorescence geometries; the linearly polarized emission from the laser results in ~70% axial polarization for TIRF as compared to in-plane polarized excitation for epifluorescence. For SMase treatment, the bilayers were washed with SMase buffer and imaged. The effect of enzyme on the bilayer was followed in time by imaging the same area before and after addition of buffered enzyme solution at room temperature.
The fluorescence intensity analysis was done using ImagePro software
(MediaCybernetics, USA). The intensities of adjacent Ld fluid-phase and Lo domains were
measured from intensity cross-sections of the area-of-interest. These values were corrected for background fluorescence before calculating the Ld/Lo intensity ratio (ILo/ILd). The background
fluorescence count was obtained by either completely bleaching an area immediately adjacent to the area of interest or by using a bilayer defect in the region of interest. Care was taken to ensure that background, domain and fluid phase intensities were measured within a small area (2-4 m) with uniform excitation intensity to minimize effects due to variation in excitation intensity across the field of view. A minimum of ten corrected ILo/ILd values were collecte d per
region (approximately 100 µm2), and a multiple samples were measured for each experiment to check for reproducibility.
Fluorescence spectroscopy
Absorption spectra were measured with a Cary 5000 UV-Vis-NIR spectrophotometer (Varian) at 22 °C, using a 1-cm-path length quartz cuvette. Emission spectra and fluorescence lifetimes were recorded at 22 °C using a Fluorolog Tau-3 (Horiba Jobin Yvon, USA)
spectrofluorometer. Fluorescence quantum yields for TR-DHPE in vesicle solutions were measured with reference to Rhodamine 101 ( = 1.0)19
at an excitation wavelength of 550 nm and absorbance < 0.2. Fluorescence lifetimes were measured using the frequency domain method with modulation frequencies in the 2–80 MHz range.
Results and discussion
Fluorescence microscopy of supported bilayers
Figure 1 illustrates a representative fluorescence image of a supported lipid bilayer prepared from DOPC/ESM/Chol (2:2:1) vesicles containing 0.3% NBD-DHPE. The small, slightly darker domains are analogous to those observed in previous fluorescence microscopy studies of similar supported bilayers using TR-DHPE to visualize phase separation; AFM showed that the dye-excluded domains were thicker than the surrounding membranes,
consistent with assignment to a cholesterol and sphingomyelin-enriched liquid-ordered phase.20 Contrary to our expectations based on literature data for POPC mixtures,15,16 NBD-DHPE has a slight preference for the Ld phase, based on relative fluorescence intensities. However, bilayers
containing both NBD-DHPE and TR-DHPE showed an apparent reversal in contrast for the NBD channel, as illustrated in Fig. 1 B, C. In this case, the NBD channel indicates
significantly stronger fluorescence in the domains, while TR-DHPE, shows a strong preference for the Ld phase, as previously observed. Qualitatively similar results were obtained for
DOPC/ESM/Chol (1:1:1) bilayers; bilayers with NBD alone showed slightly darker domains and the contrast was reversed for bilayers prepared with a mixture of 0.5 mol% NBD-DHPE
and 0.3 mol% TR-DHPE. A change from the apparent Ld preference of the probe was also
observed for Oregon Green in the presence of TR-DHPE in 2:2:1 DOPC/ESM/Chol bilayers. The change in intensity for NBD-DHPE in the Lo and Ld phases was examined as a
function of TR-DHPE concentration. Bilayers containing 0.1 mol% TR-DHPE showed similar images (data not shown) to that for NBD-DHPE alone (Fig. 1A). However, the contrast is reversed at higher dye loadings (0.2 mol% and higher). A matched experiment (same
excitation intensity and exposure time) for bilayers containing 0, 0.2 and 0.5 mol% TR-DHPE is presented in Fig. 2. Note that the images in Fig. 2 are all displayed on a fixed intensity scale, so that the NBD-DHPE image appears to have lower contrast compared to that shown in Fig. 1. The overall intensity for NBD fluorescence decreases significantly in the Ld phase at 0.5 mol%
TR-DHPE as shown in Fig. 2 D. The large decrease in NBD intensity (to ~24% of the initial value) in the Ld phase contrasts with the relatively modest decrease (to ~80% of the initial
value) for the Lo domains. The variation in the relative intensities of Lo and Ld phase are
displayed in Fig. 2E.
One possible explanation for the reversal in contrast for NBD in the presence of TR-DHPE is that fluorescence resonance energy transfer (FRET) from NBD (donor) to TR (acceptor) occurs with a much higher efficiency in the fluid phase as compared to the ordered domains for the DOPC/ESM/Chol bilayers. This explanation is consistent with both the strong overlap of donor NBD emission with absorption of the TR acceptor and pronounced reduction in NBD emission in the Lo domains with increasing [TR-DHPE]. More efficient FRET in the
Ld phase requires either a more favorable relative orientation of the transition dipoles of the
donor and acceptor in this phase or a significantly higher concentration of TR. Several additional experiments with DOPC/ESM/Chol bilayers and vesicles labeled with only TR-DHPE were carried out to investigate this in more detail.
First, images of bilayers with [TR-DHPE] between 0.01 and 1 mol% all showed significantly stronger fluorescence from the Ld phase, providing qualitative evidence for a
higher probe concentration in this phase. The relative fluorescence intensity ratios for several concentrations are shown in Fig. 3A and indicate that the ILd/ILo ratio is approximately 2.7 for
(to 2.2 at 1 mol%). The fluorescence intensity ratios do not give a direct measure of the partition coefficient, Kp, between the two phases and, thus, cannot be directly related to the
ratio of concentrations in Lo and Ld phases. Changes in quantum yield in the two lipid phases,
differences in self-quenching between the two phases and effects of probe orientation on the absorption efficiency all contribute to the measured intensity ratios. Fluorescence quantum yields were measured for several concentrations of TR-DHPE in DOPC, DOPC/Chol (2:1) and ESM/Chol (2:1) vesicles for comparison to the fluorescence microscopy results and to test for the effect of lipid composition on fluorescence efficiency. The data are shown in Fig. 3B and indicate that the fluorescence quantum yield at low [TR-DHPE] is the same ( = 0.6) within experimental error for DOPC and ESM/Chol and is only slightly higher for DOPC/Chol ( = 0.66). Comparison of quantum yields at 0.2, 0.5 and 1 mol% TR for each of the vesicle compositions shows a decrease in quantum yield with increased concentration for vesicles containing Chol, with self–quenching increasing with increased lipid order (DOPC<
DOPC/Chol < ESM/Chol). Assuming that results in vesicles can be extrapolated to supported bilayers, the modest changes in quantum yield and the low self-quenching indicate that the fluorescence intensity ratio for the supported bilayers at the lowest [TR-DHPE] do not reflect differences in fluorescence efficiency or self-quenching between the two phases. Finally, images obtained with in-plane and axial polarization for the excitation laser had the same ILd/ILo ratio within experimental error; this indicates that the transition dipole moment for TR
must be oriented similarly in the two phases, since in-plane polarization will favor excitation of fluorophores with dipoles oriented parallel to the membrane surface, whereas axial polarization will preferentially excite molecules oriented perpendicular to the membrane. Thus, we
conclude that the concentration of TR-DHPE is approximately 3 times higher in the Ld phase
than in the Lo domains.
FRET in vesicle solution
FRET between NBD-DHPE and TR-DHPE in vesicle solution was investigated by measuring NBD-DHPE lifetime distributions in the frequency domain.21 First the fluorescence lifetime of NBD-DHPE was evaluated in methanol solution and in DOPC, DOPC/Chol and
ESM/Chol vesicles. In methanol the fluorescence intensity decay fits well to a single exponential function, with a lifetime of 6.2 ns. By contrast, NBD decays in vesicle solution were clearly not single exponential but gave adequate fits to a Lorentzian lifetime distribution. Fits with a Gaussian lifetime distribution were also statistically acceptable. The amplitude weighted lifetimes are 6.9, 7.4 and 9.5 in DOPC, DOPC/Chol and ESM/Chol vesicles, longer than the lifetime measured in methanol. These data are consistent with the increased quantum yields with increasing bilayers order: quantum yields of 0.18, 0.16 and 0.26 for ~0.5 mol% NBD-DHPE in DOPC, DOPC/Chol and ESM/Chol vesicles.13 The increased quantum yields reflect a less polar environment which is related to the positioning of the fluorophore in the polar headgroup region of the bilayers; the longer lifetimes and increased quantum yields indicate a decrease in the non-radiative rate constant in more ordered environments.
The non-single-exponential decay kinetics and the amplitude weighted lifetimes are consistent with previous fluorescence data for several NBD-phospholipid probes (headgroup labeled) in vesicle solution.22-24 For example, fluorescence decays with long and short components were measured for NBD-DMPE in DMPC vesicles with 0-0.4 mol fraction Chol (10-12 ns and 1.9-2.2 ns) 23 and for NBD-PE in DPPG vesicles (6.0 and 12.6 ns).24 Similarly, lifetimes of 9.2 – 10.5 ns were measured for NBD-DPPE in POPC/SM/Chol mixtures with varying fractions of Lo phase.22 By contrast, monoexponential decay kinetics with a lifetime of
7.9 ns were reported in an earlier study for NBD-DPPE in egg PC vesicles.25 The differences in probe structure and concentration and lipid environment account for the variation in
lifetimes for the various NBD-labeled lipids. There is no evidence for changes in emission properties that would be indicative of probe aggregation.
Figure 4A shows fluorescence spectra obtained by 450 nm excitation of 0.5 mol% NBD-DHPE in DOPC vesicles with 0, 0.1, 0.5, and 0.85 mol% [TR-DHPE], clearly illustrating energy transfer from NBD donor to TR acceptor with efficiency increasing with increasing TR fractional concentration. The fluorescence lifetime for NBD in DOPC vesicles was measured as a function of TR-DHPE concentration using the frequency-domain method and modeled with a Lorentzian distribution function. The resulting decay curves and lifetime distributions are shown in Fig. S1 and S2. For each distribution we calculated amplitude weighted lifetime,
which is proportional to the total NBD fluorescence and which, therefore, we could subsequently use to calculate energy transfer efficiencies as a function of TR fractional concentration,
D DA
E 1 . The amplitude weighted lifetimes and FRET efficiencies are shown in Table 1. FRET efficiencies are also plotted against TR fractional concentration in Fig. 4B. Energy transfer occurs with similar efficiency in cholesterol mixtures, based on comparison of measured values of 0.36 and 0.29 FRET for 0.3 mol% TR in DOPC/Chol and ESM/Chol vesicles compared to 0.30 FRET for DOPC (see Fig. 4B and Table 1) at the same [TR].
The NBD to TR energy transfer efficiencies measured in DOPC vesicle membranes were compared with values calculated assuming a random distribution of acceptors in the membrane (see Fig. 4B, solid and dotted lines).26 The solid line represents energy transfer efficiencies calculated with a Förster distance R0 = 42.7 Å, which, in turn, was calculated using
a quantum yield of NBD in DOPC equal to 0.18, refractive index of donor and acceptor environment equal to 1.33, an overlap integral obtained from measured absorption and emission intensities of TR and NBD in DOPC, respectively, and assuming the orientation factor 2
= 2/3, which corresponds to transition dipole moments randomized in three dimensions. As evident from Fig. 4B, the calculated efficiencies are systematically smaller than the measured values. A possible reason for this disagreement could be underestimation of the orientation factor 2
. In fact, our preliminary observations of NBD and TR interactions in supported bilayers indicate that the orientation factor should be larger than 2/3 as orientation randomization of the transition dipole moments of both NBD and TR results in nonvanishing components along the direction normal to the bilayers.27 As shown in Fig. 4B, dotted line, should the Förster distance be somewhat longer, R0 48 Å, the calculated efficiencies would
agree with the observation very well. This longer value of the Förster distance could be
calculated using the orientation factor 21.35. An orientation factor significantly larger than 1
indicates a large contribution from energy transfer between dyes in opposite leaflets of the bilayer.
As shown in Table 1, the widths of the Lorentzian lifetime distributions do not vary systematically with TR fractional concentration and are approximately equal to or only slightly larger than the width for 0.0 mol% TR. This suggests that the distributions are primarily
defined by variation in the NBD environment rather than by a distribution of NBD-TR en transfer distances.
ergy
luorescence quenching by TEMPO-DOPC in supported bilayers
ing a non-mine of ide-e th . PO] the C in seful F
To test whether the ILd/ILo ratio for NBD-DHPE could be tuned us
lu scent quencher, bilayers containing NBD-DHPE and variable concentrations TEMPO-DOPC (Scheme 1) were examined by fluorescence microscopy. Several nitrox labeled unsaturated phosphatidylcholines have been shown to localize in disordered membran phases and have been used in fluorescence quenching assays to assess phase separation in multi-component vesicles.28,29 Figure 5 shows fluorescence images for bilayers labeled wi 0.5 mol% NBD-DHPE and containing either 0.3 mol % TR-DHPE or 3 or 6 %
TEMPO-DOPC; a fraction of the DOPC has been replaced by TEMPO-DOPC in the latter two mixtures while keeping the ESM/Chol ratio constant. With 3 mol % TEMPO-DOPC the domains are still visible but the contrast between Lo and Ld is lower than in the absence of TEMPO-DOPC
Addition of 3 mol % TEMPO-DOPC also modifies the domain size and morphology, suggesting that it may not be completely excluded from the Lo phase. At higher [TEM
bilayer morphology is further modified by the TEMPO with smaller and more irregular shaped domains detected by AFM and with a slight increase in the height difference between domain and surrounding fluid phase (0.8-1.0 nm and 1.0 – 1.2 nm for 0 and 6 mol % TEMPO,
respectively). However, the domains are still visible in fluorescence images and are now brighter than the fluid phase, indicating more efficient quenching of NBD by Tempo-DOP the Ld phase than in the domains. The relatively high concentration of TEMPO required to see
the same contrast reversal achieved with low [TR-DHPE] and the significant effects of TEMPO on the bilayer morphology indicate that TEMPO quenching is not a generally u strategy for fluorescence microscopy.
Contrast-enhanced imaging to follow the dynamics of enzyme-mediated bilayer restructuring
Our previous studies have used correlated fluorescence and AFM to characterize morphological changes in supported bilayers of DOPC/ESM/Chol following in situ enzymatic generation of ceramide.13,20,30 Ceramide is a small hydrophobic sphingolipid which has been implicated in the regulation of lipid raft-associated signaling processes; the enzymatic hydrolysis of sphingomyelin by sphingomyelinases (SMases) is a physiologically important pathway for generating ceramide.31 The high spatial resolution of AFM coupled with the superior temporal resolution of fluorescence microscopy provides detailed information on the complex membrane restructuring that occurs. These changes include the formation of
heterogeneous Lo domains with ceramide-enriched subdomains, a new dye-excluded
membrane phase and occasional defects.20 A novel NBD-labeled cholesterol probe (NBD-Chol, Scheme 1) with a carbamate linker was synthesized and shown to partition more strongly into the Lo phase than a commercially available ester-linked probe;13 NBD-Chol was used to
identify regions of a highly ordered, cholesterol-depleted phase in SMase treated bilayers and to show that cholesterol is depleted from the raft-like domains following ceramide
generation.13 However, the NBD-Chol partitioned almost equally between ordered and disordered membrane phases and did not adequately resolve the heterogeneity in ceramide-containing domains that can be observed by AFM. Here we show that a labeling strategy using an NBD-Chol/TR-DHPE FRET pair has some advantages for resolving the complex changes that occur during enzymatic generation of ceramide in supported bilayers.
Figure 6 illustrates a representative time course experiment recording the evolution of a DOPC/ESM/Chol (7:9:4) supported bilayer following SMase treatment. The bilayer has been labeled with 0.5% NBD-Chol and 0.2% TR-DHPE, and incubated with 0.33 U/mL of enzyme. Panel A shows the bilayer before enzyme addition. The Lo domains appear bright relative to
the Ld phase; this is in contrast to bilayers labeled with NBD-Chol alone for which the fluid
phase is brighter, but is consistent with contrast reversal due to FRET, as described above for NBD-DHPE and TR-DHPE in membranes of similar composition. In an image (Fig. 6B) of the same sample region taken three minutes after SMase addition, the domains now appear slightly
darker than the surrounding membrane. Control experiments confirmed that this change was not due to accelerated NBD photobleaching in the domain relative to the fluid phase. In our previous work we reported that as ceramide is generated in the domains, NBD-Chol is gradually ejected from these features into the fluid phase.13 The domain darkening observed here is consistent with this earlier observation. Recorded nine minutes after enzyme addition, panel C reveals domains that exhibit two levels of fluorescence intensity. Although the features retain their overall rounded shape, and can be matched to domains in the initial untreated bilayer, they now appear as dark rings enclosing bright regions at their centers. Over time these rings continue to darken and thicken, and the bright regions at the domain centers decrease in size (see Fig. 6D, 16 minutes; note that the intensities are weaker in both phases due to probe bleaching).
Based on previous correlated fluorescence-AFM imaging of similar SMase-treated bilayers, the dark border and bright central regions that appear in the domains correspond to a raised, fence-like gel-phase perimeter and a liquid-ordered core that is lower in height. The taller gel-phase regions have been assigned to ceramide-enriched regions that are depleted in cholesterol,18,32 and so should exclude a probe for cholesterol. The dark domain perimeters in panels C and D show that this is in fact the case with the NBD-Chol. The domain centers remain bright indicating that they retain the probe and therefore also a significant cholesterol content, consistent with previous AFM results.13 Such heterogeneity within domains was not observed by fluorescence with the NBD-cholesterol probe in the absence of TR-DHPE, illustrating the advantage of the FRET method for enhancing fluorescence contrast.
Conclusions
The probe NBD-DHPE shows stronger fluorescence in the fluid phase in
DOPC/ESM/Chol mixtures but contrast reversal to give more strongly fluorescent liquid-ordered domains is observed in the presence of >0.2% TR-DHPE. This observation is explained by the occurrence of efficient FRET between NBD and TR in the fluid phase, consistent estimates of a three-fold higher concentration of TR-DHPE in the Ld phase relative
presence of 0.0–1.0 mol% TR-DHPE in homogeneous DOPC vesicles. FRET efficiencies of ~0.30 at 0.3 mol% TR were measured for vesicles of several different compositions. The utility of the FRET approach for enhancing contrast between phases in complex lipid mixtures was demonstrated by imaging bilayers during enzyme-mediated bilayer restructuring.
Labeling the bilayers with an NBD-TR combination allowed us to resolve domain
heterogeneity due to ceramide-enriched subdomains that was not evident when using either of the two dyes independently.
FRET methodologies have been used to detect and characterize phase separation in a variety of lipid mixtures of varying complexity and quantitative approaches have been devised to determine phase boundaries, probe partition coefficients and domain size.33 However, energy transfer between donor and acceptor fluorophores, as examined here, has not been utilized as a means for improving fluorescence contrast or visualizing liquid-ordered domains for which most lipid probes show a relatively low partition coefficient. It is important to note that significant FRET efficiencies are measured even at the relatively low dye concentration of 0.2 %. Similar (or higher) concentrations are widely used in fluorescence microscopy studies of both supported membranes and GUVs, frequently in double labeling experiments with dyes that have significant overlap of donor emission and acceptor absorption. Thus, it is important to ensure that results for partitioning of components into a specific phase in doubly-labeled membranes are correctly interpreted and do not reflect a FRET component.
Acknowledgments
We thank Drs. Maohui Chen and Zhengfang Lu for imaging assistance. JG was the recipient of a 2009 RISE summer research award and DMCR of an Ontario Graduate Scholarship. LJJ and WWO gratefully acknowledge financial support from the Natural Sciences and Engineering Research Council.
References
(1) Edidin, M. Annu. Rev. Biophys. Biomol. Struct. 2003, 32, 257.
(2) Jacobson, K.; Mouritsen, O. G.; Anderson, R. G. W. Nat. Cell Biol. 2007, 9, 7. (3) Pike, L. J. J. Lipid Research 2006, 47, 1597.
(4) Simons, K.; Ikonen, E. Nature 1997, 387, 569.
(5) Simons, K.; Vaz, W. L. Annu. Rev. Biophys. Biomol. Struct. 2004, 33, 269. (6) Lagerholm, B. C.; Weinreb, G. E.; Jacobson, K.; Thompson, N. L. Annu. Rev.
Phys. Chem. 2005, 56, 309.
(7) Heberle, F. A.; Buboltz, J. T.; Stringer, D.; Feigenson, G. W. Biochim. Biophys.
Acta 2005, 1746, 186.
(8) London, E. Biochim Biophys Acta 2005, 1746, 203.
(9) Veatch, S. L.; Keller, S. L. Biochim. Biophys. Acta 2005, 1746, 172.
(10) Baumgart, T.; Hunt, G.; Farkas, E. R.; Webb, W. W.; Feigenson, G. W. Biochim.
Biophys. Acta-Biomembr. 2007, 1768, 2182.
(11) Ariola, F. S.; Li, Z.; Cornejo, C.; Bittman, R.; Heikal, A. A. Biophys. J. 2009, 96, 2696.
(12) Chiantia, S.; Ries, J.; Chwastek, G.; Carrer, D.; Li, Z.; Bittman, R.; Schwille, P.
Biochim. Biophys. Acta-Biomembr. 2008, 1778, 1356.
(13) Carter Ramirez, D. M.; Ogilvie, W. W.; Johnston, L. J. Biochim. Biophys.
Acta-Biomembr. 2010, 1798, 558.
(14) Shaw, J. E.; Epand, R. F.; Epand, R. M.; Li, Z.; Bittman, R.; Yip, C. M. Biophys.
J. 2006, 90, 2170.
(15) Dietrich, C.; Bagatolli, L. A.; Volovyk, Z. N.; Thompson, N. L.; Levi, M.; Jacobson, K.; Gratton, E. Biophys. J. 2001, 80, 1417.
(16) Silva, L. C.; de Almeida, R. F. M.; Castro, B. M.; Fedorov, A.; Prieto, M.
Biophys. J. 2007, 92, 502.
(17) Sengupta, P.; Hammond, A.; Holowka, D.; Baird, B. Biochim. Biophys. Acta
2008, 1778, 20.
(18) Ira; Johnston, L. J. Langmuir 2006, 22, 11284.
(20) Ira; Zou, S.; Carter Ramirez, D. M.; Vanderlip, S.; Ogilvie, W.; Jakubek, Z.; Johnston, L. J. J. Struct. Biol. 2009, 168, 78.
(21) Lakowicz, J. R. Principles of Fluorescence Spectroscopy, 3rd Edition; Springer: New York, 2006.
(22) de Almeida, R. F. M.; Loura, L. M. S.; Federov, A.; Prieto, M. J. Mol. Biol. 2005,
346, 1109.
(23) Loura, L. M. S.; Federov, A.; Prieto, M. Biophys. J. 2001, 80, 776.
(24) Duportail, G.; Merola, F.; Lianos, P. J. Photochem. Photobiol. A: Chem. 1995, 89, 135.
(25) Mazeres, S.; Schram, V.; Tocanne, J.-F.; Lopez, A. Biophys. J. 1996, 71, 327. (26) Wolber, P. K.; Hudson, B. C. Biophys. J. 1979, 28, 197.
(27) Dale, R. E.; Eisinger, J.; Blumberg, W. E. Biophys. J. 1979, 26, 161. (28) Megha; London, E. J. Biol. Chem. 2004, 279, 9997.
(29) Silvius, J. R. Biophys. J. 2003, 85, 1034.
(30) Ira; Johnston, L. J. Biochim. Biophys. Acta 2008, 1778, 185. (31) Goni, F. M.; Alonso, A. Biochim. Biophys. Acta 2009, 1788, 169. (32) Chiantia, S.; Kahya, N.; Ries, J.; Schwille, P. Biophys. J. 2006, 90, 4500.
(33) Loura, L. M. S.; de Almeida, R. F. M.; Silva, L. C.; Prieto, M. Biochim. Biophys.
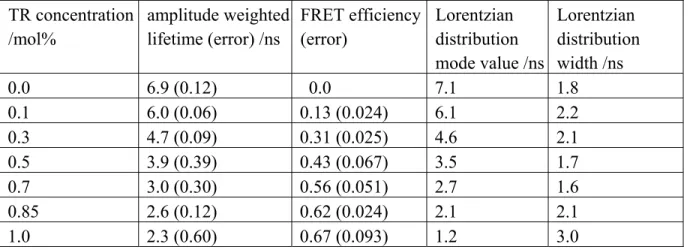
Table 1: NBD to TR resonance energy transfer in DOPC vesicles as a function of TR fractional concentration. TR concentration /mol% amplitude weighted lifetime (error) /ns FRET efficiency (error) Lorentzian distribution mode value /ns Lorentzian distribution width /ns 0.0 6.9 (0.12) 0.0 7.1 1.8 0.1 6.0 (0.06) 0.13 (0.024) 6.1 2.2 0.3 4.7 (0.09) 0.31 (0.025) 4.6 2.1 0.5 3.9 (0.39) 0.43 (0.067) 3.5 1.7 0.7 3.0 (0.30) 0.56 (0.051) 2.7 1.6 0.85 2.6 (0.12) 0.62 (0.024) 2.1 2.1 1.0 2.3 (0.60) 0.67 (0.093) 1.2 3.0
Figure Legends
Fig. 1. Fluorescence images for DOPC/ESM/cholesterol (2:2:1 molar ratio) bilayers labeled with (A) 0.5% NBD-DHPE and (B, C) 0.3% NBD-DHPE plus 0.3% TR-DHPE; B and C show NBD and TR channels, respectively.
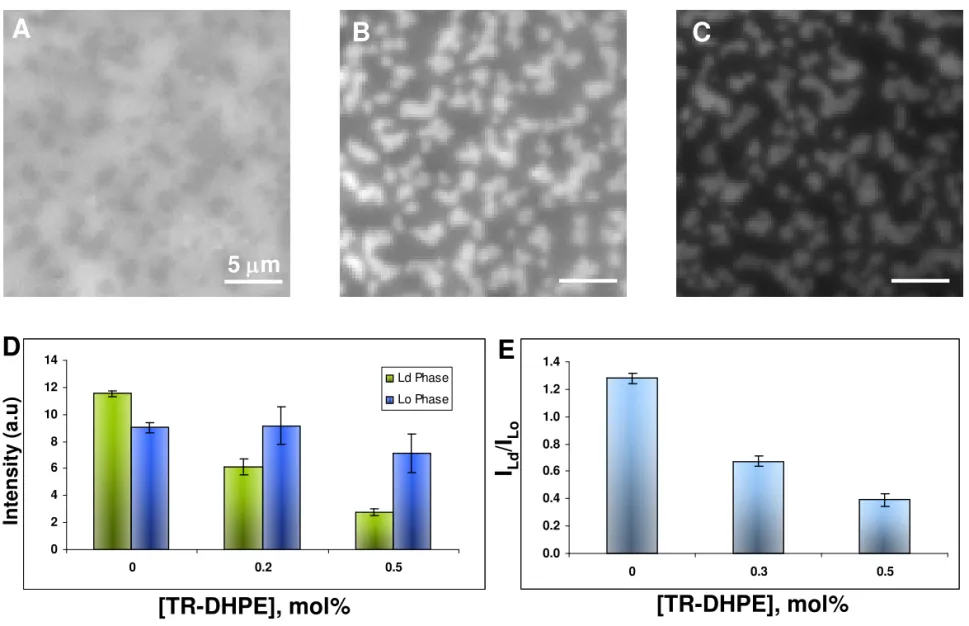
Fig. 2. Fluorescence images for DOPC/ESM/cholesterol bilayers labeled with 0.5% NBD-DHPE and 0 (A) 0.2 (B) and 0.5 (C) mol% TR-NBD-DHPE; all three images are displayed on the same intensity scale. The column charts in D and E illustrate the change in NBD intensities for the Lo and Ld phases and the Lo/Ld intensity ratios, respectively, as a function of [TR-DHPE].
Fig. 3. (A) ILd/ILo ratios for DOPC/ESM/Chol bilayers containing variable concentrations of
TR-DHPE. (B) Dependence of TR-DHPE fluorescence quantum yield on concentration in DOPC, DOPC/Chol and ESM/Chol vesicles.
Fig. 4. (A) Fluorescence spectra measured after 450 nm excitation of NBD-DHPE in DOPC vesicles containing various [TR-DHPE]. (B) FRET efficiency as a function of [TR-DHPE] in DOPC vesicles (solid circles). The error bars indicate maximum error. The solid and dashed lines represent calculated energy transfer efficiencies with Förster distances (R0) of 42.7 and 48
Å, respectively, assuming random acceptor distribution.
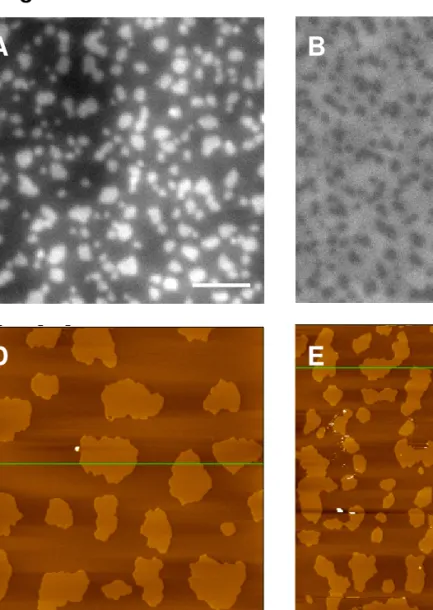
Fig. 5. Fluorescence (A, B, C) and AFM (D, E) images comparing the effect of TR-DHPE and Tempo-DOPC on NBD fluorescence in DOPC/ESM/cholesterol bilayers containing 0.4% NBD-DHPE. (A, D) 0.3% TR-DHPE; (B) 3 mol% DOPC (C, E) 6 mol% Tempo-DOPC.
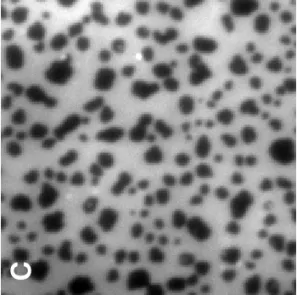
Fig. 6. Fluorescence timecourse for a DOPC/ESM/cholesterol (7:9:4) bilayer labeled with 0.5% NBD-Chol and 0.2% TR-DHPE and treated with 0.5 U sphingomyelinase in a final volume of 1.5mL. (A) Before SMase addition; (B) 3 min; (C) 9 min; (D) 16 min.
Figure 1
A
B
C
5 µ
Figure 2
5 m
A
B
C
0 2 4 6 8 10 12 14 0 0.2 0.5 Ld Phase Lo PhaseD
E
0.0 0.2 0.4 0.6 0.8 1.0 1.2 1.4 0 0.3 0.5[TR-DHPE], mol%
[TR-DHPE], mol%
I
Ld/I
LoIntensity
![Figure 3 A B [TR-DHPE], mol%00.20.40.60.80.20.5 1](https://thumb-eu.123doks.com/thumbv2/123doknet/14136392.469724/23.1188.101.1127.244.676/figure-a-b-tr-dhpe-mol.webp)