Publisher’s version / Version de l'éditeur:
Proceedings 18th International Conference on Port and Ocean Engineering under Arctic Conditions, POAC '05, 1, pp. 453-462, 2005-05-12
READ THESE TERMS AND CONDITIONS CAREFULLY BEFORE USING THIS WEBSITE.
https://nrc-publications.canada.ca/eng/copyright
Vous avez des questions? Nous pouvons vous aider. Pour communiquer directement avec un auteur, consultez la première page de la revue dans laquelle son article a été publié afin de trouver ses coordonnées. Si vous n’arrivez pas à les repérer, communiquez avec nous à [email protected].
Questions? Contact the NRC Publications Archive team at
[email protected]. If you wish to email the authors directly, please see the first page of the publication for their contact information.
NRC Publications Archive
Archives des publications du CNRC
This publication could be one of several versions: author’s original, accepted manuscript or the publisher’s version. / La version de cette publication peut être l’une des suivantes : la version prépublication de l’auteur, la version acceptée du manuscrit ou la version de l’éditeur.
Access and use of this website and the material on it are subject to the Terms and Conditions set forth at Multi-Year Ice Loads on the Molikpaq: May 12, 1986 Event.
Timco, Garry; Wright, B.
https://publications-cnrc.canada.ca/fra/droits
L’accès à ce site Web et l’utilisation de son contenu sont assujettis aux conditions présentées dans le site LISEZ CES CONDITIONS ATTENTIVEMENT AVANT D’UTILISER CE SITE WEB.
NRC Publications Record / Notice d'Archives des publications de CNRC:
https://nrc-publications.canada.ca/eng/view/object/?id=b82c5ce8-dfcd-4a86-8cd6-51852ba2ead3 https://publications-cnrc.canada.ca/fra/voir/objet/?id=b82c5ce8-dfcd-4a86-8cd6-51852ba2ead3
Proceedings 18th International Conference on Port and Ocean Engineering under Arctic Conditions, POAC’05 Vol.1, pp 453-462, Potsdam, NY, USA, 2005.
MULTI-YEAR ICE LOADS ON THE MOLIKPAQ:
MAY 12, 1986 EVENT
G.W. Timco1, M.E. Johnston1 and B.D. Wright2
1
Canadian Hydraulics Centre, NRC, Ottawa, Ont. Canada
2
B. Wright & Assoc., Canmore, Al, Canada
ABSTRACT
On May 12, 1986, the offshore structure Molikpaq was hit by a large floe containing a mix of thick first-year ice and multi-year ice. The potential impact caused a
precautionary evacuation from the structure involving most of the crew. This paper describes that ice loading event in detail. Loads were measured using three different types of instrumentation – MEDOF panels, strain gauges and extensometers. The calculated loads from all three systems were quite comparable and ranged up to 250 MN on the north face of the structure for this event.
MOLIKPAQ STRUCTURE
The Molikpaq structure was developed by Gulf Canada Resources Ltd. and operated by Beaudril, a subsidiary of Gulf. The Molikpaq is a Mobile Arctic Caisson (MAC) which was deployed in the Canadian Beaufort Sea in 1984 and used for exploration drilling for four winter seasons in the Canadian Arctic. It consisted of a continuous steel annulus on which sits a self-contained deck structure. The core of the annulus was filled with sand, which provided over 80 percent of the horizontal resistance. The outer face of the Molikpaq was designed for extreme ice features. The structure could operate without a berm in water depths ranging from 9 to 21 m. In deep
waters, the angle of the outer face is 8°, whereas in shallower waters, the angle of the face is 23°.
An extensive array of sensors was installed on the structure to help assure
operational safety and provide data for ice load analysis purposes (Klohn-Crippen, 1998). Three types of instruments were deployed that could be used to infer ice
loads: MEDOF Panels, strain gauges and extensometers. Figure 1 shows a schematic of the sensor locations. Thirty-one MEDOF panels (1.1 m by 2.7 m) were installed on the north, northeast and east faces of the caisson when the Molikpaq was built to provide a direct measure of ice load. Strain gauges were installed at the “09”
location. Prior to April 12, 1986, there were 4 strain gauges, one along each side. After that date, an additional 12 gauges were installed. The locations of the 16 gauges are shown in Figure 1. Ten extensometers were mounted to measure any deflections of the caisson, deck and conductor pipe. These sensors formed a subset of almost 500 sensors that were used to monitor the performance of the structure. In this paper, output from the ice load sensors will be used to evaluate the loads during a relatively large ice loading event that took place on May 12, 1986.
mean water level
Lower MEDOF panel Middle MEDOF panel Upper MEDOF panel
Side View 23 faceo 8 faceo Extensometer Strain Gauge MEDOF Panels Extensometers N1 N2 N3 NE E1 E2 E3 CORE (E-W) CORE (N-S) Conductor Pipe N1 N2 N3 NE E1 E2 E3 SE S1 S2 S3 SW W1 W2 W3 NW SG09 Strain Gauges Plan View
Figure 1: Illustration of the ice load measuring instrumentation on the Molikpaq in the Canadian Beaufort Sea.
MAY 12, 1986 LOADING EVENT
On May 12, 1986, a very large ice floe with dimensions approximately 7 km by 15 km impacted the Molikpaq on the north and northeast faces. The floe was comprised of thick first-year ice with many large multi-year ice inclusions. The speed of impact was 0.18 m/s and it decreased to zero at the end of the collision. The loading event lasted approximately 27 minutes. Figure 2 shows the rubble map for the impact and Figure 3 shows a photo of the Molikpaq at the start of the impact. Figure 4 shows both an aerial view and a photograph along the north wall of the Molikpaq at the end of the loading event. The photograph shows large amounts of crushed ice and the large flexural failure of the ice sheet at the end of the loading event.
All faces instrumented N x x x x x x x x x accumulated rubble
(2 m x 2 m blocks) crushing andextrusion
open water
full contact is made on N face by 03:10 Thick FYI floe about 7 km x 15 km with light ridging and large MYI inclusions
50 m ice advanced towards 185 T at 0.18 - 0 m/s
o
Figure 2: Rubble map of the May 12, 1986 loading event.
Figure 3: Photograph taken from a helicopter showing the ice crushing along the north and northeast face during the May 12 event.
Figure 4: Photographs showing an aerial view of the structure and ice floe, and ice failing along the north face of the Molikpaq at the end of the loading event. Note the large amount of crushed ice and the large flexural failure of the ice.
Voelker Neth was the Ice Engineer onboard the Molikpaq during this event. He described the sequence of events as follows:
May 10, 1986
10:48-11:59 Ice reconnaissance to check large ice floe on N/NE of rig. MAC in open water
May 11, 1986
13:10 Change Alert Status from green to yellow
13:30-14:20 Ice recon – check vast ice floe – Floe consists of thick first year (TFY) matrix with large multi-year (MY) floes embedded. Distance to floe: 2.5 nm, drift 0.35-0.4 knots, 185-180ºT
18:35-19:05 Ice recon – checked southern edge of floe for MY ice – 4 m thick (est) with 150 m long hummock, 1.5-2 m sail – POTENTIAL HAZARD! 19:30 Commenced evacuation
22:30 Changed Alert Status from yellow to red. 4th helicopter off for Tuk, 34 people left
24:00 5th helicopter off, 17 people left May 12, 1986
2:45 started helicopter, 10 people in chopper 3:01 ice impact – thick FY floe (1.7-2m)
3:03 Ice rubble on east face pushed off
3:19 Considerable vibration (max 8.1% g) of structure 3:23–3:26 max ice forces
3:28 ice floe stopped
4:06-4:37 ice recon – why did floe stop? Check ice conditions N of vast floe to see whether pack ice drives vast floe – answer – No. Is vast floe in contact with LF ice W of rig? Answer – no.
5:00-12:00 vast floe slides slowly along NE/N face (150ºT) and rotates clockwise 10:52-11:30 ice recon to NW, N of rig
12:20 change Alert Status from red to yellow ~13:30 return of drill crew
GLOBAL LOADS ON THE NORTH FACE
All of the sensors were operating during this impact event so it is possible to determine the load using each of the sensors. The data during this event were recorded as a “fast” file F3605120301 which started at 3:09:43 am. The sampling rate varied during the record with an average sampling rate of 1.3 Hz. In analyzing the data, it was necessary to remove the “offset” values from each channel. This offset value is caused by slow drift of the sensors and gives a non-zero reading with no applied load. Getting the correct offset value is important, yet not always
possible. Although it is possible to use “Baseline” files to infer the offset values, in this analysis, the initial value of the file was used to zero the strain gauge and extensometer channels. The MEDOF panels, which are shown in Figure 5, were mostly adjusted in this fashion, although there a few channels that had a sub-zero signal at the end of the event. In this case, this value was used as the offset (since it is not possible for the MEDOF panels to measure a tension load).
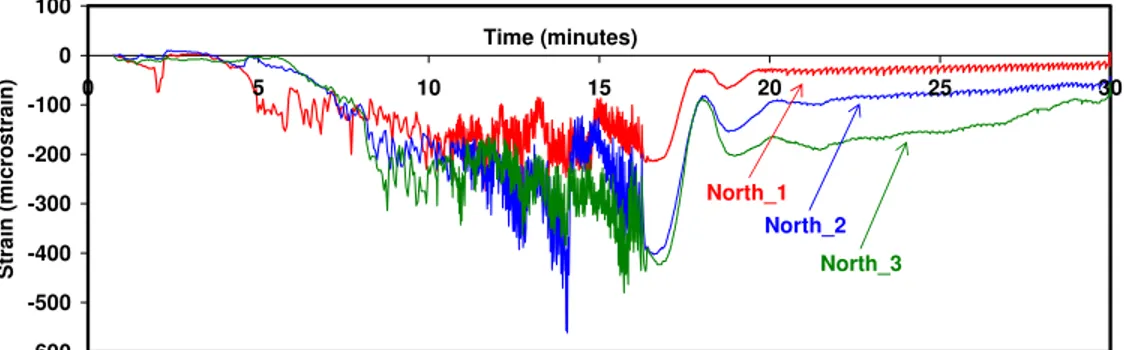
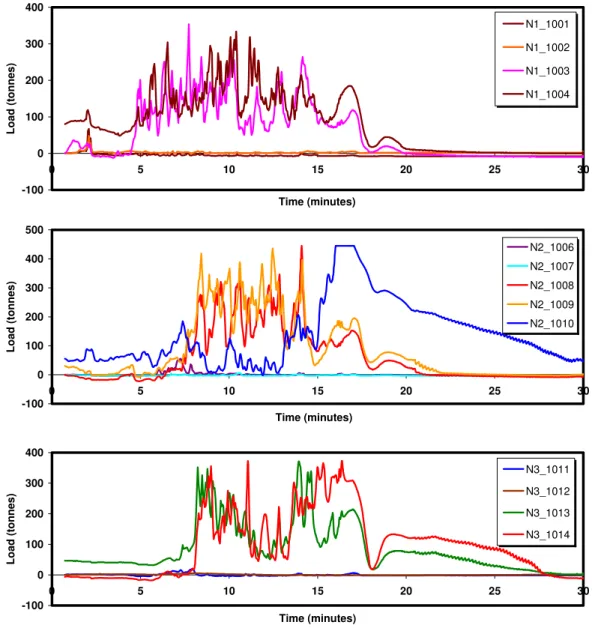
Figures 6 to 8 show the response of the three sensor systems along the north face. A comparison of the sensor output clearly shows that all three types of sensors recorded the event. Maximum strains on the order of 400 microstrain were recorded. The extensometers showed a total deflection of 40 mm and the MEDOF panels recorded loads up to 450 tonnes. North Face E N3 N2 N1 W 1012 1014 1011 1013 1007 1009 1006 1008 1010 1002 1004 1001 1003
-600 -500 -400 -300 -200 -100 0 100 0 5 10 15 20 25 30 Time (minutes) St ra in (micro strain ) North_1 North_2 North_3
Figure 6: Response of the three strain gauges along the north face during the May 12, 1986 event. -50 -40 -30 -20 -10 0 10 0 5 10 15 20 25 30 Time (minutes) Deformati o n (mm) North South North + South
Figure 7: Extensometer deformations along the north and south faces and the resultant deformation (N + S) during the May 12, 1986 event.
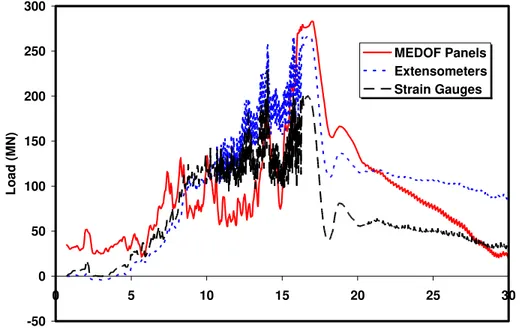
It is possible to use algorithms to predict the global load on the face based on the sensor responses. This approach is based on extrapolating the response measured locally to the full width of the face. There are inaccuracies in doing this since it assumes that the ice behaves similarly along the whole face. Nevertheless, this approach must be used since there was not full coverage of the whole face of the structure. Figure 9 shows a comparison of the face load calculated using each of the three types of sensors.
All three of the sensor systems showed reasonable agreement. The peak load was approximately 250 MN based on the MEDOF panels and the extensometers, and 200 MN based on the strain gauges. Note that both the extensometers and the strain gauges show higher frequency content than the MEDOF panels. This is a reflection of the relatively low frequency response of the MEDOF panels, which begin to roll off at about 1 Hz. It is interesting to note that the peak load is consistent with
estimates that could be made from the Hans Island data. Blanchet (1990) estimates a peak load per unit width of 6 MN/m for a width of 60 m for 8 m thick ice. During the time of the peak loading on May 12, there was considerable activity on the lower MEDOF panel (Figure 8) suggesting an ice thickness of 5 m. Normalizing Blanchet’s value to this thickness gives a peak load of 225 MN.
-100 0 100 200 300 400 0 5 10 15 20 25 30 Time (minutes) Load (t onnes) N1_1001 N1_1002 N1_1003 N1_1004 -100 0 100 200 300 400 500 0 5 10 15 20 25 30 Time (minutes) Lo ad (tonn es) N2_1006 N2_1007 N2_1008 N2_1009 N2_1010 -100 0 100 200 300 400 0 5 10 15 20 25 30 Time (minutes) Lo ad ( tonnes ) N3_1011 N3_1012 N3_1013 N3_1014
Figure 8: Response of the MEDOF panels along the north face of the structure during the May 12, 1986 event. Note that there was no loading on the upper MEDOF panels.
UNIFORM DECELERATION ASSUMPTION
The floe was approximately 7 km by 15 km with variable thickness containing both first-year and multi-year ice. If one assumes an average thickness of 2.5 m for the floe and an ice density of 1000 kg/m3, the estimated mass would be 260 x 109 kg. This floe stopped in 27 minutes from an initial speed of 0.18 m/s. Assuming a uniform rate of deceleration, the deceleration would be approximately 10-4 m/s2. Then, using F=ma, the estimated average force would be 26 MN. This is an order of magnitude lower than the peak load measured by the instrumentation on the north
face of the structure. Furthermore, it is less than the average load of the time-series trace on the north face (Figure 9) which is on the order of 100 MN. The difference appears to be in the assumption of uniform deceleration. The floe would slow more rapidly when the structure interacted with the thicker multi-year ice (and the loads would be higher), resulting in a non-uniform rate of deceleration. Nevertheless, this simple comparison illustrates the inaccuracies that can result in analyzing an impact event in this manner if the details of the deceleration are not known.
-50 0 50 100 150 200 250 300 0 5 10 15 20 25 30 Time (minutes) Lo ad (MN ) MEDOF Panels Extensometers Strain Gauges
Figure 9: Global loads calculated on the north face during the May 12, 1986 event. There is quite reasonable agreement amongst all three sensors used to measure the load. Both the extensometers and the strain gauges show higher dynamic content than the MEDOF panels.
VIBRATIONS
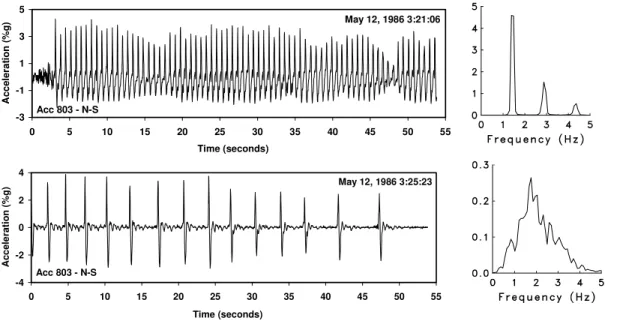
Neth noted that there were strong vibrations felt on the Molikpaq, especially towards the end of the loading event. Figure 10 shows the time-series response and the spectra of one of the north accelerometers (acc 803) beginning at 3:21:06 and 3:25:23. These data are based on Burst files that were recorded at 50 Hz. There is considerable difference in the behaviour of the sensors at these different times. At 3:21, the acceleration was very cyclic with asymmetrical vibration (similar to a beat frequency) with peak values of 4% of g. Four minutes later (when the floe was almost stopped), the time-series showed a series of distinct peaks which are separated by longer and longer intervals.
-3 -1 1 3 5 0 5 10 15 20 25 30 35 40 45 50 55 Time (seconds) A c c e le ra ti o n (% g ) Acc 803 - N-S May 12, 1986 3:21:06 -4 -2 0 2 4 0 5 10 15 20 25 30 35 40 45 50 55 Time (seconds) Ac c e le ra tio n ( % g ) Acc 803 - N-S May 12, 1986 3:25:23
Figure 10: Acceleration along the north face (Accelerometer 803) showing the structural vibration as the floe was slowing down.
-25 -20 -15 -10 0 5 10 15 20 25 30 35 40 45 50 55 Time (seconds) Extenso meter 731 (mm) May 12, 1986 3:21:06 -40 -30 -20 -10 0 5 10 15 20 25 30 35 40 45 50 55 Time (seconds) Ext en s o m e ter 7 31 (mm) May 12, 1986 3:25:23
Figure 11: Deformation along the north wall at the end of the impact event.
Figure 11 shows similar plots for the extensometer (Ext 731) along the north face. At 3:21 a.m., the extensometer showed a very clear cyclic behaviour with a frequency of approximately 1.4 Hz. Peak amplitudes ranged up to 10 mm. Four minutes later, the extensometer still showed cyclic behaviour but at a lower frequency
SUMMARY AND CONCLUSIONS
This paper has summarized the May 12, 1986 loading event on the Molikpaq. Loads were measured using three different sensor systems, which showed reasonable agreement. Peak loads of the order of 250 MN were estimated on the north face during the impact of a large first-year ice floe with several thick multi-year ice inclusions. Strong vibration was measured on the structure, especially as the floe slowed. This information can be used with previous analysis on the Molikpaq data (Jeffries and Wright, 1988; Timco and Johnston, 2003, 2004; Wright et al., 1986; Wright and Timco, 1994, 2000) to get a more complete picture of the ice loads on the structure for a wide range of conditions. Data from the Molikpaq have proven to be extremely valuable for understanding ice loads on wide offshore structures.
ACKNOWLEDGEMENTS
The authors would like to thank Gulf Canada Resources Ltd, especially Dennis Siedlitz, for access to the Molikpaq data. Financial support for this work from the Canadian Program of Energy Research and Development (PERD) through both the Northern POL and Offshore Environmental Factors POL is gratefully acknowledged.
REFERENCES
Blanchet, D. 1990. Ice Design Criteria for Wide Arctic Structures. Can. Geotech. Journal 67, pp 701-725.
Klohn-Crippen, 1998. DynaMAC: Molikpaq Ice Loading Experience. PERD/CHC Report 14-62, Calgary, Al., Canada.
Jefferies, M.G. & Wright, W.H. 1988. Dynamic Response of Molikpaq to Ice-Structure Interaction. Proceedings OMAE’88, Vol. IV, pp 201-220, Houston, TX, USA.
Wright, B., Pilkington, G.R., Woolner, K.S. and Wright, W.H. 1986. Winter ice Interactions with a Arctic Offshore Structure, IAHR Symposium on Ice, Vol. III, pp 49-73, Iowa City, Iowa, USA,.
Wright, B.D. and Timco, G.W. 2000. First-year Ridge Interaction with the Molikpaq in the Beaufort Sea. Cold Regions Science and Technology 32, pp 27-44.
Wright, B.D. and Timco, G.W. 1994. A Review of Ice Forces and Failure Modes on the Molikpaq. Proc. IAHR Ice Symposium, IAHR'94, Vol. 2, pp 816-825, Trondheim, Norway. Timco, G.W. and Johnston, M. 2004. Ice Loads on the Caisson Structures in the Canadian Beaufort Sea. Cold Regions Science and Technology, Vol. 38, pp 185-209.
Timco, G.W. and Johnston, M. 2003. Ice Loads on the Molikpaq in the Canadian Beaufort Sea. Cold Regions Science and Technology, Vol. 37, No. 1, pp 51-68.