Biomimetic Electrical Stimulation for
Cardiac Tissue Engineering
by
Nina Tandon
B.E. Electrical Engineering Cooper Union 2001
Submitted to the Department of Electrical Engineering and Computer Science in of the requirements for the degree of
Master of Science in Electrical Engineering
partial fulfillment
BARKER
MASSACHUSETTS INS
at the OF TECHNCMJWV
MASSACHUSETTS INSTITUTE OF TECHNOLOGY
JAN 1
12007
August 2006
@ 2006 Massachusetts institute of Technology. Ail rights reserved.
LIBRARIES
A uth o r...
Nina Tandon Department of Electrical Engineering and Computer Science August 11,2006
C e rtified by ... ...
/oel Voldman, Co-Supervisor Associate Professor of Electrical En cheering and Computer Science Massachusetts Institute of Technology
Certified by... ...
Gordana Vunjak-Novakovic, Co-Supervisor Professor of Biomedical Engineering Columbia University
Accepted by ... ...
Arthur C. Smith Chairman, Department Committee for Graduate Students
Biomimetic Electrical Stimulation for
Cardiac Tissue Engineering
by
Nina Tandon
Submitted to the Department of Electrical Engineering and Computer Science on August 11, 2006 in partial fulfillment
of the requirements for the degree of Master of Science in Electrical Engineering
ABSTRACT
A major challenge of tissue engineering is directing cells to establish the
physiological structure and function of the tissue being replaced. Electrical stimulation has been used to induce synchronous contractions of cultured cardiac constructs. The hypothesis adopted for this study is that functional cardiac constructs can be engineered by "mimicking" the conditions present during cardiac development, and in particular, electrical stimulation using supra-threshold signals.
For this Master's Thesis research, I have compared the material properties and charge-transfer characteristics at the electrode-electrolyte interface of various biocompatible materials, including carbon, stainless steel, titanium and titanium nitride, for use as electrodes in a biomimetic system for cardiac tissue engineering. I have also designed and implemented an electrical stimulator
which is capable of modulating several important parameters of electrical stimulation, including stimulus amplitude and frequency. In addition, I have built an experimental setup incorporating this electrical stimulator and used it for experiments with C2C12 mouse myoblast cells and neonatal rat cardiomyocytes. Lastly, I have analyzed cell morphology as well as functional performance of engineered tissue by assessing excitation thresholds and maximum capture rates.
Thesis Supervisors: Joel Voldman
Associate Professor of Electrical Engineering and Computer Science Massachusetts Institute of Technology
Gordana Vunjak-Novakovic
Professor of Biomedical Engineering Columbia University
ACKNOWLEDGEMENTS
The work presented here, although written by me, is the compilation of the efforts of many people who guided and supported me along the way.
The idea of writing a "thesis" has been something I have been dreading, but my advisors Joel and Gordana have been so supportive-I feel so lucky to have been adopted by them. Gordana, that day in Starbucks, talking with you, I knew I was ready to take that deep breath and dive in--not a moment sooner. And Joel, you really made me feel like I had a home here in EECS for the first time.
Thank you Hyoungshin Park for really helping me to get started in the lab. Thank you for being patient with me, my ignorance, klutziness and many, many questions. Thank you Chris Cannizzarro for always being there to brainstorm with, and tinker with, and get late-night Indian food with, I owe you hugs beyond your hug limit. Thank you Elisa Figallo for staying up with me all those many nights taking measurements, trying to see deeper meaning in all those images. Thank you Sharon, Darja and Alex for all the laughs and advice.
I especially want to thank my parents, my sisters and my brother who have been
a veritable springboard upon which to bounce ideas, or to just eat dinner, go shopping, or walk the dog. Thank you to my friends who have endured the long-silences and excuses of a grad student in the thesis-zone. In particular, thank you Shelagh, Carla, Carol, Ohad, Jay and Jessica.
Last but not least, thank you Franz and Stormie for helping me realize there is a world where there's always a reason to giggle. A lot.
TABLE OF CONTENTS
ABSTRACT... 2
LIST OF FIGURES ... 7
INTRODUCTION ... 10
1. BACKGROUND ... 13
1.1. NATIVE CARDIAC TISSUE ... 13
1.1.1. The Cardiac Myocyte... 13
1.1.2. Electric Fields and Currents and Cardiac Development... 14
1.1.3. The Cardiac Electrical Conduction System...15
1.1.4. The Injured and Repairing Myocardium ... 17
1.2. CARDIAC TISSUE ENGINEERING ... 18
1.3. ELECTRICAL STIMULATION OF CELLS ... 20
1.3.1. Electroquasistatic Formulation... 20
1.3.2. Physiologic parameter ranges for endogenous electric-fields ... 21
1.3.3. Mechanisms of applied electric-field stimulation ... 22
1.4. ELECTROCHEMICAL BEHAVIOR OF STIMULATION MATERIALS ... 23
1.4.1. Porous Carbon ... 23
1.4.2. Titanium (Commercially Pure Grade 2) ... 23
1.4.3. Titanium Nitride coated Titanium (Commercially Pure Grade 2)... 24
1.4.4. Stainless steel, type 303... 24
1.4.5. Electrochemical Impedance Spectroscopy (EIS)... 24
1.4.6. Equivalent Circuit Models for Electrochemical Systems... 26
2. MATERIALS AND METHODS... 30
2.1. CELL PREPARATION ... 32
2.1.1. Isolation of neonatal rat cardiomyocyte cells ... 32
2.1.2. Preparation of C2C12 mouse myoblast cells ... 33
2.1.3. Scaffold Preparation and Seeding ... 34
2.2. BIOREACTOR ASSEMBLY... 34
2.3. ELECTRICAL CHARACTERIZATION OF BIOREACTOR... 35
2.3.1. EIS Measurements of Bioreactor... 36
2.3.2. Current Measurement in the Bioreactor... 36
2.4. ELECTRICAL SIMULATION OF CONSTRUCTS ... 37
2.5. ASSESSMENTS ... 37
2.5.1. Contractile Activity... 38
2.5.2. Histological Analysis...39
2.5.3. Ultrastructure Analysis ... 39
3. RESULTS AND DISCUSSION ... 41
3.1. ELECTRODE CHARACTERIZATION... 41
3.1.1. Surface properties of electrodes ... 41
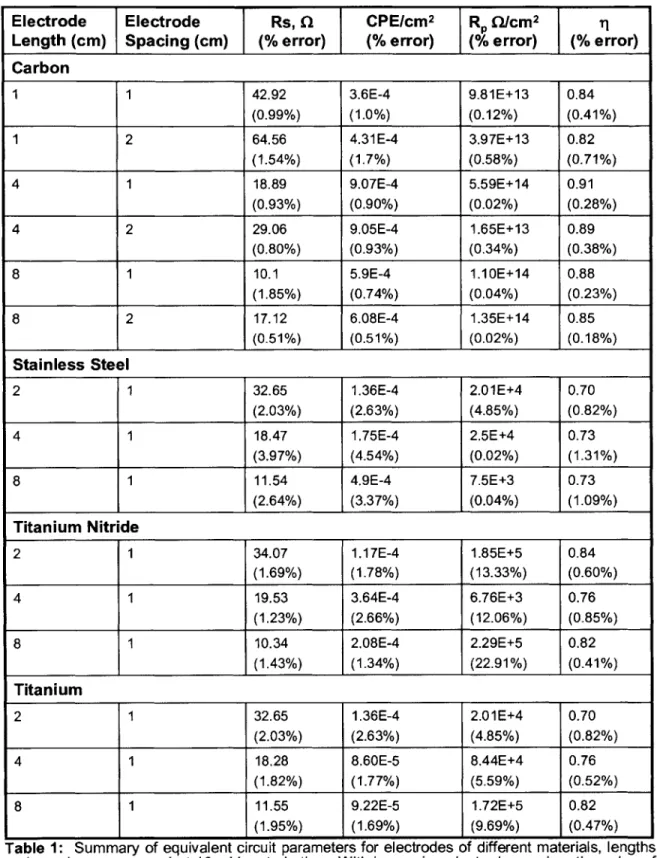
3.1.2. Electrode material ... 42
3.1.3. Electrode geometry ... 43
3.1.4. Electrode ageing ... 47
3.1.5. Input Voltage ... 48
3.1.6. Carbon rods in PBS versus DMEM +10% serum ... 49
3.1.7. Current Injection... 50
3.2. BIOREACTOR AND STIMULATOR DESIGN ... 51
3.2.1. Bioreactor Design... 51
3.2.2. Stimulator Design... 53
3.3. BIOLOGICAL RESULTS ... 55
3.3.1. Functional Results ... 55
3.3.1.1.Modulating Electric Field Stimulus via Electrode Spacing... 56
3.3.1.2.Modulating Electric Field Stimulus via Stimulation Amplitude ... 57
3.3.2. Morphological Results ... 58
4. SUM M ARY AND FUTURE W ORK ... 63
4.1. SUMMARY... 63
4.2. FUTURE W ORK... 63
4 .2 .1 . C e ll C u ltu re ... 6 3 4.2.2. Further experiments... 64
4.2.3. Bioreactor Design... 64
4.2.4. Development of better readouts ... 65
6. APPENDIX... 70
6.1. PROTOCOLS... 70
6.1.1. Isolation of neonatal rat cardiomyocyte cells ... 70
6.1.2. Preparation of C2C12 mouse myoblast cells ... 70
6.1.3. Scaffold Preparation and Seeding ... 71
6.1.4. Bioreactor Assembly...71
6.1.5. EIS measurements of bioreactor ... 72
6.1.6. Current Measurement in the Bioreactor... 72
6.1.7. Choice of the Electrode Material... 73
6.1.8. Electrical Simulation of Construct... 73
6.1.9. Contractile Activity... 74
6.1.10. Histological Analysis ... 74
LIST OF FIGURES
Figure 1: Schematic diagram showing the sequence of activation of the myocardium. The cardiac action potential is initiated in the sinoatrial node and spreads throughout the myocardium, as shown by the arrows. Figure is reprinted fro m [1 8 ]... 1 6
Figure 2: (a) The equivalent circuit of a simple electrochemical "Randles" cell, where Rs represents the solution's resistance, Cdouble layer. the double layer capacitance, and Rp the polarization resistance. (b) The equivalent circuit of a simple electrochemical cell with a CPE instead of a double-layer capacitance. This equivalent circuit is generally a more accurate description of electrochemical system s.. . ... . . 26 Figure 3: Nyquist and Bode plots for circuit models of Randles cells of Rs = 100l, Cdl = 1pF, q=1, and increasing values of Rp (and therefore corrosive
reactions). As the value for Rs increases, the Nyquist plot looks less and less semi-circular, and the Bode plot looks less and less like that of an ideal capacitor.
... 2 9 Figure 4: Nyquist and Bode plots for circuit models of Randles cells of Rs = 1000, Cdl = 1pF, Rp=1E+6 ) and increasing values of q. As the value for r
increases, the Nyquist plot looks more and more semi-circular, and the Bode plot looks more and more like that of an ideal capacitor. ... 29 Figure 5: Overview of experimental setup. A computer running custom software generates the pulse shapes which are then reproduced with more power by the amplifier circuit, and then connected via wires to the bioreactors located inside an incubator m aintained at 370 C. ... 31
Figure 6: Assembled bioreactor. A. 60 mm Petri dish with carbon rod
electrodes, spaced 1 cm apart. B. Close up view of scaffold positioned between electrodes and held in place with two stainless steel pins... 35
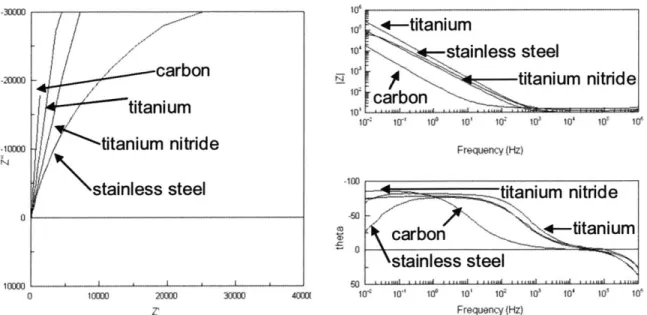
Figure 7: (a) 30x scanning electron microscopy (SEM) images of electrodes, 1/8" diameter. White bar corresponds to 500 pm. Higher surface porosity contributes to higher levels of current injection. (b) At 1000x magnification the difference in porosity of carbon versus titanium and titanium nitride is less obvious, implicating the importance of other factors including electrode surface nanostructures, and chemical and material properties for explaining charge storage capacity differences among carbon, titanium and titanium nitride. Stainless steel, however, still has no visible pores at this magnification. White bar corresponds to 1Opm . ... 42 Figure 8: Nyquist and Bode plots comparing 4cm long electrodes of different materials, placed 1cm apart. The semicircular shape of stainless steel in the Nyquist plot (B) suggests the presence of reactions, whereas titanium, titanium nitride, and carbon have progressively more linear profiles associated with high polarization resistance... 43 Figure 9: Calculated theoretical solution resistance for different geometries of PBS and measured solution resistance in electrochemical systems of corresponding geometries comprised of carbon electrodes for (A) electrodes of 4
cm length and increasing distances, and (B) electrodes placed 1 cm apart and of increasing lengths. ... 44
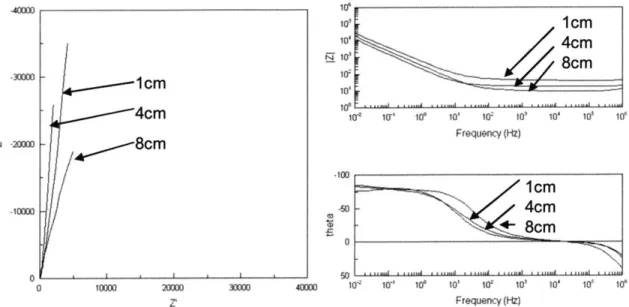
Figure 10: Nyquist and Bode plots of carbon rod electrodes spaced 1 cm apart,
and of different lengths, in PBS. The main value to change for the electrode configurations is the value of Rs, the high-frequency value of IZI on the Bode p lo t. ... 4 5
Figure 11: EIS characterization and equivalent circuit parameters for 4 cm long
carbon rod electrodes spaced 1 cm apart before and after one experiment of 5
days of continuous electrical stimulation of 5V, 2 ms pulses delivered at 1 Hz from 4 cm carbon rods spaced 1 cm apart. The perturbation voltae was 10 mV. The effect of one experiment's worth of aging on the carbon rod electrodes is that the electrode's CPE has dramatically increased, but its polarization resistance remains largely unchanged. Moreover, the electrode behaves less-ideally like a capacitor, as evidenced in the drop in q after ageing ... 47
Figure 12: EIS characterization and equivalent circuit parameters for carbon rod
electrodes measured with a range of perturbation voltages. With increased perturbation, the polarization resistance, il and CPE all decrease... 48
Figure 13: EIS characterization and equivalent circuit for carbon rod electrodes
in a PBS versus DMEM+10% serum culture medium for electrodes 4 cm long and 1 cm apart. Table of calculated equivalent circuit parameters is for the D M E M so lutio n ... . . 4 9 Figure 14: Current measured in bioreactor over 5 V, 2 ms square wave pulse,
along with calculated injected charge and unrecovered injected charge (see
Section 2.3.2 for methods of calculation). The total net amount of injected
charge in coulombs is equal to area beneath each curve at that time point... 50
Figure 15: Power spectral densities calculated for (black) an ideal pulse of
amplitude 5 V, 2 ms duration, delivered at a frequency of 1 Hz, and (pink) a measured pulse delivered from the cardiac stimulator employed in this study with the same parameters. More than 90% of stimulus power is in the bandwidth < 1
kHz for the measured pulse, which agrees with the theoretical calculation... 52
Figure 16: Operational Amplifier in unity gain mode. Device must be
unity-gain-stable to be used in this configuration. ... 53 Figure 17: Stimulus waveform from commercial stimulator with low current
rating. When a bioreactor is attached (pink), the stimulus waveform (blue) is no longer faithfully applied... 54
Figure 18: Printed circuit board layout for 8-channel amplifier board. ... 55 Figure 19: Experimental setup for study involving the modulation of electric field
strength via electrode spacing. Stimulated group was submitted to monophasic, square pulses of 2 ms in duration and 1 Hz frequency. Electric field stimulus was modulated by the spacing of the electrodes. ... 56 Figure 20: The measured excitation thresholds and maximum capture rates for
scaffolds stimulated at various levels in culture. Of the stimulated constructs, there is a decrease and subsequent increase in excitation threshold,
corresponding to an increase and subsequent decrease in maximum capture rate. At stimulation levels >= 10 V/cm, there was no observed contraction, suggesting that there is an optimal level of stimulation below this level... 56
Figure 21: Experimental setup for study involving the modulation of electric field
strength via stimulation amplitude. Stimulated group was submitted to monophasic, square pulses of 5V in amplitude, 2 ms in duration and 1 Hz frequency. Electrode spacing was kept constant at 1.0 cm and the electric field stimulus was modulated by the increasing amplitude of the stimulus waveform.
... 5 7 Figure 22: The measured excitation thresholds and maximum capture rates for
scaffolds stimulated at various levels in culture. There is a decrease in excitation threshold accompanying increasing levels of electrical stimulation, although at stimulation levels >= 8 V/cm, there was some observed lack of contraction, suggesting that there is an optimal level of stimulation below this level. Maximum capture rates also increased at stimulation levels <=5V/cm, but decreased for stimulation = 8V/cm, at which point not all scaffolds were induced to contract, again suggesting that optimal stimulation levels are < 8 V./cm. ... 57
Figure 23: Confocal images of engineered tissue constructs stained for Troponin-l (green, cardiomyocytes), Vimentin (red, non-mocytes) and cell nuclei (bliue). White bar corresponds to 100 pm. With increasing levels of stimulation, the density of non-myocytes appears to decrease. ... 59
Figure 24: Confocal images taken at (A) the cell surface and (B) 100pm below
the surface, of constructs stained for cardiac Troponin-I (green) and cell nuclei (blue). Cells 100 pm below the surface appear round and unhealthy. This distance corresponds to the penetration depth of oxygen, and indicates that a perfusion based system would allow the engineering of thicker constructs... 61
Figure 25: Constructs stained for connexin-43 (green) and cell nuclei (blue).
Connexin-43 resides less in the cell's cytosol at the stimulation amplitude of 5 V/cm than for stimulation amplitudes of either 2.5 V/cm or 6.25 V/cm. ... 61
Figure 26: Elongation of C2C12 cells stimulated on collagen scaffolds. C2C12
cells stained for cardiac Troponin-l (green) and DAPI for cell nuclei (blue). A. Scaffolds subjected to stimulation of 5V, 2 ms pulses delivered at 1 Hz for 5 days of culture show remarkably more alignment in addition to elongation than B. those not subjected to any electrical stimulation. ... 62
INTRODUCTION
Over 7 million people in the United States have suffered from myocardial infarction, and our country's aging population will undoubtedly increase this number [1]. Myocardial infarction typically results in fibrotic scar formation and permanently impaired cardiac function because, after a massive cell loss due to ischemia, the myocardial tissue lacks intrinsic regenerative capability. Heart transplantation is the ultimate solution to end-stage heart failure, but is problematic due to the lack of organ donors and complications associated with immune suppressive treatments. New solutions are needed, therefore, to regenerate hearts damaged by cardiovascular disease, alleviate the shortage of heart donors, test new drugs, and study general cardiac tissue development and function. In the past few years, cardiac tissue engineering has emerged as a new and ambitious approach combining engineering techniques with cell biology and medicine. It has been suggested that to create a functional (synchronously contracting) cardiac patch, one may need to cultivate three-dimensional cell constructs in bioreactors designed to reproduce some of the conditions experienced by the cells in normal heart tissue [2].
A biomimetic approach to cardiac tissue engineering may be designed to
recapitulate any number of aspects of the actual in vivo environment. An important property of vascularized tissues, for example, such as myocardium, is that cells receive oxygen via convection of blood through a capillary network and diffusion into the tissue space surrounding each capillary. Moreover, the oxygen-carrying capacity of blood is greatly enhanced by the presence of hemoglobin, a natural oxygen carrier. A biomimetic approach to cardiac tissue engineering may imitate these characteristics by crafting a convective-diffusive oxygen supply and providing oxygen carriers in the culture medium. In a recent study employing perfusion of culture medium through channeled scaffolds (to mimic the role of capillary network), and supplementation of oxygen carriers (to mimic the role of hemoglobin), for example, higher amounts of DNA and cardiac markers, including troponin I, and connexin-43 was observed, and constructs exhibited significantly better contractile properties as compared to control constructs [3].
In vivo, cells in the heart are also exposed to a cyclic stretch associated with the
pumping action of the heart. In a recent study, a biomimetic system applying cyclical stretch to tissue engineered constructs rings of cardiac tissue was employed and these patches contracted more vigorously than unstretched patches [4]. Moreover, in native myocardium, these macroscopic synchronous contractions are induced by electrical signals from the heart's electrical conduction system, (see Section 1.1.3 for details), and in another recent study, a biomimetic system designed deliver electric signals mimicking those in native heart tissue was shown to induce contraction of cardiac constructs cultured in
vitro in response to a pulsatile electrical field. In addition, the investigators
reported that electrical stimulation resulted in the progressive development of conductive and contractile properties characteristic of heart muscle after just 8 days of culture [5]. One important area of work implicated by this study was that of further optimizing the conditions of electrical stimulation.
For this study, therefore, I have focused on the electrical stimulation component of a biomimetic system designed to promote orderly coupling between electrical signals and cell contractions in a way similar to that in native myocardium [6]. More specifically, I have examined the material properties and charge-transfer characteristics at the electrode-electrolyte interface of various biocompatible materials, including carbon, stainless steel, titanium and titanium nitride. I have also designed and implemented an electrical stimulator which is capable of modulating several important parameters of electrical stimulation, including stimulus amplitude and frequency. In addition, I have built an experimental setup incorporating this electrical stimulator and used it for experiments with C2C12
mouse myoblast cells and neonatal rat cardiomyocytes. Lastly, I have analyzed functional performance of engineered tissue by assessing excitation thresholds and maximum capture rates, as well as cell morphology.
In this thesis document, I first provide a background covering native cardiac tissue (Section 1.1), as well as cardiac tissue engineering (Section 1.2) before covering basic principles of electric stimulation of cells (Section 1.3) and electrochemical behavior of stimulation materials (Section 1.4). Next, I give an overview of the experimental materials and methods employed in performing the studies described in this study, including those for cell preparation (Section 2.1), bioreactor assembly (Section 2.2), electrical characterization of the bioreactor
(Section 2.3), electrical stimulation of constructs (Section 2.4), and assessments (Section 2.5). Next, I present and discuss the results obtained in
this study for electrode characterization (Section 3.1) bioreactor and stimulator design (Section 3.2) and biological results (Section 3.3). Finally, I conclude with a summary and discussion of possible future work implicated by this study
(Section 4).
This research is intended to contribute to the goal of engineering a cardiac muscle construct through elucidating the proven beneficial effect of electrical stimulation on cardiac myocytes cultured on scaffolds. This knowledge will hopefully inform future work involving optimization of the conditions of electrical stimulation for cardiac tissue engineering.
1.
BACKGROUND
1.1.
NATIVE CARDIAC TISSUE
A good cardiac patch should replace native myocardium and reproduce
contractile function when implanted in situ. In order to do so, it should be composed of differentiated, aligned cardiac cells, exhibit tissue-like contractile function, and after implantation, survive and vascularize. A short review of cardiac tissue is therefore in order.
1.1.1. The Cardiac Myocyte
The myocardial cell population consists largely of cardiac myocytes that occupy approximately 90% of the myocardial mass [7]. By mass, 90% to 95% of the nonmyocyte fraction of cardiac cells consists of cardiac fibroblasts, which are mainly responsible for the synthesis of major extracellular matrix proteins in the heart, including fibrillar collagen types I and Ill and fibronectin [7]. Remaining cells are endothelial cells comprising the heart's vasculature. It is interesting to note, however, that in the normal adult mammalian myocardium, there is at least one capillary next to every cardiomyocyte, and so although the mass of cardiomyocytes in a mammalian heart is approximately 25 times that of cardiac endothelial cells, the smaller endothelial cells outnumber cardiomyocytes by 3:1
[8].
The cardiac myocyte may be considered the most physically active cell in the human body. It contracts constantly, perhaps 3 billion times or more in an average human lifespan. Moreover, it coordinates its beating activity with 3 billion other myocytes in the main pump of the human heart [9]. There are three main types of cardiomyocytes: The first, and perhaps the archetypal cell, is the ventricular cardiomyocyte, which is responsible for the powerful contractions that constantly pump blood throughout the body. Their counterparts in the atria, whose action facilitates filling of the ventricles, are similar, although atrial cells are long and slender, and also, by producing the hormone atrial natriuretic peptide, function as secretory cells. A third somewhat heterogeneous group of myocytes makes up the heart's impulse generation and conduction system-these cells are responsible for generation of the impulse and its precisely timed
distribution to the working cells of the chambers at the appropriate point in the cardiac cycle [9].
One of the most important features of myocardium is its high density of gap junctions, which are clusters of channels spanning the membranes of closely opposed cells [9]. Gap junctions also form the cell-to-cell pathways for direct transmission of chemical signals, which are of prime importance during development and differentiation [9]. Experiments have shown that the ultrastructure and protein composition of gap junctions isolated from rat ventricles are tissue specific, i.e., markedly different from gap junctions in the liver and lens
[10]. Moreover, gap-junction variability within the heart itself also appears to
contribute to the distinctive electrophysiological properties of different myocyte subsets in different regions of the heart [9]. Connexin43 is by far the most abundant gap-junction protein in the ventricles and atria of mammalian cardiomyocytes, although connexin40 and connexin45 are now known also to be locally expressed in specialized zones [9].
1.1.2. Electric Fields and Currents and Cardiac Development
The effects of current and voltage in biological systems are intertwined because the voltages across cell membranes and epithelia have their roots in ionic pumps, and these current loops generate electric fields, the magnitude of which depends on the resistance of the tissues in its path [11]. The presence of endogenous electric fields and currents in the developing vertebrate embryo has been widely documented [12]. The main roles for electric currents in embryonic cardiac development are hypothesized to revolve around directing cell migration during the development of the cardiac primitive streak, the development of cardiac left-right asymmetry, and the development of a cardiac synctium [12-14]. During gastrulation, occurring early in the development of animal embryos, the morphology of the embryo is dramatically restructured by cell migration. During gastrulation and the formation of the nervous system, it has been hypothesized that three-dimensional gradients of voltage provide coordinates for embryonic morphogenesis by providing a coarse guide for galvanotactic cell migration [15]. One of the most important features of the developing vertebrate heart is that of left-right asymmetry. Errors in the proper patterning of this axis are believed to
lead to congenital anomalies of the heart, often with profound clinical consequences [16]. It has been suggested that one of the earliest patterning roles for ion flux is in the emergence of the left-right axis. As early as 1956, it was reported that a DC electric current imposed across the chick blastoderm was able to induce a high number of cardiac reversals [15].
In addition to left-right asymmetry and directed cell migration, electric currents have also been implicated in the development of the cardiac synctium via the development of synchronous contractions of uncoupled, contracting, cells [14]. The mechanisms of this coordination are via partial and full depolarization of nearby cells and lead to the formation of low-resistance coupling junctions at the contact interface [17].
1.1.3. The Cardiac Electrical Conduction System
To produce a heartbeat, the contractile capabilities of the billions of myocytes that make up the heart must be synchronized not only physically, so as to transmit contractile forces from one cell to the next, but also electrically, so as to coordinate the spread of the wave of electrical activation. As stated in Section
1.1.1, there are two types of muscle cells in the heart: contractile cells comprising
the majority of the atrial and ventricular tissues of the heart, which lead to contraction and generation of force or pressure, and conducting cells, which are specialized muscle cells that do not contribute significantly to the generation of force, but instead function to rapidly spread action potentials over the entire myocardium [18]. Conducting cells comprise the tissues of the sinoatrial (SA) node, the atrial internodal tracts, the atrioventricular (AV) node, the bundle of His, and the Purkinje system. Another specialized feature of the conducting muscles of the heart is their capacity to spontaneously generate action potentials [18].
Sinoatnal node - -Right Left atrium atrium Atrioventricular node Bunde of His -(common
bundle)-(o nb -- Left bundle branch
Right bundle branch Right Left
ventricle ventricle
2' ~ -Purkinje fibers
Figure 1: Schematic diagram showing the sequence of activation of the myocardium. The cardiac action potential is initiated in the sinoatrial node and spreads throughout the myocardium, as shown by the arrows. Figure is reprinted from [18].
Action potentials are electrical potentials (voltages) which have their origin in membrane potentials. Changes in membrane potential are caused by the flow of
ions into or out of the cell, where differences in the concentrations of positive and negative ions give a localized separation of charges [18]. Normally, as shown in Figure 1, the action potential of the heart is initiated in the SA node, which serves as the pacemaker, and from there it spreads to the right and left atria via the atrial internodal tracts. Simultaneously, it is conducted to the AV node. From the AV node the action potential is distributed to the ventricles via the bundle of His, the main bundle branches to each ventricle, and Purkinje system [9, 18]. Rapid conduction of action potentials is facilitated by the presence of gap
junctions.
An important feature of the cardiac electrical conduction system is that conduction properties in myocardium are anisotropic, with more rapid conduction
in the direction parallel to the myocardial fiber axis than in the transverse
parallel to the long axis of the myocardial fiber bundles is approximately three times more rapid than in the transverse direction [19]. This property is attributable principally to the higher conductivity of myocardium in the longitudinal direction, in comparison to the transverse. Morphologically, this difference in conduction is due to the elongation of the myocardial cells-the action potential's pathway encounters fewer cell boundaries per unit distance in the longitudinal direction, in comparison to the transverse [19].
1.1.4. The Injured and Repairing Myocardium
One of the goals of a cardiac tissue engineered patch is to aid those who have suffered from myocardial infarction, and so a brief description of the mechanisms of injury and repair in the heart is in order. After non-fatal myocardial infarction, the inflammatory response is activated. Cytokine elaboration is particularly active after myocardial infarction and contributes to cardiac remodeling [20]. Acutely, cytokines contribute to survival or deaths of myocytes, modulation of cardiac contractility, alterations of vascular endothelium, and recruitment of additional circulating cells of inflammation to the injured myocardium, which leads to further local oxidative stress and remodeling but also initiates the processes of wound healing. Chronically, cytokines can mediate repair and remodeling through activating matrix metalloproteinases and collagen formation, and regulating integrins and angiogenesis and progenitor cell mobilization [20].
The loss of the normal ordered distribution of connexin43 gap junctions is particularly conspicuous in the myocardial zone bordering infarct scar tissue, where gap junctions are scattered extensively over myocyte surfaces, creating blocked tissue, and contributing to arrhythmia [21]. Clearly ordered intercalated disk arrays remain intact in zones distant from the infarct zone, however [21]. In addition, action potential prolongation, which is the result of functional downregulation of K currents, and aberrant Ca 2 handling is also a recurrent
theme [22].
The deposition of a fibrotic connective tissue scar after infarction distorts the normal relationship of the surviving myocardial fiber bundles, since the connective tissue may invade and separate muscle fibers [23]. This separation results in a disruption of the normally well-defined directional differences in
impulse propagation, and may contribute to the occurrence of chronic arrhythmias in healed infarcts.
1.2. CARDIAC TISSUE ENGINEERING
The field of cardiac tissue engineering was motivated by the limited ability of the myocardium to regenerate after injury and the shortage of organs for transplantation. As a replacement for native myocardium, engineered heart tissue should therefore reproduce contractile function when implanted in situ. In
order to accomplish this basic functionality, engineered myocardium should be composed of differentiated, aligned cardiac cells, exhibit tissue-like contractile function, and, after implantation, survive and vascularize.
The first efforts to regenerate functional myocardial tissue in the mid 1990s adopted the strategy of cell injection [2]. The proof-of-principle experiments of cardiac cell implantation in the heart were first achieved a decade ago using genetically selected embryonic stem cell-derived cardiomyocytes [2]. In 2001, Kocher et al. reported that the implantation of human bone-marrow derived angioblasts could improve cardiac function [24]. Although these studies reported being able to improve contractile function, high percentages of the injected cell suspension (over 90%) have been reported to be lost and did not engraft [2]. This finding suggests that functional integration of the injected cells might not be required in order to achieve a beneficial effect on cardiac function, and that the improvement results from some other mechanism such as inducement of neovascularization and subsequent increases in perfusion[24]. Nonetheless, because the injected cells showed poor alignment, increasing the risk for arrhythmia, and poor differentiation, they are not considered useful as engineered cardiac tissue.
The concept of tissue engineering using three-dimensional scaffolds has certain advantages over the direct injection of cells for the repair of the wounded heart. Firstly, the scaffolds themselves may replace the missing or damaged extracellular matrix in the infarcted area and provide temporary support for the cells repairing the wound, whether implanted or from the host. Furthermore, while producing a tissue-engineered construct, one may control the size, shape, elasticity and strength of the graft in vitro, and improve the engraftment ratio,
alignment, and differentiation of implanted cells, in addition to increasing the size of engineered tissue to a useful clinical size and improving the contractile function of an implanted cardiac graft.
A variety of studies have been undertaken using an assortment of synthetic
biodegradable scaffolds with different types of cells, in which the engineered tissue for implantation would be cultured under conditions improving contractile function, differentiation and alignment. Several groups have reported encouraging results with various techniques for constructing beating cardiac patches for transplantation. Shimizu et al. grew rat cardiomyocytes on polymer surfaces that promoted the detachment of the thin cell layers when the temperature was reduced [25]. They implanted four such fused layers and implanted the "patch" subcutaneously in a rat. The patch survived, was vascularized, and was still beating six months later, but is still too small to be considered of clinical relevance [25]. Eschenhagen et al. created rings of cardiac tissue using cardiomyocytes from neonatal rats to which they applied cyclical stretch. Zimmerman et al. showed that these patches contracted more vigorously than unstretched patches [4]. Although the application of mechanical stretch improved cell differentiation and the force of contraction, the distribution of gap junctions remained disorganized, and cells were missing M-bands and intercalated discs, which are important features of differentiated cardiac tissue
[5].
Costa et al., while investigating the generation of electrical and mechanical anisotropy in engineered heart tissue, showed that fibroblasts, previously thought to align randomly and independently of geometry, in fact align according to the free edges of gels [18]. This result suggests that the presence of voids and free surfaces such as the endocardium and epicardium, cleavage planes, and blood vessels, may play a role in governing cell and fiber alignment in developing and remodeling myocardium, myocardial scar tissue, and engineered heart constructs. Their study, however, did not investigate the alignment of cardiomyocytes themselves.
Recently, Radisic et al. reported improved functional assembly of engineered myocardium by culturing myocardium in the presence of suprathreshold pulsatile electric fields. They were able to induce a remarkable enhancement of cell
alignment and coupling, synchronous construct contractions, and ultrastructual organization [5]. They did not, however, investigate whether the alignment induced in their engineered cardiac patches produced any level of electrical anisotropy. Moreover, they did not report any optimization of the electric field stimulus.
This study will adopt a similar methodology to that undertaken by Radisic et al., and will focus on the investigation of the functional performance of engineered cardiac tissue constructs through the use of modulated electric fields for cardiac tissue engineering.
1.3. ELECTRICAL STIMULATION OF CELLS
Tissue in general, including excitable tissue, is surrounded by extracellular fluid with relatively high conductivity (3-12 mS/cm) [26]. In vitro, this case holds as well, since the conductivity of the culture medium is comparable to that of extracellular fluid (15 mS/cm). Since the electrodes used for stimulation are placed in this conductor composed of this fluid, it is essential to understand how the currents and electric fields are distributed within it, under normal and stimulated conditions.
1.3.1. Electroquasistatic Formulation
In simple cases such as a homogenous, isotropic medium, and where the system under consideration is much smaller than the wavelengths of interest (for biological systems generally under 10 kHz), the calculation of the electric fields can be performed by solving Maxwell's equations, assuming electroquasistatic conditions [26]. The electroquasitatatic formulation is as follows:
Conservation of Charge: V -J = 0 (Eq. 1.3.1.1)
Gauss' Law: V-E= (Eq. 1.3.1.2)
Ohm's Law for conductors: J = AE (Eq. 1.3.1.3)
Electric Field: E =-V0 (Eq. 1.3.1.4)
Where E is the electric field (V/m) defined as the negative gradient of the scalar potential 4; J is the current density (Aim); a is the conductivity (S/m); p is the
charge density (C/m3); c is the permittivity of the medium (F/m); and V-A is the divergence of the vector A.
In any electrochemical system, a change in electrical potential occurs upon crossing from one conducting phase to another (from the metal electrode to the electrolyte) at the interface itself, in a very narrow interphase region, thus forming an electric field (measured in V/m) at the interface. This change in potential exists even in the equilibrium condition (no current) [27]. Electrochemical reactions may occur in this interphase region if the electrical potential profile is forced away from the equilibrium condition. In the absence of current, the electrical potential is constant (no gradient) throughout the electrolyte beyond the narrow interphase region. During current flow, a potential gradient exists in the electrolyte, generally many orders of magnitude smaller than at the interface [27]. Assuming electroquasistatic conditions, the electric field lines in this system will
resemble those of a standard electric dipole [26].
1.3.2. Physiologic parameter ranges for endogenous electric-fields
Historically, there has been a much longer association of electricity with death than life. Zeus, for example, hurled thunderbolts to destroy his enemies, not revive them. The association between electricity and life, however, was discovered in 1786, when Luigi Galvani, a professor of anatomy and surgery at the University of Bologna, was researching a dissected frog in his laboratory as a thunderstorm raged outside. To his surprise, the frog's leg muscle twitched whenever his scissors touched a nerve, and he wondered if through the air, the lightning could have exerted some subtle influence on the frog's nerves and muscles [28]. It is now of course widely known that not only are many cells within the body sensitive to electrical stimuli, but that the body also generates
much electricity during daily life.
For vertebrates, the physiologically significant range of endogenously produced electric field strengths is likely to be between 0.1-10 V/cm: 1-2 V/cm fields have been measured on either side of the cut surface of wounds, for example, owing to either ion flux through leaky cell membranes or transepithelial potential driven
by Na+ pumps [29]. Similarly, fields of 0.4-1.4 V/cm have been measured during
In addition to injuries being a source of electricity, the beating heart is a large bioelectrical source in the body, but whether or not this presents a source of endogenous electrical stimulation is unknown, and so measured endogenous potentials due to heart-induced electrical stimulation may present a lower limit to physiologically relevant electrical stimulation levels. Peak-to-peak electric fields inside a rat's chest due to cardiac function were found by Miller and Creim to be between 0.02 and 0.03 V/cm, and Hart and Gandhi have calculated that this field can reach other organs in the body such as the lungs, stomach, and liver at the same order of magnitude or one below [31].
1.3.3. Mechanisms of applied electric-field stimulation
The electric charges in a physiologic medium are carried by ions and those in traditional electric circuitry and electrodes by electrons. At the interface is a transduction of charge carriers from electrons to ions. During an applied stimulus to a physiologic medium, a redistribution of charge occurs: at the interface that is driven negative, the metal electrode has an excess of negative charge. This will attract positive charge (cations) in solution towards the electrode and repel negative charge (anions). At the second electrode, the opposite processes occur, i.e. the repulsion of anions by the negative electrode is countered by attraction of anions at the positive electrode. In the interfacial region and bulk solution, there will be net electroneutrality [27]. The application of electrical stimulation thus induces hyperpolarization at the anode end of the cell and depolarization at the cathode end of the cell [32]
In addition to hyperpolarization, intense electric fields may stimulate cells via electroporation of the cell membrane, by causing the cellular membrane potential to increase to levels above 300 mV, as associated with defibrillation of the heart
[33] and DNA transfection. Other possible mechanisms for electric field stimulation are via the alteration of receptor conformations, motion of receptors or channels with the cellular membrane via electrophoresis, or activation of calcium channels [29].
1.4. ELECTROCHEMICAL
BEHAVIOR
OF
STIMULATION
MATERIALS
When compounds are lacking in biocompatibility, the recipient of an implant may experience long-lasting chronic inflammation, exposure to cytotoxic chemicals, and the implanted device itself may be corroded. Progress in material and coating technologies have brought forth a number of materials suitable for electrostimulation and sensing applications, in addition to stainless steel. These include titanium nitrides, titanium as a substrate material, and different forms of carbon.
1.4.1. Porous Carbon
Carbon exhibits a unique ability to form a wide variety of structures [34] including Buckeyballs, nanotubes, graphite and diamond. The carbon rod electrodes utilized in this study are engineered for high-current density since their main application is in carbon rod evaporation systems for electron microscopy, and for carbon nanotube generation. Such carbon is extremely pure (< 2ppm other elements) [35, 36].
The electrochemical behavior of carbon electrodes is closely tied to the amount of surface area the electrode presents to the electrolyte. Nanoporous carbon electrodes, for example, have been shown to deliver more charge, than smooth, glassy carbon electrodes [37]. In fact, porous carbons are widely used as the electrode materials in electric double-layer capacitors due to their high surface area, good electrical conductivity, and high corrosion resistance [38]. There is a limitation, however, in utilizing the total capacitance of nanoporous electrodes at high charge/discharge rates because the full porosity of the electrodes may not be available [37, 38].
1.4.2. Titanium (Commercially Pure Grade 2)
Titanium is very strong yet weighs about half as much as steel, nickel, and copper alloys. In addition to being strong yet lightweight, titanium has excellent corrosion resistance [39]. Ti has been used as a substrate material for coated electrodes; it has excellent corrosion resistance and biocompatibility in bone tissue, but less blood compatibility in cardiovascular systems [40]. In electrochemical systems, there is a thin TiO2 layer on the surface, and with
while decreasing its resistance to corrosion [40]. However, this increase in capacitance may not be fully utilized at high frequencies if part of the effective surface area is inaccessible.
1.4.3. Titanium Nitride coated Titanium (Commercially Pure Grade 2)
TiN is used as a surface coating for stimulation electrodes because it is stable under ambient conditions, although some oxidation occurs when exposed to air and oxygen [40]. Grade 2 titanium nitride coated titanium is characterized by overall hardness, heat resistance, oxidation resistance, and lubricity. TiN is also a biocompatible coating that has been approved by the medical industry for years used as the finishing touches to implants and surgical devices [41].
1.4.4. Stainless steel, type 303
Grade 303 stainless steel is the popular name for stainless steel type 1.4305. Grade 303 is the most readily machineable of all the austenitic grades of stainless steel [42]. The machineable nature of grade 303 is due to the presence of Sulphur in the steel composition. Whilst the Sulphur improves machining, it also causes a decrease in the corrosion resistance and a slight lowering of the toughness. The corrosion resistance of type 303 is lower than that for 304, for example. The toughness is still excellent as with other austenitic grades.
In addition to its relatively low corrosion resistance, the presence in its composition of a high quantity of nickel, an agent known to trigger toxic, allergic and cancerogenous responses in humans, is also the cause of some concern [43].
1.4.5. Electrochemical Impedance Spectroscopy (EIS)
Stimulation efficiency is determined by the ability to attain a desired physiological response with minimal damage to the surrounding tissue. For each application, electrical stimulation conditions should be optimized by not only choosing appropriate electrode geometry but also by studying electrode material properties and charge-transfer characteristics at the electrode-electrolyte interface.
Electrodes must be biocompatible to avoid toxic or immune responses in the adjacent tissue or medium, and they should efficiently transfer charge from the electrode material where it is carried by free electrons to the medium or tissue
where it is carried by ions. Charge transfer can occur through three mechanisms: (i) non-faradaic charging/discharging of the electrochemical double layer, (ii) reversible faradaic reactions, and (iii) non-reversible faradaic reactions [27]. The first two mechanisms are desirable, while the last should be avoided because it is associated with electrode degradation and harmful byproducts. The relative presence of each mechanism can be assessed using electrochemical impedance spectroscopy (EIS), from which an equivalent circuit of the stimulation system can be constructed.
EIS is a general term referring to the measurement of the linear electrical
response of a material of interest and the subsequent analysis of the response to yield information about the electrochemical properties of the system [44]. Electrochemical impedance is usually measured by applying an AC potential to the electrochemical system and measuring its current for a range of frequencies. In normal EIS practice, a small (1 to 10 mV) AC signal is applied to the electrochemical system at hand. The signal is small enough to keep the system confined to a pseudo-linear segment of the cell's current versus voltage curve. Moreover, the system being measured should be at a steady state throughout the time required to measure the EIS spectrum, and measuring an EIS spectrum may often take many hours if the range of frequencies under study includes those under 101 Hz. A small signal reduces the likelihood that the system will drift out of a steady-state condition [45]. For our purposes in this study, we compare the use of several different electrode types for use bioreactors, and these bioreactor may deliver much higher voltages to the cells being cultured (on the order of 1-10 V). By performing EIS measurements with different input
voltages, therefore, although the systems themselves are likely not at steady state, we can compare the responses of the different electrodes to different input voltages in order to determine the ease with which the systems drift out of steady state, which is useful for predicting bioreactor performance.
After an EIS measurement is taken, common practices include generating Nyquist and Bode plots, as well as using EIS data to generate equivalent circuit models of the system. The relative presence of faradaic, reversible-faradaic and non-faradaic reactions can then be assessed.
1.4.6. Equivalent Circuit Models for Electrochemical Systems
EIS data is commonly analyzed by fitting it to an equivalent electrical circuit
model, which usually includes common circuit elements such as resistors, capacitors, and inductors. When EIS data are fit to equivalent circuit models it can be a very useful tool to help formulate a hypothesis about the processes and mechanisms at work in a given electrochemical system. Often, an equivalent circuit model which fits the data will suggest some chemical model, process, or mechanism which can be proposed and tested. In order to provide insight into the behavior of the system being analyzed, the elements in the model should have a basis in the physical electrochemistry of the system.
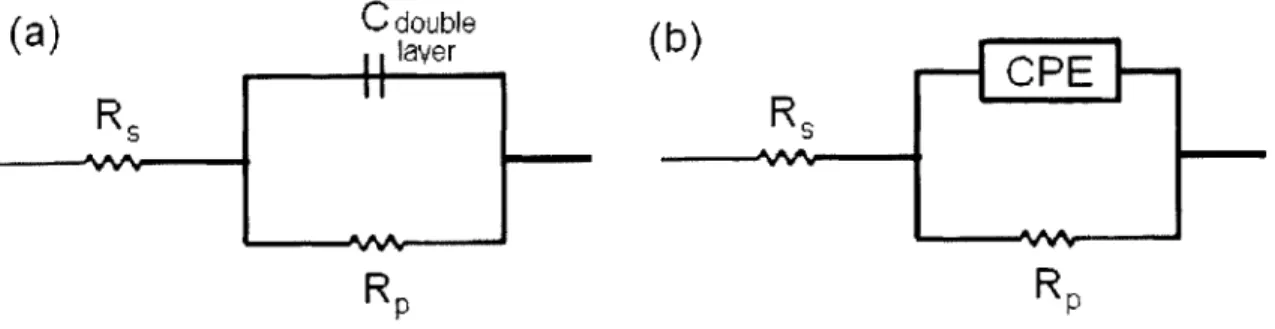
In Figure 2, for example, which shows the equivalent circuit for a simple electrochemical cell, Rs represents the resistance of the bulk solution, Rp represents the polarization resistance, which also represents the electrode's resistance to corrosion, and Cdoubli-layer represents the capacitance of the double
layer of charge induced by the accumulation of electrons on the electrode and the corresponding accumulation of ions in the solution in proximity to the
electrode.
C ouble
(b)
layerCPE
RS
RS
RID
RID
Figure 2: (a) The equivalent circuit of a simple electrochemical "Randles" cell, where Rs represents the solution's resistance, Cdouble layer. the double layer capacitance, and Rp the
polarization resistance. (b) The equivalent circuit of a simple electrochemical cell with a CPE
instead of a double-layer capacitance. This equivalent circuit is generally a more accurate description of electrochemical systems.
The impedance modulus Z of an electrochemical system as depicted in Figure
Z(jo) = R, I R (Eq. 1.4.6.1)
1+jO>CdRP
in which Rs, otherwise known as the solution resistance, represents the high-frequency limit of the impedance, and Rs + Rp represents the low-high-frequency limit of the impedance, where Rp is the resistance to a polarization, or corrosive, current, inversely proportional to the corrosive current density [46].
The resistance of an ionic solution depends on the ionic concentration, type of ions, temperature and the geometry of the area in which current is carried, and its theoretical value is given by:
sR, (Eq. 1.4.6.2)
Where Rs is resistance (in Ohms), / is the distance between the electrodes carrying a uniform current (in meters), o is the conductivity of the ionic solution (in S/m) and A is the area of the electrodes (in M2
) [45].
Whenever electrodes are forced away from their equilibrium potential, current may flow due to reactions on the surfaces of the electrodes or charge accumulation on the surfaces of the electrodes. The polarization resistance refers to the ease with which current is made to flow-the lower its value, generally, the higher the rate of corrosion [45].
A so-called electrical double layer exists at the interface between an electrode
and its surrounding electrolyte. It is formed in response to the positive or negative electric charge of the electrode as cations and anions accumulate, respectively, at the solution side of the charged electrode, and its thickness of is on the order of 0.3-0.5 nm [47]. The value of the double layer capacitance depends on many variables including electrode potential, temperature, ionic concentrations, types of ions, oxide layers, electrode roughness, impurity adsorption, etc. [45]. Due to non-homogeneities in electrochemical systems, a so-called "constant-phase element" (CPE) is used in a circuit model in lieu of a capacitor [45, 48]. An ideal capacitor is actually a constant phase element with a constant phase angle of 90 degrees, but a CPE may have any phase angle value.
The impedance Z of a capacitor can be expressed as:
Z- NY) (Eq. 1.4.6.3)
C
where j is the imaginary number, (o is the angular frequency in radians, C is the capacitance of the electrochemical cell in farads, and rj is an exponent expressing the degree of non-ideality of the CPE, and ranges in value from 0 to
1. For an ideal capacitor, i is equal to 1, but for constant phase element, the exponent 71 is less than one. The "double layer capacitor" on real cells often behaves like a CPE, not a capacitor [45], and this empirical factor may correspond, in the case of a corroding metal, to surface roughening [46], or other factors including non-uniformities of reaction rates, coating thicknesses, or current distributions [49].
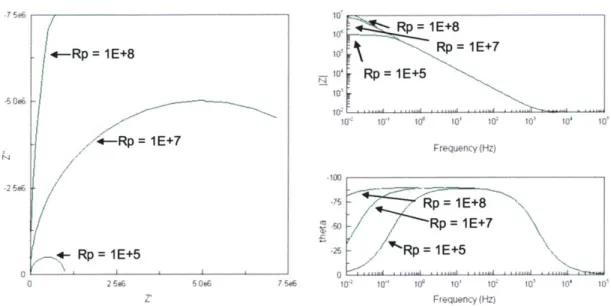
When examining EIS data, common practices include generating Nyquist and Bode plots, because the shapes of the curves facilitate insight into the mechanisms governing the behavior of the electrochemical system to the trained eye. In Figure 3, for example, we can see from the Nyquist plot of a theoretical electrochemical system that, all other parameters being equal, with decreasing Rp values, the Nyquist plot looks more and more "semi-circular." In a corresponding fashion, the Bode plots of the same system appear less and less like that of an ideal capacitor with decreasing Rp values.
In Figure 4, for example, we can see from the Nyquist plot of a theoretical electrochemical system that, all other parameters being equal, with increasing rl
values, the Nyquist plot looks more and more "semi-circular." In a corresponding fashion, the Bode plots of the same system appear less and less like that of an
-7 5e6 -N 25.6 IE+7 Rp = 1E+8 / -Rp: - Rp-=R1E+5 FT' 10 10 10 10' 105 10 100o .75 M5 j W, 10" 10' 10' 102 103 10' 107 Frequency (Hz) p= 1E+8 Rp = 1E+7 / Rp = E+5 7 5e6 10' 10' 1' 10 I' 10' 10' 10 Frequency (Hz)
Figure 3: Nyquist and Bode plots for circuit models of Randles cells of Rs = 1000, Cdl = pF,
n=1, and increasing values of Rp (and therefore corrosive reactions). As the value for Rs increases, the Nyquist plot looks less and less semi-circular, and the Bode plot looks less and less like that of an ideal capacitor.
n=0.8
nq=0.5 0 26OU WOW 75LXX 100000 to' 10 10 10 10-10 10 10' 10 10' 10' 10' 10' Frequerncy (Hz) -100 ,75 50 0 10 10 10' 1 10' 10' 10' Frequency (Hz)Figure 4: Nyquist and Bode plots for circuit models of Randles cells of Rs = 1000, Cdl = 1pF,
Rp=1 E+6 0 and increasing values of q. As the value for q increases, the Nyquist plot looks more and more semi-circular, and the Bode plot looks more and more like that of an ideal capacitor.
50e6 2 5e6 0 Rp = 1E+8 Rip = 1 E+7 Rp = 1E+5 rn=0.5 -,N *""8 - "N+fll 4'7 \\ /< 'Y'%%~,~~ 4 "
2. MATERIALS AND METHODS
Ever since Galen, the second century Greek physician believed to be the father of western experimental physiology, conducted his anatomical research on animals, extrapolating his results to humans and initiating many errors, the experimentation on animals has become an essential part of biomedical research, but with the caveat of whether results from animal studies can be extended to humans [50]. In terms of cardiac tissue engineering, the topic of cell source and animal model has been the topic of much discussion. In order to test prospective tissue-engineered devices, constructs must first be proven in animal models before receiving CE marking or FDA approval for a clinical trial. The choice of animal depends on the nature of the tissue-engineered construct being tested. Factors that need to be considered include technical requirements of implanting the construct, availability of the animal, cost and ethical considerations.
Rats have the advantages of being inexpensive, easy to handle and anaesthetise, and have a variety of strains including those with specific atherosclerotic risk factors like hypertension. However, when it comes to performing surgery their small size presents quite a technical challenge. Hence, compared to other fields of research, they are not as popular as animal models, especially for blood vessel research. However, as discussed above, the rat has proven very useful when studying cardiac muscle tissue engineering and for testing cardiac tissue grafts and as tools to assess the degree of vascularization of tissue-engineered constructs after implantation [50].
By working with neonatal rat cardiomyocytes, I will have the opportunity to build
upon previous results demonstrating that co-culturing of neonatal cardiomyocytes, fibroblasts and collagen within bioreactors can produce constructs that show promise for the repair of larger scar areas of the myocardium [50]. For certain preliminary tests, however, it may not be appropriate to use primary cells, and to use cells derived from immortal cell lines instead.
I chose C2C12 mouse myoblast cells as another model system due to their
evidence that they differentiate and express cardiac specific proteins when grafted into the rat or mouse myocardium [51-53]. They can be frozen for long periods of time, are immortal, and moreover, they are representative of hypoxia sensitive cells such as cardiomyocytes.
The methodology adopted for this project is therefore to:
(1) Prepare cells from either frozen cell stock or isolated from primary cell
sources
(2) Seed cells onto collagen scaffolds using Matrigel@
(3) Stimulate cells with electric field stimulation
(4) Perform assessments
An overview of the experimental setup is shown in Figure 5. Seeded scaffolds populated either by rat cardiomyocytes or C2C12 cells are stimulated within bioreactors, which are connected to a computer via an amplifier circuit. The stimulus may be modified by either modifying the geometry of the bioreactors, or
by modulating the stimulus as delivered by the computer software.
inside incubator
__igl00
Channel I Channel 2 Channel n
1. Computer running 2. Amplifier Circuit 3. Bioreactors
La bView
Figure 5: Overview of experimental setup. A computer running custom software generates the
pulse shapes which are then reproduced with more power by the amplifier circuit, and then connected via wires to the bioreactors located inside an incubator maintained at 37* C.