Thermal Energy Transport across the Interface between Phase
Change Material
n‑Heneicosane in Solid and Liquid Phases and
Few-Layer Graphene
Hari Krishna Chilukoti,
*
,†,§Tianhang Zhou,
†,§Vikram Reddy Ardham,
‡Michael C. Böhm,
†,∥and Florian Müller-Plathe
††Eduard-Zintl-Institut für Anorganische und Physikalische Chemie, Technische Universität Darmstadt, 64287 Darmstadt, Germany ‡Department of Biology, University of Fribourg, Chemin du Musée 10, 1700 Fribourg, Switzerland
*
S Supporting InformationABSTRACT: Molecular dynamics simulations have been performed to investigate the mechanism of thermal energy transport at the interface between n-heneicosane in solid and liquid phases and few-layer graphene at different temperatures under two heating modes (in the“heat-matrix” mode, heat is flowing from the heated heneicosane molecules to the cooled ones through the graphene layers and in the“heat-graphene” mode, the energy isflowing from the heated graphene to the cooled heneicosane). The effect of orientation of the perfect crystal structure (heneicosane molecules are positioned perpendicular and parallel to the graphene basal plane) on the interfacial thermal conductance has been examined. It is observed that the interfacial thermal conductance is 2 orders of magnitude higher under the heat-matrix mode than under
the heat-graphene mode, for liquid or solid heneicosane and monolayer graphene. With an increase in the number of graphene layers, the interfacial thermal conductance under the heat-matrix mode decreases and reaches a plateau when the number of the graphene layer is more than eight. This is caused by the decreasing contribution of direct heat transfer from the matrix to matrix across the graphene layers via nonbonded intermolecular interactions. The interfacial thermal conductance becomes similar for both heating modes, once the number of graphene layers in the system is over 15. The influence of temperature on the interfacial thermal conductance is found to be insignificant in the range (175−250 K; 350−400 K). Both the phase and structure of heneicosane significantly influence the interfacial conductance. Spectral analysis suggests that graphene vibrational modes of all frequencies contribute to the interfacial heat transfer.
1. INTRODUCTION
Solid−liquid phase change materials (PCMs) are commonly utilized for storage of solar energy which is intermittent in nature, passive cooling of electric devices,1 and waste heat recovery systems.2Latent heat thermal energy storage units are a very attractive choice among the thermal energy storage techniques because of their high energy density and isothermal operation.3−5 Organic PCMs are desirable because of their stability, insignificant supercooling, and low cost.6
It is preferable, though, for PCMs to have high thermal conductivity in both solid and liquid states because the rate of energy storage and discharge is directly proportional to the thermal conductivity of the PCMs. However, organic PCMs are notoriously poor heat conductors.5 Hence, intense efforts have been made to improve the thermal conductivity of PCMs. Over the past few years, different materials with high thermal conductivity have been used asfillers to improve the thermal conductivity of a base material in either liquid or solid phases. Among these materials, carbon-based nano-additives, for
example, graphene and carbon nanotubes have a superior performance in improving the overall thermal conductivity.7−10 The enhancement in thermal conductivity is influenced by many parameters, for example, the thermal conductivity of the fillers and the matrix, the weight percentage of the fillers, their distribution and alignment, the thermal conductance at the filler−matrix interface, and so forth.9,11−13
Among these parameters, the interfacial thermal conductance is considered to play an important role in dictating the overall thermal conductivity of carbon-based nanocomposites, and it is also an important input parameter in the effective medium theory.14 The heat transfer across the interfaces at the molecular level is difficult to study via experiments. Molecular dynamics (MD) simulations can be used to obtain the value of the interfacial thermal conductance and also to provide an insight into the
http://doc.rero.ch
Published in "The Journal of Physical Chemistry C 123(48): 29192–29202, 2019"
which should be cited to refer to this work.
molecular mechanisms of thermal energy transfer across the interfaces.15−20
A comprehensive review on thermal conductivity enhance-ment of PCMs by dispersing highly conductive metal and metal oxide nanoparticles and carbon allotropes is given by Fan and Khodadadi et al.21 Early MD work has investigated the interfacial thermal conductance between graphene and simple molecular liquids.22,23 Lately, the thermal energy transfer between liquid polymers and graphene has been studied by a few researchers. For example, Liu et al.23evaluated the interfacial thermal conductance between graphene and liquid octane and examined the influence of two modes of heat transfer (in thefirst mode, heat enters from matrix into the graphene from one side and immediately leaves it through the other side back into the matrix and in the second mode, heat goes into or leaves the graphene simultaneously from both side of its basal plane from or to the matrix) on its magnitude. Furthermore, it has been suggested that the magnitude of the interfacial thermal conductance depends on the analysis method.24 Recently, Rastgarkafshgarkolaei et al.25 examined the influence of interfacial thermal conductance on the thermal conductivity of ideal crystals of different alkanes (C20H42,
C24H50, C26H54, C30H62). Babaei et al.
26
suggested that the improvement in thermal conductivity of solid paraffin filled with high aspect-ratio carbon-based nano-fillers is primarily due to the enhancement in thermal conductivity of the matrix itself and to the ordering of molecules in the vicinity of graphene. To investigate the mechanism of thermal energy transfer across solid, liquid, and gas interfaces, Giri et al.27have systematically examined the systems composed of simple Lennard-Jones (LJ) particles. However, it is not clear, how the interfacial thermal transport at the interface will change, if the phase of the alkane is changed from liquid to solid. More studies are needed to understand the mechanism of thermal energy transfer over the interfaces between an alkane matrix and nanoinclusions during the phase change of nanoparticle-based organic composites to improve its overall thermal performance.
In this work, we investigated the heat transfer at the interface between heneicosane (C21H44), both solid and liquid and
graphene by performing nonequilibrium MD (NEMD) simulations. The effect of the number of graphene layers and the orientation of the alkane molecules in the solid state with respect to the graphene layer as well as different modes of heating on interfacial thermal conductance has been examined. Vibrational density-of-states (VDOS) and spectral analysis of the interfacial heat flux are examined to understand which vibrational modes are important to transfer the thermal energy across the interface when the phase and structure of alkane is changed.
2. MOLECULAR MODEL AND MOLECULAR SIMULATION DETAILS
The computational systems as shown in Figure 1have been created. Because of its frequent use as PCM (melting point 313.55 K28), heneicosane (C21H44) is selected as n-alkane. The
past study suggests that the united atom model for alkane performs superior to the all-atom model for the investigation of thermal transport properties.29It has been suggested that this is possibly because the united atom models do not consider high-frequency degrees of freedom (C−H vibrations) in simulations, which are quantum-mechanical oscillators in nature in their ground state and do not contribute to heat
conduction.29 A united atom model is used to describe heneicosane molecules. In this model, CH3and CH2 groups
are treated as single interactions sites. The NERD potential is used for the description of molecular interaction between heneicosane atoms.30 The intramolecular interactions consist of bond stretching, bond bending, and torsional motion. The potential parameters are summarized in Table S1 (Supporting Information).30The intermolecular interaction between united atoms is treated using the LJ potential
ε σ σ = − c e ddd ddd ddddLNMMM \ ^ ]]] LNMMM \^]]] f h ggg ggg gggg V r( ) 4 r r 12 6 (1)
where r is the distance between two united atoms. The size parameters for CH2and CH3groups areσCH2= 0.393 nm and
σCH3= 0.391 nm, respectively. The energy parameters for CH2
and CH3 groups areεCH2/kB= 45.8 K andεCH3/kB = 104 K,
respectively. An all-atom model is used to describe graphene. The optimized Tersoff potential31 is used for intralayer interactions (Table S2, Supporting Information). The interlayer interaction in multilayer graphene is treated using the LJ potential. The size and energy parameters for carbon atoms areσC= 0.383 nm andεC/kB= 27.7 K.32The Lorentz−
Berthelot mixing rules are applied to obtain the LJ parameters between unlike atoms.
ε = εε andσ = σ +σ
2
ij i j ij
ii jj
(2)
In order to investigate the effect of the solid structure of heneicosane on the interfacial thermal conductance, we have created three types of systems which are named as “perpendicular-aligned system”, “parallel-aligned system”, and “disordered-solid system”. In the perpendicular-aligned sys-tems, all heneicosane molecules are aligned in the direction perpendicular to the graphene basal plane as shown inFigure 1a. In the parallel-aligned systems, heneicosane molecules are aligned in the direction parallel to the graphene basal plane as depicted in Figure 1b. A previous study has used an ideal-crystal model, where all the alkane molecules are aligned in one direction, to study thermal transport in solid n-alkanes.25It is
Figure 1.Schematics of the monolayer graphene−heneicosane system when heneicosane phase and its structure is different (a) perpendicular-aligned crystal system, (b) parallel-aligned crystal system, (c) liquid system, and (d) disordered solid system. The yellow and blue beads correspond to the CH3and CH2united atoms
of a heneicosane molecule, respectively. The graphene layer is shown in cyan color.
experimentally known that the heneicosane molecules pack themselves in an orthorhombic crystal system. Perfect heneicosane crystals in the perpendicular-aligned and paral-lel-aligned systems are created with the lattice parameters reported for heneicosane crystals from X-ray diffraction by Jouti et al.33 Each graphene layer in the parallel-aligned systems has a cross section of Lx× Ly= 5.27× 5.62 nm2and
contains 1092 carbon atoms. For perpendicular-aligned systems, a cross section of Lx × Ly = 5.22 × 5.87 nm2 is
used for each graphene layer and contains 1176 carbon atoms. The cross sections of disordered solid and liquid systems were in the range of 5.19−5.31 nm along x-direction and 5.58−5.90 nm along the y-direction depending on the temperature and the initial dimensions of the parent system, from which they were constructed. The lengths of the perfect crystal systems along the x- and y-directions are considered in such a way that the lattice mismatch between graphene and perfect crystal is minimum. The lengths of the monolayer graphene systems in z direction were in the range of 15.1−22.1 nm depending on the system temperature, phase, and structure of heneicosane. In multilayer graphene systems, graphene sheets were AB-stacked at a distance of 0.335 nm apart from each other along the z-axis. All simulations were performed using the LAMMPS package.34 A cut-off radius of 1.4 nm was used for the LJ potential. For equilibration, a time step of 1 fs was used in all the simulations. Periodic boundary conditions were applied in all three directions.
To investigate the thermal energy transfer across the graphene−heneicosane interfaces, computational systems that consist of desired numbers of graphene layers sandwiched between two heneicosanefilms in the desired state have been created as shown in Figure 1. Initial configurations of the crystal systems were constructed by positioning the heneico-sane molecules in an orthorhombic crystal with lattice parameters given in Jouti et al.33After that, the systems were first simulated in the NPT ensemble for 2 ns with the Nosé− Hoover thermostat and barostat with coupling times of 1.0 and 5.0 ps, respectively. It has been verified that the pressure components along normal (z) and lateral directions (x and y) are close to same value in the bulk region of the system (see
Supporting Information). It is worth mentioning that the pressure value given in the manuscript is the arithmetic mean of the main pressure components in the bulk region away from the grapheneP= P +P +P
3
xx yy zz
. Similar type systems have been used to investigate heat and mass transport characteristics in the solid−liquid interface regions.15,16,18,35,36NVE simulations were followed for 2 ns to equilibrate the systems. To simulate the systems at different temperatures, the equilibrated systems were cooled/heated at a rate of 10 K/ns in the NPT ensemble. After reaching the target temperature, the systems were simulated in the NPT ensemble for 2 ns and subsequently in the NVE ensemble for 2 ns. To construct graphene−liquid heneicosane systems, the two crystal systems equilibrated at 250 K and 1 atm were gradually heated to the target temperatures (350, 375, 400 K) with a rate of 10 K/ns. After that the systems were simulated in the NPT ensemble for 2 ns and later in the NVE ensemble for 2 ns for equilibration. A snapshot of the monolayer graphene−liquid heneicosane system is shown in Figure 1c. For the liquid state of heneicosane, the systems are simulated at 350, 375, and 400 K and 1 atm. The graphene−disordered solid heneicosane systems were obtained by cooling the liquid system from 400
K and 1 atm, which was obtained from heating the parallel-aligned system, to the target temperature (225, 200 and 175 K) and pressure (1 atm) in the NPT ensemble with a rate of 2 K/ns. After attaining the target temperature, the system was simulated in the NVT ensemble in the range of 15−20 ns. Then, a simulation of 2 ns in the NVE ensemble has been performed for equilibration. A schematic representation of a disordered solid heneicosane−graphene system is depicted in
Figure 1d. It is to note that the disordered structure of the heneicosane in these systems is not reproducible and will depend on the cooling rate and the starting equilibrium configuration used for the construction of the system. We have, therefore, created three disordered systems from different equilibrium configurations, and the thermal conductance values obtained from each system have been averaged to obtain the value at the target temperature.
In order to determine the interfacial thermal conductance at the interface, steady-state NEMD simulations have been performed on the equilibrium systems. Previous studies have suggested that two modes of heat transfer occur in graphene-based nanocomposites as shown in Figure 2.23 In the first
mode, heat enters graphene layers from one side of its basal plane and leaves through the other side. In the second mode, heat enters or leaves graphene simultaneously and symmetri-cally from both sides of its basal plane. Therefore, the NEMD simulations were performed in two ways. To examine thefirst mode, a constant amount of energy per time is injected into the source region, which is located in the heneicosane matrix at one end of the computational system and an equal amount of energy per time is extracted from the sink region that is situated in the matrix at the other end of the system (Figure S1 inSupporting Information). From here onwards, the NEMD simulations performed in this manner are named as “heat-matrix mode”. Thus, a constant heat flux was introduced in the system along z-direction. To investigate the second mode of heat transfer, a constant amount of energy per time, is injected into the central graphene layer and half of that amount is removed from each of two heneicosane regions, which are located at the two ends of the system. This case is henceforth denoted as “heat-graphene mode”. The widths of the source and sink regions in the matrix are taken as 5 Å. Furthermore, the atoms of heneicosane molecules in two regions with a width of 7 Å on the left and right end of the system that is beyond the heat source and sink regions are frozen as shown Figure S1 inSupporting Information. This step ensured that all heat had to flow through the graphene. As an additional measure, the simulation box has been extended by 10 nm of
Figure 2. Schematic representation of two different modes of interfacial thermal transport in graphene-based nanocomposites that is, heat-matrix mode and heat-graphene mode. The red arrows indicates the direction of heat transfer.
vacuum in the z direction, effectively isolating periodic images of the system from each of them. We have also verified that the width of the heat source region in graphene layers has nominal effect on the obtained thermal conductance values (see
Supporting Information). A thermal gradient in the NEMD simulations is imposed by maintaining a source region at T +
ΔT
2 and sink region at T − ΔT
2 , where T is the equilibrium
temperature of the system. In all heat-matrix simulations, aΔT of 50 K is used and aΔT of 25 K is used in heat-graphene simulations. Because of the simulation setup the center of the system in NEMD simulations is extremely close to the target temperature under the matrix mode. Under the heat-graphene mode, the heat-graphene temperature is maintained at the target temperature and two heat sink regions are maintained at T + ΔT. In few-layer graphene systems, heat was always injected into the middle graphene layer under the heat-graphene mode. It should be noted that we have only constructed systems with odd number of graphene layers for studying the effect of number of graphene layers on thermal conductance under the heat-graphene mode. The systems are simulated at a constant energy and volume (NVE). The heat source and heat sink regions are maintained at the target temperature by means of velocity rescaling. A time step of 0.2 fs is used in the NEMD simulations. NEMD simulations were first performed for 6 ns to ensure that a constant heat flux was generated and a steady-state temperature profile was established in all the systems. After that, the data were collected for 18 ns to evaluate the interfacial thermal conductance. The data collection run was divided into three blocks and from each of which an interfacial thermal conductance value was calculated. These values were used to calculate the standard deviation, which is taken as the error bar. The temperature distribution in the computational system was computed along the z-direction in slabs of 0.05 nm thickness to obtain the temperature jump at the interface for the evaluation of the interfacial thermal conductance. Note that in the NEMD simulations the total energy of the system is conserved because the amount of thermal energy added in the heat source region was identical to the amount of thermal energy removed in the heat sink region. In order to ascertain that the selection of the thermostat used in the nonequilibrium simulations have negligible influence on the value of interfacial thermal conductance, we have also performed simulations with the Berendsen and the Langevin thermostats. The interfacial conductance results obtained from simulations with different thermostat are identical within error bars. This indicates that the value of the interfacial thermal conductance is independent of the type of thermostat used.
3. SPECTRAL ANALYSIS OF INTERFACIAL THERMAL ENERGY TRANSFER
In order to understand the mechanisms involved in the heat transfer at the interfaces between heneicosane and graphene, two types of spectral analysis were performed. Thefirst spectral analysis of interfacial heat transfer is the calculation of the VDOS D(ω) as
∫
∑
ω = τ ⟨ τ · ⟩ −∞ +∞ ωτ D k T m d v v ( ) 1 e ( ) (0) i i i i i B (3)where mi and vi are the mass and velocity of atom i,
respectively. τ is time and ω is the frequency. Fourier transform of atomic velocity autocorrelation function is
proportional to the VDOS.37 The modulus of D(ω) is investigated below. The spikes in the VDOS were smoothed out by applying a Gaussian convolution with a width of 1.6 Å. For the analysis of heat transfer results, the VDOS of atoms in the graphene layer that is in contact with heneicosane molecules and the VDOS of heneicosane united atoms in thefirst adsorption layer (which can be identified as the first peak in the atomic density profile) next to the graphene was utilized (Figure S2 in Supporting Information). For the calculation of two vibrational spectra, the velocities of the selected heneicosane and graphene atoms were collected every 20 time steps for 0.8 ps time blocks after the system had reached equilibrium in the NVE ensemble. The VDOS were averaged over the production run (1 ns).
The second spectral analysis is the resolution of the interfacial heat flux in the spectral domain, which has been evaluated as38 5
∑
∫
ω = τ ⟨ τ · ⟩ ∈ ∈ −∞ +∞ ωτ q A d F v ( ) 2 e ( ) (0) j h i g i ij i , (4)where5represents the real part of the Fourier transform of the force−velocity cross-correlation function ⟨Fij(τ)·vi(0)⟩, Fij is
the total force acting on a carbon atom i in the graphene (g) due to the all atoms of heneicosane (h) in thefirst adsorption layer, vi is the velocity vector of the carbon atom i in the
graphene, and A is the area of the interface. The data were saved every 20 time steps for 0.8 ps and averaged over the last 6 ns of the nonequilibrium simulation run to calculate q(ω).
4. RESULTS AND DISCUSSION
4.1. Interfacial Thermal Conductance. Heat transfer across the interface between two dissimilar materials is characterized by the interfacial thermal conductance G
= Δ
G q
T (5)
where q is the magnitude of the heat flux [(heat)-(time)−1(cross sectional area)−1] across the interface and ΔT is the temperature jump at the interface. To obtain the temperature jump at the interface, the steady-state temperature distribution along the heat flux direction (z) was computed during the production run of the NEMD simulations for the evaluation of the interfacial thermal conductance. As an illustrative example,Figure 3shows the temperature profile in the liquid heneicosane−monolayer graphene system at 400 K and 1 atm under the heat-graphene mode and heat-matrix mode. The position of the interface is defined as the midpoint between the average position of atoms of the top graphene layer and the position of thefirst peak in the density profile of heneicosane united atoms. To calculate the temperature of heneicosane at the interface, the temperature profile of heneicosane atoms is obtained in slabs of 0.05 nm thickness. This it is thenfitted to a straight line, which is extrapolated to the interface position. Similarly, the graphene temperature at the interface is obtained in systems with more than two graphene layers. For the monolayer graphene system, the temperature of the single sheet is used as is to calculate the temperature jump (Figure 3). Note that in the nonequilibrium simulation, the average temperature in the system is equal to the equilibrium temperature. As expected, the temperature is higher in the source region and decreases toward the sink region and a temperature jump is evident at the interface which
is due to the resistance to the heat transfer. Note that the graphene might be at different temperatures for the two heating modes. Below we show that the effect of the temperature on the interfacial thermal conductance is marginal. This indicates that the different temperatures of graphene in the heat-matrix mode and heat-graphene mode are not the primary reason for the large difference in the magnitude of interfacial thermal conductance between these two heating modes.
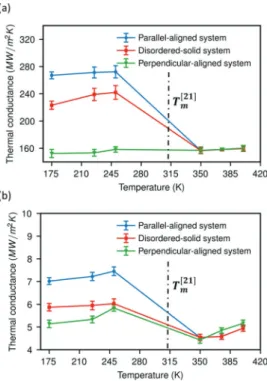
4.2. Interfacial Thermal Conductance as a Function of Temperature, Phase and Structure of the Matrix. The interfacial thermal conductance at the interface between monolayer graphene and heneicosane in the liquid and in all solid phases (perfect crystal and disordered solid state) have been calculated at different temperatures under the heat-matrix mode as well as heat-graphene mode (Figure 4). It is first observed that the thermal conductance calculated under the heat-matrix mode is 2 orders of magnitude larger than for the heat-graphene mode irrespective of the phase and structure of heneicosane. Some past studies also investigated the mode of heating effect on the thermal conductance at the graphene− liquid octane and graphene−polymer interfaces.23,24 The trends of our results are in agreement with the past studies. This effect will be addressed separately below. Second, within each phase, solid or liquid, there is a tendency for the thermal conductance to increase with an increase in temperature for both heating modes. However, the tendency is more noticeable under the graphene mode in comparison to the heat-matrix mode. It should be noted that the cross-section sizes of all systems are already large enough that it has negligible effect on the values of interfacial thermal conductance (Figure S3 in
Supporting Information). Similar tendencies have been
reported for solid−liquid systems.23 Third, among the interfaces of graphene with the solid heneicosane phases, the ranking is parallel-aligned crystalline > disordered > perpendicular-aligned. In the heat matrix-mode, the latter is ever so low that it connects smoothly to the conductance of the graphene−liquid interface. The conductance depends much more on the heneicosane phase than the temperature (Figure 4). An improvement of about 73.9% in the interfacial thermal conductance is observed for the parallel-aligned crystal system at 250 K in comparison to the liquid system at 350 K. On the other hand, for the disordered solid system, an improvement of only about 53.2% is noticed as compared with the liquid system. The ordering of the different solid phases is explained by the molecular structure of the interface (Figures 1, S2 inSupporting Information). The highest conductance is found for the parallel-aligned crystalline phase. In this orientation, the heneicosane brings a maximum number of atoms in close contact with the graphene (Figure 1b). In contrast, the lowest number of contact is seen for the end-on orientation (Figure 1a). The disordered phase (Figure 1d) falls in between. This is explained by the nature of this phase: it is not a supercooled liquid or glass but, rather, crystalline with small domains. This allows enough heneicosane, to be packed edge-on against the graphene to ensure a higher conductance than either the end-on crystal or the liquid.
4.3. Molecular Mechanism of Interfacial Heat Trans-fer. To better understand the mechanism of heat transfer at the interface between graphene and heneicosane vibrational spectral analysis has been performed. The VDOS profiles for graphene and the heneicosane molecules in thefirst adsorption layer in the monolayer graphene−liquid heneicosane system are shown inFigure 5. It is observed that a large percentage of graphene vibrations occupy the middle- (15−40 THz) and
Figure 3.Temperature profiles along the direction of heat transfer (z) in the monolayer graphene−liquid heneicosane system at 400 K and 1 atm under (a) heat-matrix mode and (b) heat-graphene mode. The vertical dash-dotted lines represent the interface between monolayer graphene and heneicosane. ΔTH‑M/2 and ΔTH‑G are temperature jumps at the interface in systems under the heat-matrix mode and heat-graphene mode, respectively.
Figure 4.Thermal conductance of the interface between heneicosane in solid and liquid phases and a monolayer graphene as a function of temperature under (a) heat-matrix mode and (b) heat-graphene mode. The melting point (Tm) of heneicosane obtained from
experiments is 313.55 K,28which is shown as a vertical dash-dotted line.
high-frequency ranges (>40 THz). In contrast, the majority of the heneicosane vibrations fall into the low- and middle-frequency range. The overlap area between the VDOS of two dissimilar materials has been used to qualitatively indicate which vibrational modes are important for heat transfer at the interface.39−42The overlap area (green shaded area) between the VDOS of graphene and heneicosane occurs mainly in the low- and middle-frequency range. This suggests that the transfer of thermal energy at the interface is primarily via the coupling between low-frequency vibrational modes of graphene and heneicosane, which is in agreement with previous studies.23,24 Note that the vibrational spectra of heneicosane in the crystal and disordered solid exhibit similar tendencies and also have the same range (Figure S4a−c in
Supporting Information). Under the heat-graphene mode, the heat is injected into the graphene, and the energy is added to the all vibrational modes at the same time. As shown inFigure 5, the density of high- and medium-frequency vibrations in graphene is substantially higher than low-frequency vibrations. Furthermore, the in-plane (xy) VDOS of graphene occupies mostly high-frequency vibrational modes (longitudinal acoustic and transverse acoustic modes) (Figure S4d in Supporting Information). The low-frequency region is dominated by out-of-plane vibrational modes (out-out-of-plane acoustic modes). The middle-frequency region consists of out-of-plane and in-plane vibrational modes (Figure S4d in Supporting Information). Therefore, the majority of the injected heat must be distributed into the middle- and high-frequency vibrational modes in graphene under the heat-graphene mode. Previous studies23,24 have suggested that the energy stored in middle- and high-frequency vibrations of graphene mustfirst be transferred into lower-frequency vibrations before it can be transported to the heneicosane molecules under the heat-graphene mode. This “internal” heat transfer within the graphene layer in the heat-graphene mode is thought to be responsible for the low conductance of the interface compared with the heat-matrix mode.
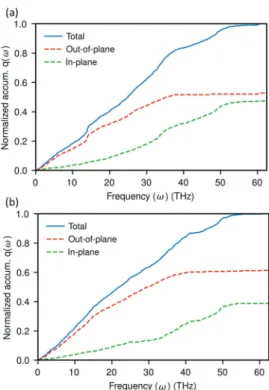
To gain a deeper insight into which frequency vibrations are important for the interfacial heat transfer, the spectral heatflux q(ω) is evaluated fromeq 4. The spectral heatflux q(ω) was normalized with respect to the maximum value of q(ω) and a cumulative of q(ω) against frequency is examined in order to get a clearer picture of which frequency-ranges make dominant contribution to heat transfer.Figure 6a,b show that the out-of-plane vibration modes contribute more to the total heat transfer through the interface than the in-plane modes in the
parallel-aligned system for both heating modes (calculation procedure is given inSupporting Information). The advantage of the out-of-plane cumulative q(ω) under the heat-graphene mode (Figure 6b), in particular in the middle- and high-frequency range, is much higher than under the heat-matrix mode (Figure 6a). This means that the in-plane vibrational modes contribute less to the total heat flux under the heat-graphene mode than under heat-matrix mode. The lower contribution suggests that energy added into the high frequency in-plane modes is less efficiently transferred to the heneicosane andfirst must be internally converted into other (slow and out-of-plane) modes. Furthermore, as discussed above, there is no overlap between the VDOS of graphene and heneicosane above the maximum frequency of heneicosane ωmax,H. However, it is obvious from cumulative q(ω) that
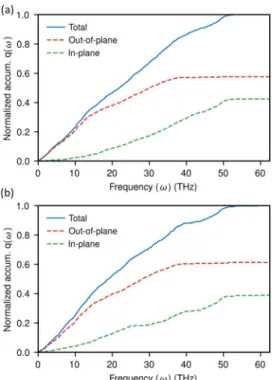
high-frequency vibrations still contribute to the interfacial heat transfer. This indicates that other channels, namely, surface modes, could facilitate the transfer of heat at the interface.35,38 The magnitude of interfacial thermal conductance of the disordered solid system is comparatively close to the parallel-aligned system under the heat-matrix mode. This can be attributed to the similar characteristics exhibited by the disordered solid system (Figure 7) of directional decom-position of normalized cumulative q(ω) with the parallel-aligned system (Figure 6). In contrast, the perpendicular-aligned system and liquid systems exhibit lower magnitude of thermal conductance under the heat-matrix mode, which can be seen to be related to the large gap between out-of-plane and in-plane modes of cumulative q(ω) (Figures 8and9).
In total, we observed that out-of-plane vibrational modes make larger contribution [up to 60% (Figures 6b and 9b)] than the in-plane vibrational modes to the total heat transfer at the interfaces for all the systems under both heat transfer
Figure 5.VDOS of graphene and heneicosane molecules in thefirst adsorption layer in the monolayer graphene−liquid heneicosane system at 350 K and 1 atm.
Figure 6.Directional decomposition of the normalized cumulative spectral heat flux at the interface between graphene and parallel-aligned heneicosane crystal when the system is under (a) heat-matrix mode and (b) heat-graphene mode. Here, q(ω) is calculated from graphene to heneicosane.
modes. In the low- and middle-frequency range, heat is primary transported [up to 77% (Figure 8a)] by the out-of-plane vibrations in all the systems studied. Moreover, the increased gap in contribution between in-plane vibration and
out-of-plane vibrations to the total heatflux is caused by the resistance to “internal” heat transfer between the vibrational modes in the graphene layer that is heated and poor coupling between vibrational modes of graphene and heneicosane.
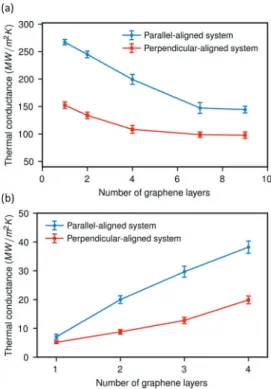
4.4. Effect of Number of Graphene Layers on the Interfacial Thermal Conductance. Evidence for Direct Matrix-to-Matrix Heat Transport. The interfacial thermal conductance between heneicosane ideal crystals in two orientations and graphene as a function of the number of graphene layers was evaluated at 250 K and 1 atm under heat-graphene and heat-matrix modes (Figure 10). Under the heat-graphene mode, the thermal conductance obtained from a system is named inFigures 10b and11as follows: number of layers on x-axis is equal to the number of the graphene layer on one side of the central graphene layer plus heated graphene layers. For example, thermal conductance for four number of graphene layers in Figures 10b and 11 is obtained from a system with seven graphene layer under the heat-graphene mode. For both crystal orientations, the interfacial thermal conductance decreases, as the number of graphene layers increases. Under the heat-matrix mode, it reaches a plateau after seven layers. In contrast, the thermal conductance of both crystal systems increases gradually with the number of graphene layers (until 4 layers) under the heat-graphene mode. The thermal conductances of both modes converge with an increasing number of graphene layers (Figure 11). They reach similar values (about 100 MW/m2K) when the number
of graphene layers is above 15. To save computer time, we have used smaller systems with an interfacial cross-section of Lx× Ly= 34.1× 33.7 nm2to simulate the liquid heneicosane
system with larger numbers of graphene layers (>10). As explained previously, the cross-section has a negligible
Figure 7.Directional decomposition of the normalized cumulative spectral heatflux at the interface between graphene and disordered solid heneicosane when the system is under (a) heat-matrix mode and (b) heat-graphene mode. Here, q(ω) is calculated from graphene to heneicosane.
Figure 8.Directional decomposition of the normalized cumulative spectral heat flux at the interface between graphene and perpendicular-aligned heneicosane crystal when the system is under (a) heat-matrix mode and (b) heat-graphene mode. Here, q(ω) is calculated from graphene to heneicosane.
Figure 9.Directional decomposition of the normalized cumulative spectral heat flux at the interface between graphene and liquid heneicosane when the system is under (a) heat-matrix mode and (b) heat-graphene mode. Here, q(ω) is calculated from graphene to heneicosane.
influence on the calculated value of the interfacial thermal conductance (Figure S3 inSupporting Information).
In our molecular model, graphene interacts with heneico-sane via LJ potential. This means that heat is transferred between heneicosane and graphene by means of nonbonded LJ interactions as well. It can be hypothesized that under the heat-matrix mode, for example, in a monolayer−graphene system, heatflows from heneicosane of one side to the heneicosane on the other side using two pathways. In thefirst, heat flows into the graphene layer from the matrix and then leaves the graphene to the opposite matrix. In the second, the heat can directly transfer from matrix to matrix withoutfirst entering the graphene layer between heneicosane molecules on both sides because the distance between heneicosane molecules separated by the graphene layer is below the LJ cut-off radius. Increasing the number of carbon layers increases the distance between these heneicosane molecules. Therefore, the contribution of the direct pathway should be reduced and eventually be zero.
Under this assumption, the reduction of matrix-to-matrix heat transfer would be the reason for the decreasing trend of the thermal conductance with increasing number of graphene layers under the heat-matrix mode. To test this hypothesis and to quantify the direct matrix-to-matrix energy transfer in a monolayer graphene−heneicosane system, we have modified a heat-matrix simulation by rigidlyfixing the graphene atoms at their positions. Thus, the graphene does not participate in the dynamics and all heat transfer must take place via the direct matrix-to-matrix pathway. As expected, a temperature jump is noticed at the interface. The interfacial thermal conductance calculated in this way is 51.4 MW/m2 K. This value is very close to the difference in conductance of a very thin graphene (1 layer,∼160 MW/m2) and the converged value for many layers (∼100 MW/m2), where a direct matrix-to-matrix
transfer is impossible and heat is intermediately stored in graphene before passing to the opposite side (cf.Figure 11).
Furthermore, the VDOS analysis can also be used to qualitatively explain the lower interfacial thermal conductance of multilayer graphene systems under the heat-matrix mode (Figure 12). With an increase in the number of graphene
layers, the in-plane VDOS of graphene at high-frequency range increases, while the low- and middle-frequency out-of-plane VDOS of graphene is reduced. This reduces the thermal coupling between low frequency vibrations of the matrix and out-of-plane vibrations of graphene which leads to lower thermal energy transfer across the interface. Similar observa-tions have been reported by Namsani and Singh39 for graphene−liquid gold systems.
Previous studies have suggested that when the graphene is heated, the internal thermal resistance to transfer of energy between high-frequency vibrations to low-frequency vibrations causes the lower thermal conductance at the interface.23,24 This explanation is plausible but not yet proven quantitatively.
Figure 10. Interfacial thermal conductance between graphene and two alignments of heneicosane crystals as a function of the number of graphene layers for (a) heat-matrix mode and (b) heat-graphene mode.
Figure 11.Variation of the interfacial thermal conductance between liquid heneicosane and graphene interface with the number of graphene layers under the heat-matrix mode and heat-graphene mode.
Figure 12.In-plane and out-of-plane VDOS D(ω) of a graphene in arbitrary units for the interface between one- and four-layer graphene and heneicosane when it is in (a) parallel-aligned perfect crystal and (b) perpendicular-aligned perfect crystal.
In an attempt to evaluate the internal heat transfer contribution to the interfacial heat transfer, we have injected heat only into out-of-plane vibrations by scaling only the z-component of the atomic velocities in the monolayer graphene−liquid heneicosane system. However, the calculated interfacial thermal conductance (10 MW/m2K) is fairly close to the value for the cases where the heat is indiscriminately injected into all vibrations. The probable reason for this behavior is that although the heat is only added into the out-of-plane modes of graphene, it will quickly thermalize into the other directions too.
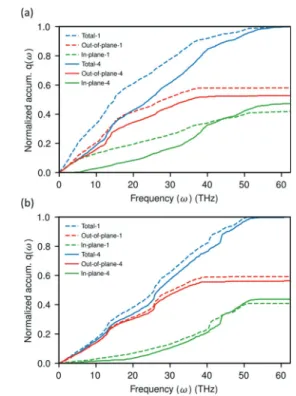
To further investigate the change of the characteristics of interfacial heat transfer as the number of graphene layers increases under the heat-graphene mode, spectral mapping of the interfacial heatflux has been performed. Figure 13shows
the normalized cumulative q(ω) that is decomposed into in-plane and out-of-in-plane directions for interfaces between heneicosane crystals (perpendicular-aligned and parallel-aligned) and graphene (monolayer, four-layer) under the heat-graphene mode. The gap between the out-of-plane and in-plane vibrational mode contribution to the cumulative q(ω) in the four-layer system (solid lines) is lower than that in the monolayer system (dashed lines) for both types of heneicosane crystals. This indicates that the energy is less unfavorably transferred by in-plane vibrational modes as the number of graphene layers increases in the system under the heat-graphene mode. Furthermore, the characteristics of cumulative q(ω) for the four-layer system under the heat-graphene mode (Figure 13a,b) are found to be similar to the monolayer systems under the heat-matrix mode for both crystal structures (Figures 6a and8a). This suggests that the interfacial thermal energy transfer in a system with several graphene layers under
the heat-graphene mode tends to occur via similar channels as in a monolayer system under the heat-matrix mode. This is believed to be the reason for the reduction of the difference between the interfacial thermal conductances under the two heating modes, as the number of the graphene layer in the system increases (Figure 11). As a result, the thermal conductance under the heat-graphene mode approaches that of the heat-matrix mode as the number of graphene layers grows. Moreover, in the four-layer system, low-frequency in-plane vibrational modes contribute less to the total heat transfer compared with the monolayer system for both types of heneicosane crystals. Conversely, high-frequency in-plane modes in the four-layer system tend to transfer more heat than in the monolayer system. This observation indicates that the“internal” heat transfer process that is believed to be rate-limiting in the monolayer system under the heat-graphene mode becomes less problematic when there are more graphene layers. Finally, the interfacial thermal conductance in a parallel-aligned system increases more rapidly in comparison with a perpendicular-aligned system with an increase in the number of graphene layers (Figure 10b). This can be attributed to the larger contribution of in-plane vibrations to the total heat transfer in parallel-aligned crystals (Figure 13).
5. CONCLUSIONS
Thermal energy transfer across the interface between graphene and heneicosane in solid and liquid states has been investigated by performing series of NEMD simulations. We have evaluated the interfacial thermal conductance. The effect of the heneicosane structure in the solid state (for perfect crystal systems, heneicosane molecules are positioned perpendicular and parallel to the graphene basal plane. In disordered solid systems, the heneicosane molecules are packed in small domains without a particular ordering), heat transfer modes (heat-matrix mode and heat-graphene mode), temperature, and the number of graphene layers on the interfacial thermal conductance has been examined.
The interfacial thermal conductance is found to be strongly influenced by the phase and the structure of heneicosane and weakly effected by the temperature. Past studies suggest that the thermal energy is primary transferred by coupling between low-frequency out-of-plane graphene vibrations and soft matrix.17,18 Contrary to this, it is found that a considerable portion of the thermal energy (up to 40%) is transferred via high-frequency vibrational modes. Furthermore, we have also illustrated that the interfacial thermal conductance reaches a similar value under both heating modes when the number of graphene layers in the system is over 15. This supports the hypothesis proposed by Hu et al.24
It should be noted that the value of the interfacial thermal conductance calculated under the heat-matrix mode, that is 2 orders of magnitude higher than the value under the heat graphene-mode, is to be used in the effective medium theory calculations for determining the effective thermal conductivity of the graphene-based alkane nanocomposites.23,43Moreover, we believe that the heat transfer analysis under the heat-graphene mode is relevant in the development of thermal therapy methods.44
Figure 13.Directional decomposition of the normalized cumulative spectral heatflux distribution for the interface between one- and four-layer graphene and heneicosane under the heat-graphene mode when the heneicosane is in (a) parallel-aligned perfect crystal,“edge-on” and (b) perpendicular-aligned perfect crystal,“end-on”.
Forcefield parameters for alkane and graphene, NEMD simulation setup under heat-graphene and heat-matrix modes, density profiles, thermal conductance versus widths of the system, VDOS profiles, pressure components distribution in the liquid heneicosane− graphene system, in-plane and out-of-plane spectral heat flux and VDOS formulas, and width of heating region influence on thermal conductance (PDF)
■
AUTHOR INFORMATIONCorresponding Author
*E-mail:[email protected].
ORCID
Hari Krishna Chilukoti:0000-0002-7882-0805
Vikram Reddy Ardham:0000-0002-9030-204X
Florian Müller-Plathe:0000-0002-9111-7786
Author Contributions
§H.K.C. and T.Z. contributed equally to this work.
Notes
The authors declare no competingfinancial interest.
∥Dr. Michael C. Böhm passed away on October 5, 2019.
■
ACKNOWLEDGMENTSThis work has been supported by the Collaborative Research Centre Transregio 75 (SFB-TRR 75)“Droplet dynamics under Extreme Ambient Conditions” of the Deutsche Forschungsge-meinschaft (DFG). We thank the Lichtenberg-High Perform-ance Computer at TU Darmstadt for the computing resources.
■
REFERENCES(1) Kandasamy, R.; Wang, X.-Q.; Mujumdar, A. S. Transient Cooling of Electronics Using Phase Change Material (PCM)-Based Heat Sinks. Appl. Therm. Eng. 2008, 28, 1047−1057.
(2) Shon, J.; Kim, H.; Lee, K. Improved heat storage rate for an automobile coolant waste heat recovery system using phase-change material in a fin-tube heat exchanger. Appl. Energy 2014, 113, 680− 689.
(3) Farid, M. M.; Khudhair, A. M.; Razack, S. A. K.; Al-Hallaj, S. A Review on Phase Change Energy Storage: Materials and Applications. Energy Convers. Manage. 2004, 45, 1597−1615.
(4) Zalba, B.; Marín, J. M.; Cabeza, L. F.; Mehling, H. Review on Thermal Energy Storage with Phase Change: Materials, Heat Transfer Analysis and Applications. Appl. Therm. Eng. 2003, 23, 251−283.
(5) Zhao, B.; Li, C.; Jin, Y.; Yang, C.; Leng, G.; Cao, H.; Li, Y.; Ding, Y. Heat Transfer Performance of Thermal Energy Storage Components Containing Composite Phase Change Materials. IET Renew. Power Gener. 2016, 10, 1515−1522.
(6) Harish, S.; Orejon, D.; Takata, Y.; Kohno, M. Enhanced Thermal Conductivity of Phase Change Nanocomposite in Solid and Liquid State with Various Carbon Nano Inclusions. Appl. Therm. Eng. 2017, 114, 1240−1246.
(7) Shahil, K. M. F.; Balandin, A. A. Graphene-Multilayer Graphene Nanocomposites as Highly Efficient Thermal Interface Materials. Nano Lett. 2012, 12, 861−867.
(8) Srinivasan, S.; Diallo, M. S.; Saha, S. K.; Abass, O. A.; Sharma, A.; Balasubramanian, G. Effect of Temperature and Graphite Particle Fillers on Thermal Conductivity and Viscosity of Phase Change Material N -Eicosane. Int. J. Heat Mass Transfer 2017, 114, 318−323. (9) Sun, X.; Ramesh, P.; Itkis, M. E.; Bekyarova, E.; Haddon, R. C. Dependence of the Thermal Conductivity of Two-Dimensional Graphite Nanoplatelet-Based Composites on the Nanoparticle Size Distribution. J. Phys.: Condens. Matter 2010, 22, 334216.
(10) Fang, X.; Fan, L.-W.; Ding, Q.; Wang, X.; Yao, X.-L.; Hou, J.-F.; Yu, Z.-T.; Cheng, G.-H.; Hu, Y.-C.; Cen, K.-F. Increased Thermal
Conductivity of Eicosane-Based Composite Phase Change Materials in the Presence of Graphene Nanoplatelets. Energy Fuels 2013, 27, 4041−4047.
(11) Veca, L. M.; Meziani, M. J.; Wang, W.; Wang, X.; Lu, F.; Zhang, P.; Lin, Y.; Fee, R.; Connell, J. W.; Sun, Y.-P. Carbon Nanosheets for Polymeric Nanocomposites with High Thermal Conductivity. Adv. Mater. 2009, 21, 2088−2092.
(12) Zhai, S.; Zhang, P.; Xian, Y.; Zeng, J.; Shi, B. Effective Thermal Conductivity of Polymer Composites: Theoretical Models and Simulation Models. Int. J. Heat Mass Transfer 2018, 117, 358−374.
(13) Srinivasan, S.; Diallo, M. S.; Saha, S. K.; Abass, O. A.; Sharma, A.; Balasubramanian, G. Effect of Temperature and Graphite Particle Fillers on Thermal Conductivity and Viscosity of Phase Change Material N-Eicosane. Int. J. Heat Mass Transfer 2017, 114, 318−323. (14) Nan, C.-W.; Birringer, R.; Clarke, D. R.; Gleiter, H. Effective Thermal Conductivity of Particulate Composites with Interfacial Thermal Resistance. J. Appl. Phys. 1997, 81, 6692−6699.
(15) Hasan, M. R.; Vo, T. Q.; Kim, B. Manipulating thermal resistance at the solid-fluid interface through monolayer deposition. RSC Adv. 2019, 9, 4948−4956.
(16) Vo, T. Q.; Kim, B. Transport Phenomena of Water in Molecular Fluidic Channels. Sci. Rep. 2016, 6, 33881.
(17) Liang, Z.; Tsai, H.-L. Reduction of solid−solid thermal boundary resistance by inserting an interlayer. Int. J. Heat Mass Transfer 2012, 55, 2999−3007.
(18) Liang, Z.; Tsai, H.-L. Effect of Thin Film Confined between Two Dissimilar Solids on Interfacial Thermal Resistance. J. Phys.: Condens. Matter 2011, 23, 495303.
(19) Saleman, A. R. b.; Chilukoti, H. K.; Kikugawa, G.; Shibahara, M.; Ohara, T. A Molecular Dynamics Study on the Thermal Transport Properties and the Structure of the Solid−Liquid Interfaces between Face Centered Cubic (fcc) Crystal Planes of Gold in Contact with Linear Alkane Liquids. Int. J. Heat Mass Transfer 2017, 105, 168−179.
(20) Chilukoti, H. K.; Kikugawa, G.; Shibahara, M.; Ohara, T. Local Thermal Transport of Liquid Alkanes in the Vicinity of Alpha-Quartz Solid Surfaces and Thermal Resistance over the Interfaces: A Molecular Dynamics Study. Phys. Rev. E: Stat., Nonlinear, Soft Matter Phys. 2015, 91, 052404.
(21) Fan, L.; Khodadadi, J. M. Thermal Conductivity Enhancement of Phase Change Materials for Thermal Energy Storage: A Review. Renewable Sustainable Energy Rev. 2011, 15, 24−46.
(22) Alexeev, D.; Chen, J.; Walther, J. H.; Giapis, K. P.; Angelikopoulos, P.; Koumoutsakos, P. Kapitza Resistance between Few-Layer Graphene and Water: Liquid Layering Effects. Nano Lett. 2015, 15, 5744−5749.
(23) Liu, Y.; Hu, C.; Huang, J.; Sumpter, B. G.; Qiao, R. Tuning Interfacial Thermal Conductance of Graphene Embedded in Soft Materials by Vacancy Defects. J. Chem. Phys. 2015, 142, 244703.
(24) Hu, L.; Desai, T.; Keblinski, P. Determination of Interfacial Thermal Resistance at the Nanoscale. Phys. Rev. B: Condens. Matter Mater. Phys. 2011, 83, 195423.
(25) Rastgarkafshgarkolaei, R.; Zeng, Y.; Khodadadi, J. M. A Molecular Dynamics Study of the Effect of Thermal Boundary Conductance on Thermal Transport of Ideal Crystal of N-Alkanes with Different Number of Carbon Atoms. J. Appl. Phys. 2016, 119, 205107.
(26) Babaei, H.; Keblinski, P.; Khodadadi, J. M. Thermal Conductivity Enhancement of Paraffins by Increasing the Alignment of Molecules through Adding CNT/Graphene. Int. J. Heat Mass Transfer 2013, 58, 209−216.
(27) Giri, A.; Braun, J. L.; Hopkins, P. E. Implications of Interfacial Bond Strength on the Spectral Contributions to Thermal Boundary Conductance across Solid, Liquid, and Gas Interfaces: A Molecular Dynamics Study. J. Phys. Chem. C 2016, 120, 24847−24856.
(28) Haynes, W. M. CRC Handbook of Chemistry and Physics, 95th ed.; Taylor & Francis Group, 2014; pp 3−288.
(29) Zhang, M.; Lussetti, E.; de Souza, L. E. S.; Müller-Plathe, F. Thermal Conductivities of Molecular Liquids by Reverse
equilibrium Molecular Dynamics. J. Phys. Chem. B 2005, 109, 15060− 15067.
(30) Nath, S. K.; Escobedo, F. A.; de Pablo, J. J. On the simulation of vapor−liquid equilibria for alkanes. J. Chem. Phys. 1998, 108, 9905− 9911.
(31) Lindsay, L.; Broido, D. A. Optimized Tersoff and Brenner Empirical Potential Parameters for Lattice Dynamics and Phonon Thermal Transport in Carbon Nanotubes and Graphene. Phys. Rev. B: Condens. Matter Mater. Phys. 2010, 81, 205441.
(32) Girifalco, L. A.; Hodak, M.; Lee, R. S. Carbon Nanotubes, Buckyballs, Ropes, and a Universal Graphitic Potential. Phys. Rev. B: Condens. Matter Mater. Phys. 2000, 62, 13104−13110.
(33) Jouti, B.; Petitjean, D.; Provost, E.; Bouroukba, M.; Dirand, M. Structural Evolutions of the N-Heneicosane and N-Tricosane Molecular Alloys at 293 K. J. Mol. Struct. 1995, 356, 191−199.
(34) Plimpton, S. Fast Parallel Algorithms for Short-Range Molecular Dynamics. J. Comput. Phys. 1995, 117, 1−19.
(35) Han, H.; Mérabia, S.; Müller-Plathe, F. Thermal Transport at Solid-Liquid Interfaces: High Pressure Facilitates Heat Flow through Nonlocal Liquid Structuring. J. Phys. Chem. Lett. 2017, 8, 1946−1951. (36) Chilukoti, H. K.; Kikugawa, G.; Ohara, T. Structure and transport properties of liquid alkanes in the vicinity of α-quartz surfaces. Int. J. Heat Mass Transfer 2014, 79, 846−857.
(37) Allen, M. P.; Tildesley, D. J. Computer Simulation of Liquids; Clarendon Press, 1989; p 385.
(38) Saaskilahti, K.; Oksanen, J.; Tulkki, J.; Volz, S. Spectral Mapping of Heat Transfer Mechanisms at Liquid-Solid Interfaces. Phys. Rev. E 2016, 93, 052141.
(39) Namsani, S.; Singh, J. K. Enhancement of Thermal Energy Transport across the Gold−Graphene Interface Using Nanoscale Defects: A Molecular Dynamics Study. J. Phys. Chem. C 2018, 122, 2113−2121.
(40) Konatham, D.; Striolo, A. Thermal Boundary Resistance at the Graphene-Oil Interface. Appl. Phys. Lett. 2009, 95, 163105.
(41) Gonzalez-Valle, C. U.; Ramos-Alvarado, B. Spectral Mapping of Thermal Transport across Sic-Water Interfaces. Int. J. Heat Mass Transfer 2019, 131, 645−653.
(42) Kim, B. H.; Beskok, A.; Cagin, T. Molecular Dynamics Simulations of Thermal Resistance at the Liquid-Solid Interface. J. Chem. Phys. 2008, 129, 174701.
(43) Tascini, A. S.; Armstrong, J.; Chiavazzo, E.; Fasano, M.; Asinari, P.; Bresme, F. Thermal Transport across Nanoparticle-Fluid Interfaces: The Interplay of Interfacial Curvature and Nanoparticle-Fluid Interactions. Phys. Chem. Chem. Phys. 2017, 19, 3244−3253.
(44) Lin, W. Introduction: Nanoparticles in Medicine. Chem. Rev. 2015, 115, 10407−10409.