Cell Systems, Volume9
Supplemental Information
Proteomics-Based Monitoring of Pathway Activity
Reveals that Blocking Diacylglycerol Biosynthesis
Rescues from Alpha-Synuclein Toxicity
Martin Soste, Konstantina Charmpi, Fabienne Lampert, Juan Atilio Gerez, Marc van
Oostrum,
Liliana
Malinovska,
Paul
Jonathan
Boersema,
Natalia
Cecilia
A
B
C
Normalized Biomass Time (hr) Two copies α-Syn 0.5 hr 3 hr 6 hrE
F
G
log2 fold change (α-Syn/vector)
-log10(q-value)
-log10(q-value)
500 most abundant proteins
vector3 vector1 vector2 α-Syn2 α-Syn1 α-Syn3
D
500 most abundant phosphopeptides
vector2 vector3 vector1 α-Syn1 α-Syn2 α-Syn3
log2 fold change (α-Syn/vector)
H
Phosphopeptide Protein Log2 FCI
J
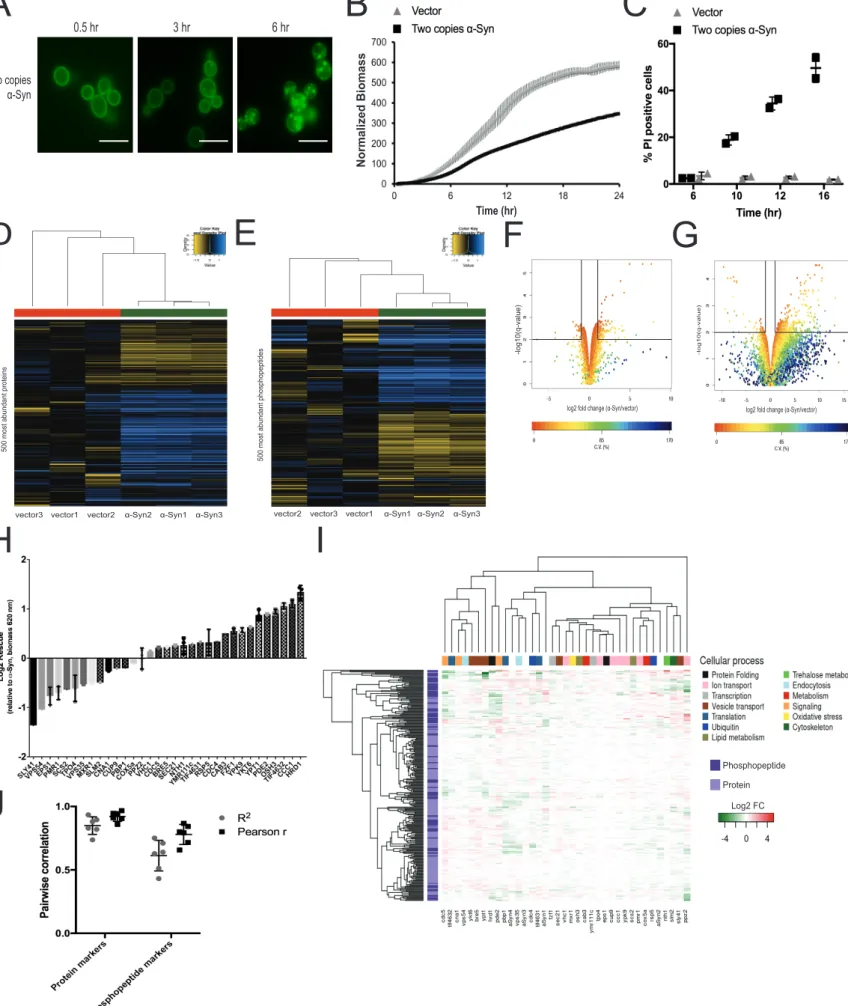
Figure S1. Phenotypic characterization, proteomics and genetic modulation of α-Syn-expressing yeast cells, related to Figure 1, Table S5, STAR methods. The previously described yeast model for α-Syn toxicity (Outeiro and Lindquist, 2003) was assessed (A) for the formation of inclusions by fluorescence microscopy of YFP-tagged α-Syn (scale bars represent 10 µm), (B) for mean growth inhibition (n=3), and (C) for mean cell viability (n=2) relative to vector control. (D-E) Hierarchically clustered heatmaps of label-free proteomic quantification displaying the 500 most intense (D) proteins and (E) phosphopeptides (n=3) (F-G) Volcano plots showing significantly regulated (F) proteins and (G) phosphopeptides in the α-Syn strain relative to vector control. C.V., coefficient of variation. (H) Rescue due to overexpression of each modulator calculated relative to growth of the α-Syn-expressing strain without modulation. According to previous studies (see also Table S5), enhancers are shown with solid bars and suppressors with checkered bars. All genes were previously classified as overexpression modulators, except VPS35 and COX5a, which were found to be deletion modulators. Log2 Rescue displayed as mean for modulators analyzed in batches 1-3 (n=3) and as single values for batch 4 (n=1) (I) Data from Figure 1B is displayed with clustering by modulator. Modulators are annotated according to their cellular process. (J) Mean pairwise corre-lations (n=6) of sentinel abundances in unmodulated α-Syn-expressing samples from four different proteomic analysis batches. All error bars repre-sent standard deviation.
Pah1 S744 & S748
D
A
B
C
Car1 Cwp1 Dot5 Ero1
Gpp1 Met10 Ncp1
She3 S361
Osh1 T1053 & S1056 Num1 S2494
Svl3 S666 Pho84 T316
Bcy1 T129
E
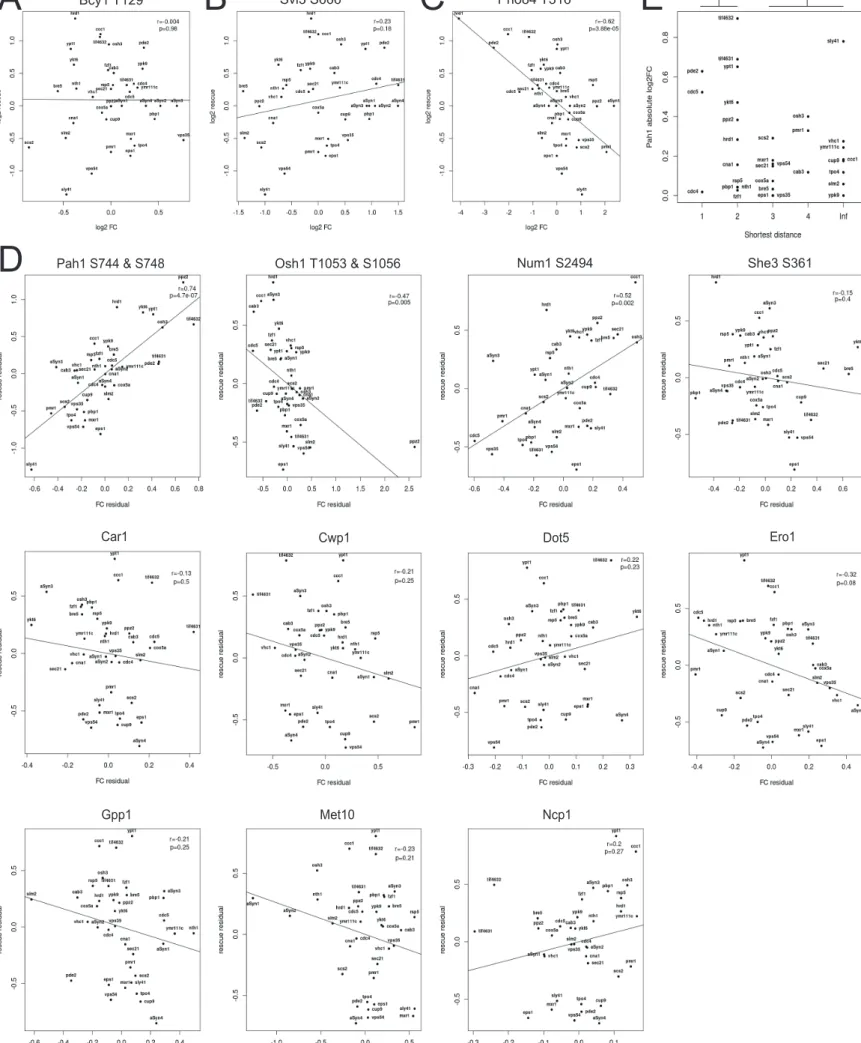
*Figure S2. Regression analyses and relationship between Pah1 phosphorylation and modulator distance to the closest Pah1 regulator, related to Figure 1, Figure 2, Table S12 and STAR methods. Additional examples of correlation plots show the extent of rescue plotted as a function of peptide abundance relative to the
vector strain. (A) Bcy1 T129 is a sentinel for Mck1 kinase activity, PKA and TOR inhibition, and Bcy1 activation (rank 86/103 phosphopeptides). (B) Svl3 S666 is an
α-Syn deregulated phosphopeptide (rank 95/103 phosphopeptides). (C) Pho84 T316 is an α-Syn deregulated phosphopeptide (rank 11/103 phosphopeptides). (D)
Partial regression is shown for each (phospho)protein sentinel with a maximal selection probability ≥ 0.6. Each panel shows the association of the variables, rescue and abundance, after removing the linear effects of the other sentinels that also passed the stability selection thresholds for both variables. Phosphosites and proteins were treated separately. The best fit line has been added to all plots. r, Pearson correlation coefficient. p, p-value from application of the correlation test (n=37). Note that the residuals are not independent and therefore the degrees of freedom need to be adapted for computing the p-values. (E) The log2 fold-change (FC) values of Pah1 S744
and S748 plotted as a function of the shortest path lengths found for the corresponding genetic modulator. If no shortest path was found, the path length was labeled as infinite (Inf). A one-tailed (two-sample) t-test was applied testing if the average FC was greater in observations at distance 1 or 2 (n1=14) compared to observations at distance 3, 4, or Inf (n2=19), *, p-value < 0.05.
C
F
D
E
G
α-SynYFP Nile Red Merge
α-Syn α-Syn Δnem1 α-Syn pah1-7A
α-Syn α-Syn Δpah1 α-Syn pah1-D398E
α-Syn ******* ** α-Syn Δnem1 α-Syn pah1-7A
H
*
**
α-Syn α-Syn Δnem1 GFP GFP Δnem1 TDP-43 Δnem1 TDP-43 FUS FUS Δnem1 α-Syn-YFP α-Syn Δnem1 α-Syn Ponceau α-Syn pah1-WT α-Syn pah1-7AA
I
J
α-Syn****
α-SynB
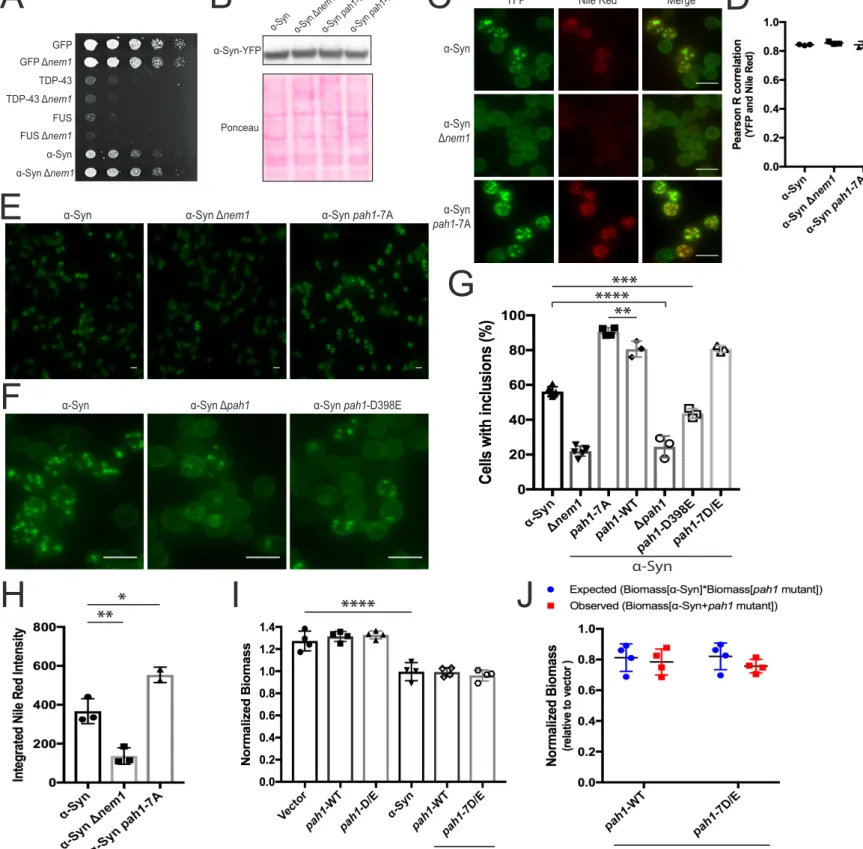
Figure S3. Regulation of α-Syn phenotypes by Pah1 activity, related to Figure 3, Figure 4 & STAR methods. (A) Yeast strains
spotted onto galactose-containing medium to induce expression of GFP or other aggregation-prone proteins (n=3) (B) α-Syn
abun-dance, assessed by western blot (n=4 for α-Syn and Δnem1, n=1 for α-Syn pah1-WT and α-Syn pah1-7A) (C) Representative images
of α-Syn-YFP cells stained with Nile red. (D) Co-localization of α-Syn and cellular lipids was assessed by correlation of YFP and Nile
red. Mean Pearson R values were compared (one-way ANOVA adjusted for multiple comparisons, n≥2, alpha=0.05). (E)
Representa-tive fields of view used to quantify the percentage of indicated cells with α-Syn inclusions. (F) Representative fields of view of
α-Syn-YFP in Pah1 mutants. (G) Cells with and without α-Syn-YFP inclusions were counted in three fields of view. Mean counts
expressed as percentages with standard deviation between biological replicates for solid data points and between fields of view for hollow data points were compared (n>3 marked with solid data points and n=1 marked with hollow data points; one-way ANOVA
adjusted for multiple comparisons, alpha=0.05). (H) Mean Integrated Nile Red intensity was used to quantify lipid abundance (one-way
ANOVA adjusted for multiple comparisons, n≥2, alpha=0.05). (I) Mean normalized biomasses of pah1-7D/E mutant or pah1-WT yeast
strains grown in 1 nM estradiol to induce α-Syn expression were monitored over 24 h (one-way ANOVA adjusted for multiple
compari-sons, n=4, alpha=0.05) (J) Observed and expected biomass of strains expressing α-Syn and a Pah1 mutant. Biomass data from (I)
were used and means were compared (two-way ANOVA adjusted for multiple comparisons, alpha=0.05). ****, p-value < 0.0001; ***, p-value < 0.001; **, p-value < 0.01; *, p-value < 0.05. All error bars represent standard deviation. All scale bars represent 10 µm.
LPIN1 LPIN2 LPIN3
HSC70 HSC70 HSC70
LPIN1
siRNA: Control LPIN2 Control LPIN3 Control
IES1 IES1 MED6 MED6 SSK1SSK1 SSK2 SSK2 MED1 MED1 RFC1RFC1 STH1 STH1 RSC4 RSC4 RTG3RTG3 MSC3MSC3 BDF1BDF1 MKS1 MKS1 SEG1SEG1 OSH2 OSH2 PHO4
PHO4 KAR3KAR3
INP53 INP53 PHO84
PHO84 TCO89TCO89
GCN2 GCN2
ISW2 ISW2 ORM2
ORM2 GGA1GGA1 SCS2SCS2 NTC20NTC20 RGA2RGA2 DLS1DLS1
GCS1 GCS1 CWC2 CWC2 INP52INP52 MSS4MSS4 KOG1 KOG1 GUS1 GUS1 ESC1 ESC1 BUL1
BUL1 ORC2ORC2
TAF2 TAF2 TAF12 TAF12 MCM3MCM3 NUP157 NUP157 EPO1 EPO1 ENA1 ENA1 SLM1SLM1 NHA1 NHA1 MOT2
MOT2 NUP84NUP84
SEC7
SEC7 MES1MES1 AVO2AVO2
SIR3 SIR3 SIR4 SIR4 LDB19 LDB19 NUP145NUP145 CSL4 CSL4 CDC39 CDC39 NOP6NOP6 TSC11 TSC11 NUP1 NUP1 NOP19 NOP19 RRP6 RRP6 NUP100NUP100 SPO12 SPO12 NET1 NET1 CDC14CDC14 ECM21 ECM21 XRN1 XRN1 REG1REG1 TIF3
TIF3 PMA1PMA1
SLI15 SLI15 NUR1 NUR1 RPS7A RPS7A PAT1 PAT1 CDC55CDC55 EDC3
EDC3 RPS16ARPS16A RTS1RTS1
PKH3 PKH3 TIF4632
TIF4632 PDI1PDI1
KAR2 KAR2 SFB3 SFB3 FPK1 FPK1 FUN12
FUN12 TIF4631TIF4631 YPK2YPK2
MLC1 MLC1 RPL8B
RPL8B
PKH2
PKH2 CYR1CYR1 RIM15RIM15 CCH1CCH1
SEC16 SEC16 BUD3 BUD3 SNF3 SNF3 NOP12 NOP12 AXL2 AXL2 STM1 STM1 SPA2SPA2 ATG1
ATG1 BUD6BUD6
UME6 UME6 BCK1 BCK1 NOP2 NOP2 HOS4 HOS4 ATG13
ATG13 TOD6TOD6
MIG1
MIG1 ATG19ATG19 LAS1
LAS1 BNI1BNI1
RPA190 RPA190
CNM67
CNM67 SNT1SNT1 RCO1RCO1 STB3STB3
PAH1
PAH1 PUP2PUP2 STE20STE20
CYC8 CYC8 GIC2 GIC2 STB1 STB1 SPC110 SPC110 RPC82 RPC82 NPR3 NPR3 BLM10 BLM10 SYP1 SYP1 URA2 URA2 CDS1CDS1 GPT2 GPT2 NPR2 NPR2 WHI5WHI5 SKP1 SKP1 MTC5MTC5 SPC29 SPC29 HXK1 HXK1 TGL4TGL4 RTC1 RTC1 EDE1EDE1 BBC1BBC1 NTH1 NTH1 YLR352W
YLR352W YAP1802YAP1802 STF2 STF2 UBR1 UBR1 VRP1VRP1 BBP1 BBP1 TSL1 TSL1 TGL1TGL1 SLA2 SLA2 HSP26 HSP26 LAS17LAS17 MSC1 MSC1 PAN1PAN1 MPS2 MPS2 SAC6 SAC6 SLA1 SLA1 RTN2 RTN2 ARK1ARK1 HBT1 HBT1 ABP1 ABP1 CRN1 CRN1 PRK1 PRK1
A
B
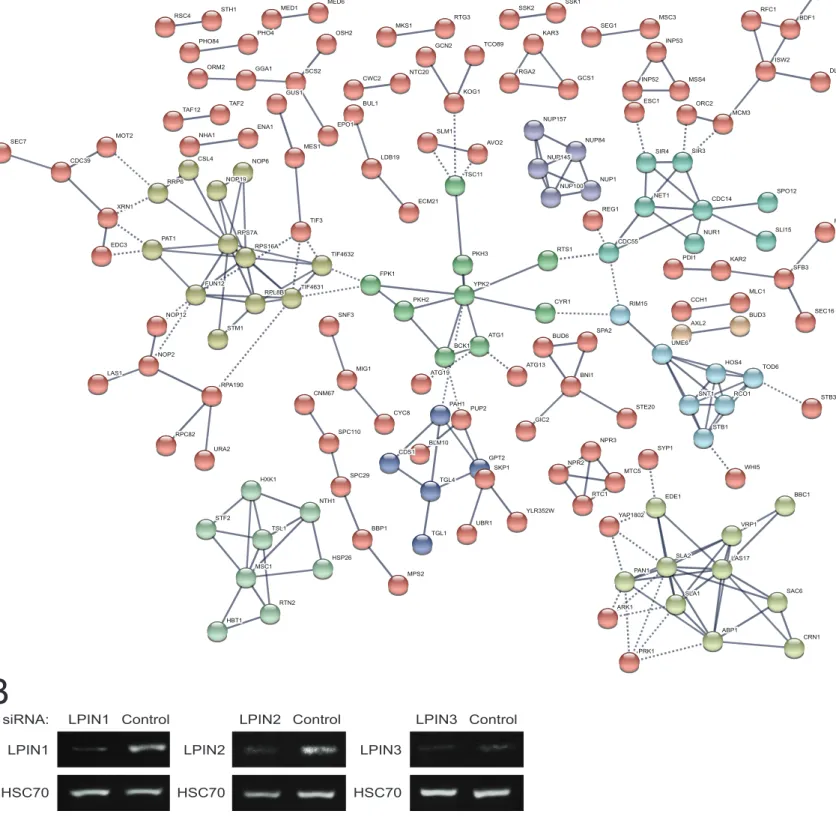
Figure S4. Effects of propranolol on the α-Syn yeast phosphoproteome and siRNA-mediated inhibition of lipins in HEK293 cells perturbed by α-Syn fibrils, related to Figure 4, STAR methods. (A) STRING network of regulated phosphoproteins upon
propranolol treatment of estradiol-induced α-Syn yeast. A confidence threshold of 0.9 interaction score was applied. Disconnected nodes were omitted. K-means clustering was set with K=10 and is displayed with different colors. Intra-cluster edges are represented
by solid lines and inter-cluster edges are represented by dashed lines. (B) siRNA efficiency was assessed by RT-PCR. Cells were
transfected with the indicated siRNAs and lipin expression (LPIN1-3) was quantified by non-saturating RT-PCR. An unrelated mRNA (HSC70) was quantified as a loading control.