I
The importance of geographical proximity:
Evidence on the concentration of firms, culture
and political ideologies
A dissertation presented by
Daniele Mantegazzi
Submitted to the
Faculty of Economics
Università della Svizzera italiana
for the degree of
Ph.D. in Economics
Thesis Committee:
Prof. Rico Maggi, supervisor, Università della Svizzera italiana
Prof. Raphaël Parchet, internal examiner, Università della Svizzera italiana
Prof. Frank van Oort, external examiner, Erasmus University Rotterdam
Acknowledgements
This dissertation is the outcome of my Ph.D. research, which kept me busy for the last 5 years. During these years, I have grown both professionally and personally, and I would not have been able to accomplish this important project without the help and the support of many people. It is my great pleasure and honor to express my gratitude to them.
First and foremost, I would like to sincerely thank my supervisor, Professor Rico Maggi, for his guidance, his generous assistance, his motivational impulses and invaluable inputs. Already during my years as undergraduate student, I had the opportunity to collaborate with him and he has always been prompted for inestimable advices of every kind.
I also would like to thank my thesis committee, Professor Raphaël Parchet and Professor Frank van Oort, for evaluating my thesis and their insightful comments and suggestions, which are very important to me.
During my PhD, I had the opportunity to visit the Department of Economic Geography at the University of Groningen thanks to a Doc.CH grant founded by the Swiss National Science Foundation. I owe my deepest gratitude to Professor Philip McCann and Dr. Viktor Venhorst, who supervised me during the whole year of my stay and, with their stimulating and motivating guidance, contributed significantly to the value of my thesis. Their input has been great to my research and my personal and professional growth.
My visit in Groningen was important to me also because I met friendly and helpful colleagues with whom I had innumerable fruitful discussions, and, above all, I found very dear friends with whom I shared countless enjoyable moments. Hence, I want to deeply thank Anna, Anne, Dylan, Els, Fikri, Gwenda, Heike, Jannes, Joost, Karina, Laurence, Lili, Marten, Mirjam, Nikos, Paul, Richard, Sierdjan, Suzan and Viktor.
During my doctoral studies, I benefited enormously from the Swiss Program for Beginning Doctoral Students in Economics offered by the Study Center Gerzensee. I would like to express my gratitude to the Foundation of the Swiss National Bank and to the professors who taught there. Besides learning and developing the analytical and methodological skills needed in order to conduct high-level economic and academic research, the year in Gerzensee was important to me also because I met many dear friends. In particular, I would like to sincerely thank Afsoon, Anna, Ben, Christian, Kathi, Nana, Simon B., Simon H. and Yannic.
I would like to show my gratitude to Professor Levente Littvay, who taught “Multilevel Regression Modelling” at the European Consortium for Political Research Winter School in Bamberg (2015) and provided valuable insight and assistance in developing Chapter 1.
I also thank colleagues at the European Regional Science Association congresses in Lisbon (2015), Vienna (2016) and Groningen (2017), the Swiss Society of Economics and Statistics annual congress in Lugano (2016), the North American Regional Science Council in Minneapolis (2016), the Regional Science Association International world congress in Goa (2018), the Association of European Schools Of Planning Young Academics conference in Groningen (2018) and the Regional Studies Association annual conference in Lugano (2018), for their useful comments.
I want to thank my colleagues and friends at the Institute for Economic Research (IRE), for all the conversations and support in every step of my doctoral studies. We have a lovely working environment with professional and serious discussions as well as funny and amusing moments. In particular, I would like to express my deep gratitude to Ale, Andrea, Davide, Fede M., Fede R., Igor, Moreno, Paolo, Riccardo and Stefano for sharing stories and helping each other. A very special thanks to Leti, for all her incredible support, her open door at any time, her invaluable and hearty encouragement and for making every possible effort to provide this nice environment.
I would like to thank my friends, Andrès, Bas, Davide, Fra, Giuliano, Loris and Nico, as well as my love, Vanessa, and all the others who stood by me in these years, for all their unlimited support and much appreciated encouragement.
Finally, and most importantly, I would like to thank my beloved family, Lolla and Robi, as well as Chanty, Mayla, Mini and Tom, and, above all, my dear parents, Ariane and Carlo, whose sacrifices, love and encouragement have bought me to where I am and who taught me the most important life lessons. For all this, I dedicate this dissertation to them.
Contents
Introduction ………1
1. Chapter 1: Agglomeration matters for firm solvency ... 13
1.1 Introduction ... 14
1.2 Literature review ... 15
1.3 Methodology ... 16
1.4 Data and variables ... 17
1.5 Results ... 23
1.6 Conclusions ... 28
References ... 30
2. Chapter 2: The impact of language borders on the spatial decay of agglomeration spillovers ... 33
2.1 Introduction ... 34
2.2 Literature review ... 35
2.3 Methodology ... 38
2.4 Data and variables ... 39
2.5 Results ... 44
2.6 Conclusions ... 51
References ... 52
Appendix 2.A – Agglomeration economies indices ... 57
Appendix 2.B – Kernel density of distance between all municipalities and the closest city 58 Appendix 2.C – Descriptive statistics... 59
Appendix 2.D – Correlation between agglomeration economies indices and their spatial lag ... 60
Appendix 2.E – Municipal level variables ... 61
3. Chapter 3: The geography of political ideologies in Switzerland ... 65
3.1 Introduction ... 66
3.2 Literature review ... 67
3.3 Methodology ... 70
3.4 Data ... 72
3.5 Results and discussion ... 73
References ... 85
Appendix 3.A – Results of the factor analyses ... 89
Appendix 3.B – Results of Dunn’s tests ... 99
List of Figures
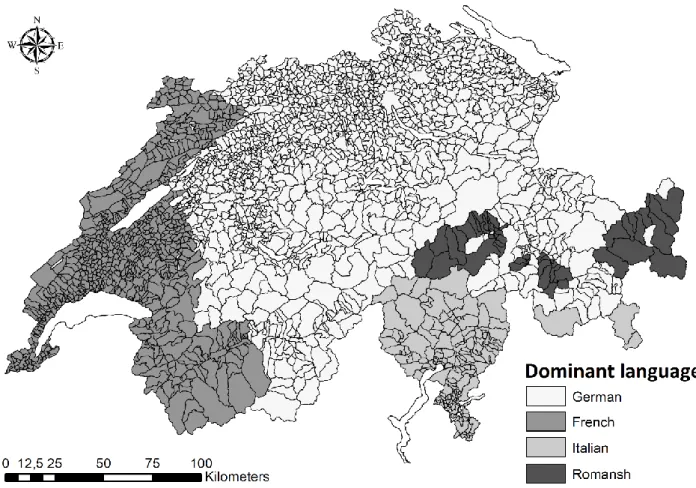
Figure 2.1 - Dominant national language in all Swiss municipalities, 2000 ... 38
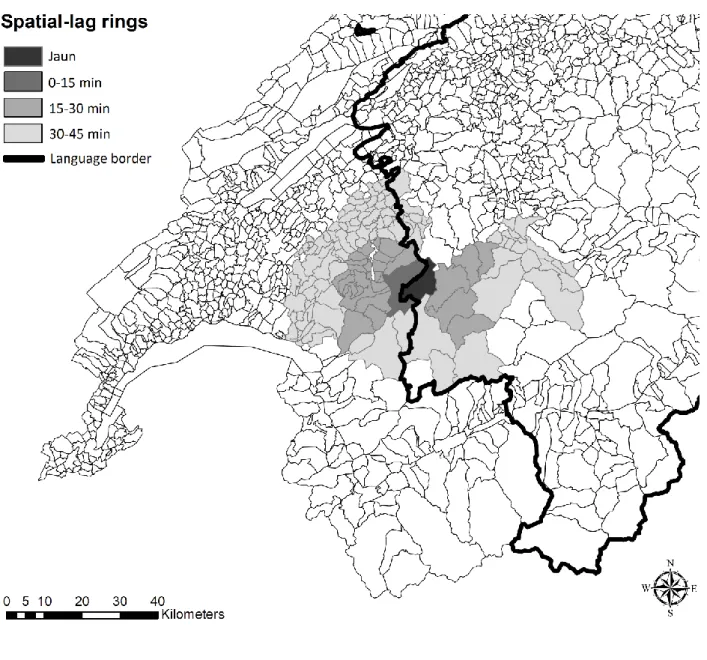
Figure 2.2 - Spatial-lag rings ... 42
Figure 2.3 - The geographical extension of specialization externalities ... 46
Figure 2.4 – The geographical extension of competition externalities ... 47
Figure 2.5 – The geographical extension of diversity externalities ... 48
Figure 3.1 – The political ideology position of Swiss municipalities ... 76
Figure 3.2 - Local Moran's I statistics for the Left-Right dimension ... 77
Figure 3.3 - Local Moran's I statistics for the Liberal-Conservative dimension ... 78
Figure 3.4 - Local Moran's I statistics for the Ecological-Technocratic dimension ... 79
List of Tables
Table 1.1 - Comparison between sample and population of firms in Ticino ... 18Table 1.2 - Descriptive statistics of firm-level indicators and agglomeration economies ... 19
Table 1.3 - List of municipal-level variables ... 20
Table 1.4 - Descriptive statistics of municipal-level indicators ... 21
Table 1.5 - Factor scores at the municipal level ... 22
Table 1.6 - Model fit comparison ... 24
Table 1.7 - Spatial multilevel model on firm solvency ... 27
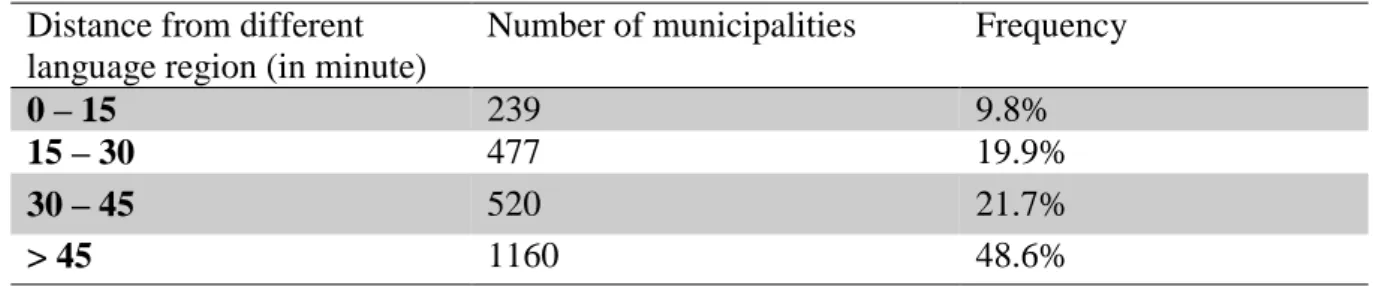
Table 2.1 - Distance of Swiss municipalities from a language border ... 43
Table 2.2 - Cross-classified multilevel model on employment growth at the establishment level in Switzerland ... 45
Table 2.3 – Robustness check cross-classified multilevel models on employment growth at the establishment level in Switzerland ... 50
Table 3.1 – Results of the Kruskal-Wallis tests on the “Left-Right” dimension ... 80
Table 3.2 – Results of the Kruskal-Wallis tests on the “Liberal-Conservative” dimension .... 81 Table 3.3 – Results of the Kruskal-Wallis tests on the “Ecological-Technocratic” dimension82
Introduction
This dissertation is composed of three independent research articles focusing on the importance of geographical concentrations along various dimensions in regional economics. More specifically, the thesis deals with topics regarding agglomeration spillovers, firm performance, culture and soft institutions as well as the geographical concentration of political ideologies. The aim of this work is to provide empirical evidence of the importance of spatial proximity in different contexts. In particular, the purpose of this thesis is threefold: 1) to analyze the effects of spatial concentrations of firms on their ability to access to credit; 2) to examine whether language barriers influence the geographical extension of different types of agglomeration spillovers; and 3) to empirically identify whether there is any spatial concentration of political ideologies and verify whether this concentration is correlated with income and income inequality.
In the last decades, there has been an increasing attention from various actors in the society to the topic of economic globalization, defined as the growing openness of local and national economies, which integrate into a single world economy (Iammarino and McCann, 2013; Pike et al., 2017). During the 1990s and early 2000s, the acceleration of this process, combined with the beginning of the Digital Age (Castells, 1996), contributed to the rise of views in which geographical distances are no longer important. Indeed, some have claimed that the world was becoming “flat”, in the sense that the emergence of a global network, in which all economic actors operate, drastically reduces (and maybe eliminates) the need and the benefits of spatial proximity (O’Brien, 1992; Friedman, 2005).
In contrast with this view, as highlighted by Pike et al. (2017), in the last decades there has been an increase in the urbanization process, in which people and economic activities are more and more concentrated in cities. Hence, globalization, rather than making the world more “flat”, is in reality making it more “spiky” (Florida, 2005; Rodríguez-Pose and Crescenzi, 2008) and “curved” (McCann, 2008). Indeed, as highlighted by McCann (2018), the evolution of globalization processes over the last centuries clearly shows that geographical distance has become today even more important than in the past. In particular, the first era of globalization, which started in the seventeenth century and lasted until the middle of the twentieth century, was characterized by trade relationships occurring over large distances with neighboring countries trading different types of goods. This is a characteristic feature of international trade during the European colonial period. However, modern globalization, which started in the middle of the twentieth century, is mainly characterized by trade relationships between neighboring countries with similar economic profiles and trading similar goods. Modern globalization is not based on competing on the cost of inputs, but is based on adding value into the production process, which depends on knowledge exchange, especially through
face-to-face interactions. As the importance of knowledge increases, so does the need for concentration, which highlights the importance of cities in this modern globalization process. This has led to the term “global regionalism” (Iammarino and McCann, 2013), describing groups of neighboring countries which are more and more integrated on various economic dimensions. Hence, as underlined by Iammarino and McCann (2013), geographical proximity has become even more important in processes of knowledge spillovers and agglomeration externalities. In particular, the role of global cities is nowadays particularly relevant because of their ability to concentrate economic activities, attract financial and human capital as well as facilitate innovation processes (Pike et al., 2017). The underlying reason is that there are productivity gains due to clustering, proximity and economies of scale. At the sub-national level, a consequence of these processes is an increase in inter-regional divergence (Brackman and van Marrenwijk, 2008). All these changes demonstrate and support the arguments which were already formalized from a theoretical perspective in the “new economic geography” literature, which relies on the concept of economies of scale at the national level, the regional level (cities), and the firm level (Krugman, 1991).
Nevertheless, although there is an increasing number of studies demonstrating the importance of geographical proximity in international trade and economic geography, various actors in the society argue that this is no longer true and that the world is in a “post-geography trading phase” (Financial Times, 2016), supporting claims such as the “end of geography”, the “death of distance”, or the “world is flat” (McCann, 2008). Political narratives built on these arguments, even if incorrect, might have significant consequences. Indeed, as highlighted by McCann (2018), the results of the Brexit referendum represent a key example, in which these claims have been used to justify the easiness with which the UK economy could replace the trade relationships with the European Union with new and deeper trade relationships with countries farther away. Similar arguments are also supported by various politicians and actors in the Swiss society aiming at cancelling the bilateral agreements between Switzerland and the European Union. The increasing evidence from economic geography clearly contradicts these narratives, but seems to suffer from problems of persuasion, making it difficult to build serious debates within a society, because often based on arguments unrelated to empirical reality (McCann, 2018).
The purpose of this thesis is to enrich the current discussion on the relevance of spatial proximity by proposing empirical analyses demonstrating that distance still represents an obstacle for various processes in regional economics. The contribution of this work is to demonstrate for the first time the importance of geographical proximity in unexplored dimensions of regional economics. More specifically, the first study aims at empirically verifying whether agglomeration spillovers affect a particular indicator of firm performance, namely firm solvency, which, in turn, determines
firms’ ability to borrow. In the second research, the goal is to examine empirically whether the spatial scale of the different types of agglomeration spillovers shape and/or are shaped by cultural and soft institutional discontinuities, as reflected by linguistic differences between localities. Finally, the third analysis proposes a new definition of spatial cohesion, based on the geographical concentration of political ideologies, and aims at empirically identifying whether there is any spatial concentration of political ideologies and verify whether these concentrations are correlated with income and income inequality.
These three chapters, in particular the first two studies, link to the endogenous growth theory (Romer, 1986; Lucas, 1988; Krugman, 1991; Rebelo, 1991; Aghion and Howitt, 1992; based on the works of Arrow, 1962; Uzawa, 1965; Sidrauski, 1967), stating that positive externalities and knowledge spillover effects have an important influence on economic development. In particular, knowledge spillovers and externalities are among the key drivers supporting the agglomeration of firms. Within this context, cluster theories state that the geographical concentration of economic activities generates different cost-saving benefits and productivity advantages which are external to firms. Marshall (1920) first described clusters as a “concentration of specialized industries in particular localities”.
Hence, according to economic theory, the economic performance of regions and firms is enhanced by the existence of agglomeration economies in the regions (McCann, 2001). In addition, economists have identified different kinds of agglomeration economies. The three main typologies of agglomeration externalities which have been investigated by researchers are localization economies, urbanization spillovers and competition externalities.
Localization (also known as specialization or MAR) economies (Marshall, 1920; Arrow, 1962; Romer, 1986) arise from the geographical concentration of businesses belonging to the same industry, allowing communication and cooperation processes. Within this framework, firms benefit from the concentration of other businesses belonging to the same industry because of three main reasons: larger pools of skilled labor in the surrounding area, more specialized suppliers and knowledge inflows from competitors.
Specialization economies are external to firms but internal to industry. On the contrary, urbanization (or Jacobs) externalities (Jacobs, 1969), as specified in Hoover (1937, 1948), are external to firms, while internal to urban concentration. The main idea behind this kind of agglomeration economies is that the diversity of spatially concentrated industries promotes the cross pollination of ideas across industries. Thus, while specialization economies arise from the geographical
concentration of firms belonging to the same industry, urbanization economies derive from the spatial concentration of businesses belonging to different industries.
Competition (or Porter) externalities (Porter, 1990) arise from the spatial concentration of firms competing in the same market. Hence, like specialization economies, competition externalities take the form of intra-industry transmission of knowledge spillovers, however, they derive from the regional competition within industries, as in the case of Jacobs externalities.
Taking into account this strand of the literature, the first chapter of this thesis empirically tests whether various typologies of agglomeration spillovers impact a particular indicator of firm performance, namely firm solvency. This indicator is not self-reported by firms (as it is often the case with other indicators used in the literature), rather it is computed from an external and standardized perspective and it is used by financial markets in order to reduce the asymmetries in information characterizing them (Bernanke et al., 1999). Therefore, this measure is important in determining firms’ ability to borrow. The underlying research question of this study is the following: do agglomeration spillovers impact on firm solvency? The analysis focuses on whether employment specialization and diversity patterns influence firm solvency.
The empirical results of this study imply that agglomeration mechanisms shape firm’s credit accessibility, along with the characteristics of the firm itself and geographical information. As highlighted by the economic literature, this has in turn implications on firm’s investment possibility and therefore on their ability to strengthen their productivity. This study finds that firms located in Ticino benefit from the municipal concentration of firms within the same industry, while urbanization externalities, at both municipal and cantonal levels, seem to generate congestion diseconomies, having a predicted negative impact on firm solvency.
The second study of this thesis combines the stream of literature on agglomeration economies with a growing body of literature highlighting that culture, “soft” or informal institutions and economy are interrelated (Beugelsdijk and Maseland, 2011; De Jong, 2009), and, in particular, that culture and informal or soft institutions heavily shape and are shaped by economic geography (Pike et al., 2011; Storper, 2013). More specifically, the aim of this chapter is to examine whether there is any detailed empirical evidence that a particular dimension of culture, namely language, does indeed influence economic geography, in a context where neither ethnic diversity nor poor institutional quality are key features.
In order to do so, this analysis examines whether language borders influence the geographical extension of different types of agglomeration spillovers. In particular, this research examines
empirically how local employment patterns are related to linguistic differences between localities. The analysis focuses on Switzerland, which represents an appropriate case-study for examining these types of cultural differences, because in the specific case of Switzerland linguistic differences have indeed been argued to be the key marker of cultural differences (Hofstede, 2001). In this context, this study tracks how employment patterns in one locality are related to those in neighboring localities, and examines whether these relationships differ across linguistic borders in a manner which is distinct from simply different locality administrative borders. In particular, the analysis examines whether employment specialization or diversity patterns differ across different types of borders, after controlling for geographical, economic and topographical features.
The results of this study demonstrate that, in the context of Switzerland, linguistic differences shape the economic geography of agglomeration mechanisms. These findings imply that the spatial scale of the different types of agglomeration spillovers are indeed mediated and altered by linguistic discontinuities. More specifically, according to the results, specialization externalities are enhanced when firms are located close to municipalities with the same language, whereas competition and diversity externalities are reinforced when firms are located close to municipalities with different languages. Exactly why these particular empirical results emerge is a different question and is left for future research. It is possible that linguistic discontinuities may represent an obstacle to the geographical extension of specialization externalities. As seen above, localization economies tend to arise from the direct interaction among firms operating in the same sector and in the same area, and therefore on the basis of these results it seems reasonable to infer that linguistic differences may introduce an obstacle to direct knowledge-interactions among firms operating in broadly the same field. On the other hand, the results suggest that linguistic differences may encourage knowledge interactions between firms operating in different fields, in a manner reflecting the arguments of Jacobs (1969), although, at this stage these explanations can only be tentative and speculative and require much more deliberation.
The third chapter of this thesis analyses geographical concentrations and the relevance of spatial proximity from a different perspective. More specifically, the aim is to propose a new definition of spatial cohesion, representing a new way to capture social interactions, based on the geographical concentration of political ideologies. The research links to the literature on geographical sorting, stating that people with similar income levels cluster together due to similar constraint in the residential decision (Fujita, 1989, based on the pioneering work of von Thünen, 1826 and Alonso, 1964) and because of individual preferences to live close to people with similar socio-economic characteristics (Tiebout, 1956). At the same time, the political science literature is increasingly interested in the phenomenon of partisan sorting, which analyzes whether individuals with similar
political preferences are nowadays more geographically clustered (Bishop, 2008; Abramowitz, 2010; Abrams and Fiorina, 2012; Tam Cho et al., 2013). Additionally, according to the literature on voting behavior, people sorting themselves based on socio-economic characteristics are also expected to share similar political ideologies. The implication is that income-sorting processes and partisan-sorting forces are likely to be interrelated phenomena, leading to the clustering of people having similar levels of income and political ideologies.
The aim of this research is to empirically identify whether there is any spatial concentration of political ideologies in the context of Switzerland and determine the spatial extension of these concentrations. Moreover, this study analyzes whether this clustering of political preferences is correlated with income and income inequality. The analysis focuses on Switzerland, which represents a very interesting case because it practices a semi-direct democracy, which allows having a rich dataset on many referenda, which is independent from short-term, candidate-related and party-related factors. The benefit of using data related to referenda is that they are the direct observed outcome of underlying unobserved political ideologies.
Following Hermann and Leuthold (2003), this research analyzes the results of 312 federal referenda between 1981 and 2017 at the municipal level. This study identifies Hermann and Leuthold (2003)’s three dimensions representing the Swiss political ideology space and expressing the following political beliefs: left vs. right, liberal vs. conservative and ecological vs. technocratic. Additionally, on each of these three dimensions, this analysis empirically assesses the existence of spatial concentrations of Swiss municipalities sharing the same political ideology. This result is particularly interesting because it shows that the various sorting processes leading to the concentration of people sharing similar political preferences extend beyond municipal borders. Finally, based on these results, this research finds significant differences in the level of income and income inequality of Swiss municipalities, depending on their belonging to a political ideology cluster. This result contributes and further supports the findings and claims of other scholars, related to the concept of “the geography of discontent”, referring to the spatial distribution of discontent in a country, reflecting inequalities between regions in terms of economic welfare (Los et al., 2017; Rodríguez-Pose, 2017; McCann, 2018) and according to which economic geography is particularly important in understanding how people vote.
In general, the results of the analyses contained in this thesis contribute to the current discussion on the importance of geographical proximity, by empirically demonstrating that distance still represents an obstacle for various processes in economics, against the view that the world has become “flat”. These results further support the findings and claims of other scholars, arguing that,
along with the rise of globalization processes, distance has become even more important. More specifically, the findings of this thesis shed light on unexplored aspects of agglomeration processes and demonstrate the importance of geographical proximity in the cases of firm’s credit accessibility, the interaction between culture and agglomeration externalities, and the interaction between political ideologies and economic welfare. These findings are particularly interesting because they emerge from the Swiss context, a small open economy in which globalization processes have always had great impacts and where distances are notably small.
The rest of the thesis is organized as follows: the next chapter is dedicated to the analysis on the effects of spatial concentrations of firms on their ability to access to credit. The second chapter examines whether linguistic differences influence the geographical extension of different types of agglomeration spillovers, while the third chapter empirically identifies whether there is any spatial concentration of political ideologies and verifies whether this concentration is correlated with welfare. Finally, a conclusion paragraph draws results and conclusions of the dissertation.
References
Abramowitz, A., 2010, “Transformation and polarization: The 2008 presidential election and the new American electorate”, Electoral Studies, 29(4):594-603.
Abrams, S. and Fiorina, M., 2012, “’The big sort’ that wasn’t: A skeptical Reexamination”, Political
Science and Politics, 45(2):203-10.
Aghion, P. and Howitt, P., 1992, “A Model of Growth through Creative Destruction”, Econometrica, 60(2):323-51.
Alonso, W., 1964, Location and Land Use. Harvard University Press, Cambridge, MA.
Arrow, K., 1962, “Economic Welfare and the Allocation of Resources for Invention.” In The Rate
and Direction of Inventive Activity: Economic and Social Factors, 609–626. National Bureau of
Economic Research, Inc.
Bernanke, B., Gertler, M. and Gilchrist, S., 1999. “The financial accelerator in a quantitative business cycle framework”. In Taylor, J. and Woodford, M., editors, Handbook of Macroeconomics, 1(1):1341-1393. Elsevier.
Beugelsdijk, S. and Maseland, R., 2010, Culture in Economics: History, Methodological Reflections
and Contemporary Applications, Cambridge University Press.
Bishop, B., 2008, The Big Sort: Why the Clustering of Like-Minded America Is Tearing Us Apart, Houghton Mifflin, Boston.
Brakman, S. and van Marrewijk, C., 2008, “It’s a big world after all: on the economic impact of location and distance”, Cambridge Journals of Regions, Economy and Society, 1(3):411-437.
Castells, M., 1996, The rise of the network society: the information age: economy, society and culture
Vol.1. Oxford: Blackwell.
De Jong, 2009, Culture and Economics: On Values, Economics and International Business, London: Routledge.
Financial Times, 2016, UK entering a “post‐ geography trading world” says Liam Fox, 29 September.
Florida, R., 2005, The flight of the creative class: and how it is transforming work, leisure, community
and everyday life. New York: Harper Collins
Friedman, T., 2005, The world is flat: a brief history of the twenty-first century. New York: Farrar, Straus, and Giroux.
Fujita, M., 1989, Urban Economic Theory: Land Use and City Size. Cambridge University Press, Cambridge.
Hermann, M. and Leuthold, H., 2003, Atlas der politischen Landschaften: ein weltanschauliches
Porträt der Schweiz, vdf Hochschulverlag AG, Zürich.
Hofstede, G., 2001, Culture's Consequences: Comparing Values, Behaviors, Institutions and
Organizations Across Nations, 2nd Edition, Thousand Oaks CA: Sage Publications.
Hoover, E., 1937, Location Theory and the Shoe and Leather Industries, Harvard University Press, Cambridge Mass.
Hoover, E., 1948, The Location of Economic Activity, McGraw Hill, New York.
Iammarino, S. and McCann, P., 2013, Multinationals and economic geography: location and
technology, innovation. Edward Elgar, Cheltenham.
Jacobs, J., 1969, The economy of cities, Vintage international. Random House.
Krugman, P., 1991, “Increasing returns and economic geography”, Journal of Political Economy, 99:483-499.
Los, B., McCann, P., Springford, J., and Thissen, M., 2017, “The mismatch between local voting and the local economic consequences of Brexit”, Regional Studies, 51:786-799.
Lucas, R., 1988, “On the mechanics of economic development”, Journal of Monetary Economics, 22:3-42.
Marshall, A., 1920, Principles of Economics: An Introductory Volume, Macmillan and Co. McCann, P., 2001, Urban and Regional Economics, Oxford University Press.
McCann, P., 2008, “Globalization and economic geography: the world is curved, not flat”, Cambridge
McCann, P., 2018, “The trade, geography and regional implications of Brexit”, Papers in Regional
Science, 97:3-8.
O’Brien, R., 1992, Global financial integration: the end of geography. New York: Council on Foreign Relations Press.
Pike, A., Rodríguez-Pose, A., and Tomaney, J., 2011, Handbook of Local and Regional Development. New York: Routledge.
Pike, A., Rodríguez-Pose, A., and Tomaney, J., 2017, Local and Regional Development. 2nd Edition, New York: Routledge.
Porter, M., 1990, The Competitive Advantage of Nations, MacMillan, Houndmills.
Rebelo, S., 1991, “Long-Run Policy Analysis and Long-Run Growth”, Journal of Political Economy, 99(3):500-521.
Rodríguez-Pose, A. and Crescenzi, A., 2008, “Mountains in a flat world: why proximity still matters for the location of economic activity”, Cambridge Journal of Regions, Economy and Society, 1(3):371-388.
Rodríguez-Pose, A., 2017, “The revenge of the places that don’t matter (and what to do about it)”,
Cambridge Journal of Regions, Economy and Society, 11(1):189-209.
Romer, P., 1986, “Increasing Returns and Long-run Growth.”, Journal of Political Economy, 94(5):1002–37
Sidrauski, M., 1967, “Rational choices and patterns of growth in a monetary economy”, American
Economic Review, 57:534-544.
Storper, M., 2013, Keys to the City: How Economics, Institutions, Social Interaction, and Politics
Shape Development, Princeton: Princeton University Press.
Tam Cho, W., Gimpel, J. and Hui, I., 2013, “Voter Migration and the Geographic Sorting of the American Electorate”, Annals of the Association of American Geographers, 103(4):856-870.
Tiebout, C., 1956, “A pure theory of local expenditures”, Journal of Political Economy, 64:416-424. Uzawa, H., 1965, “Optimum Technical Change in an Aggregative Model of Economic Growth”,
von Thünen, J., 1826, Der isolierte Staat in Beziehung auf Landwirtschaft und Nationalökonomie. Friedrich Perthes, Hamburg.
1.
Chapter 1: Agglomeration matters for firm solvency
12Daniele Mantegazzi
Abstract
Recent empirical findings show a negative relationship between credit constraints and firm performance, due to asymmetries in information in the financial sector. Moreover, economic theory predicts a positive impact of agglomeration mechanisms on firm performance, generally identified with self-reported information. This paper examines whether agglomeration externalities affect firm solvency, a standardized indicator of firm performance, which helps decreasing asymmetries in information in financial markets and therefore determines firm’s ability to borrow. Moreover, this study overcomes problems of aggregation bias by applying spatial multilevel techniques. The results provide empirical evidence that agglomeration mechanisms shape in different ways firm’s credit accessibility.
JEL classification: C21, O18, R1
Keywords: Agglomeration economies, firm performance, firm solvency, aggregation bias,
spatial multilevel analysis.
1 This chapter is based on Mantegazzi (2016), Agglomeration matters for firm solvency. Presented at the 56th ERSA Congress, Vienna. Submitted to an international journal.
2 The author would like to show his gratitude to Prof. Rico Maggi, Prof. Philip McCann, Prof. Levente Littvay and Dr. Viktor Venhorst who provided valuable insight and expertise. The author would also like to thank Dr. Valentina Mini for her comments and assistance on an earlier version of this study.
1.1 Introduction
Economic theory highlights a positive relationship between firms’ credit accessibility and firm performance. Firms’ ability to obtain credits from banks and financial institutions affects their investment decisions and possibilities (Chen and Guariglia, 2013). Another important body of the economic literature underlines how the economic performance of firms, typically measured with firm productivity or employment growth, is enhanced by the existence of agglomeration economies in the region (McCann, 2001).
The aim of this paper is to link these research streams. In particular, the goal is to empirically study how different typologies of agglomeration economies affect a particular indicator of firm performance, namely firm solvency. This standardized measure determines firms’ ability to borrow. The analysis focuses on whether employment specialization and diversity patterns influence firm solvency. The approach used is not meant to assess or support any mechanism underlying such relationship, it is rather the most direct method of empirically identifying the existence of such relationship.
In addition, this paper contributes to the literature by overcoming problems of aggregation bias in the analysis of agglomeration economies. Empirical studies show ambiguous results in assessing whether and how agglomeration produces positive, null or negative effects in terms of economic performance (Rosenthal and Strange, 2004; Beaudry and Schiffauerova, 2009; De Groot et al., 2015). Recent overviews (Van Oort et al., 2012; De Groot et al., 2015) point out that this ambiguity emerges because traditional analyses are applied either on aggregated data or firm-level data, without simultaneously accounting for the heterogeneity at both levels, creating problems of aggregation bias. This paper overcomes problems of aggregation bias by simultaneously analyzing firm- and regional-level data and applying spatial multilevel techniques.
The study applies this approach to a dataset combining firm- and municipal-level information from the Swiss canton Ticino. The findings highlight that less than 10% of the variance of firm performance is at the aggregated level. This underlines the importance of using firm-level data and implies that studies considering only aggregated data miss more than 90% of the information, likely generating the ambiguity that characterizes the literature. At the same time, researchers also need to account for the heterogeneity across municipalities. The results suggest that specialization externalities positively influence firm solvency, while urbanization externalities have a predicted negative impact on it. Finally, this analysis indicates that including an appropriate specification of spatial interaction allows better representing reality.
The paper is organized as follows: the next section presents a review of the related literature. The third section describes the model and the fourth section presents the database adopted for this research. Section five presents the results and the last section concludes.
1.2 Literature review
According to the economic literature, financial markets are particularly important in enhancing economic growth (Rajan and Zingales, 1998). Following Shumpeter’s (1991) hypothesis, the financial sector reallocates capital to the highest value use, financing investments which strengthen productivity. Yet, theoretical models studying the financial sector assume asymmetries in information and other credit market frictions (Bernanke et al., 1999). Hence, financial market decisions rely on limited information and firms might encounter obstacles in obtaining external credits. Indeed, a recent empirical analysis shows a negative relationship between credit constraints and firm productivity (Ganau, 2016).
Another important branch of economic theory states that the geographical concentration of economic activities generates different cost-saving benefits and productivity advantages which are external to firms and positively impacts their performance (McCann, 2001). The two main typologies of such spillover effects which have been investigated by researchers are specialization (or MAR) economies (Marshall, 1920; Arrow, 1962; Romer, 1986) and urbanization (or Jacobs) externalities (Jacobs, 1969). The main conclusion is that different typologies of agglomeration economies are hypothesized to boost regional growth in different ways. Moreover, traditional analyses on agglomeration externalities focus on their effects on the economic performance of firms, which is generally measured as employment level, employment growth or productivity (for an overview see Beaudry and Schiffauerova, 2009).
The contribution of this research is to combine these two streams of the economic literature by empirically testing whether various typologies of agglomeration spillovers and mechanisms impact a particular indicator of firm performance, namely firm solvency. As better explained in section 1.4, this indicator is not self-reported by firms (as it is often the case with other indicators used in the literature), rather it is computed from an external and standardized perspective and it is used by financial markets in order to reduce the above-mentioned asymmetries in information. Therefore, this measure is important in determining firms ability to borrow. The underlying research question of this study is the following: do agglomeration spillovers impact on firm solvency? As seen above, firms with a higher performance are expected to have a higher accessibility to credits and agglomeration spillovers positively affect the economic performance of firms. Hence, the following hypothesis is specified:
Hypothesis 1: firms located close to other business activities are expected to have a higher solvency, allowing them to have a better access to credit.
This paper also contributes to the literature from a technical perspective. In contrast with the theory, the empirical literature on agglomeration mechanisms is still debating to what extent these effects shape or are shaped by economic geography. Consequently, the empirical results are rather ambiguous in assessing whether and how agglomeration produces positive, null or negative effects (Rosenthal and Strange, 2004; Beaudry and Schiffauerova, 2009; De Groot et al., 2015). Recent overviews (Van Oort et al., 2012; De Groot et al., 2015) indicate that this ambiguity may be due to a lack of research into the relationship between agglomeration externalities and individual firm performance. Traditional analyses are applied either on aggregated data or firm-level data, without simultaneously accounting for the heterogeneity at both levels, causing problems of aggregation bias. Because of problems of aggregation bias, several works offer an incomplete understanding of these effects on the performance of firms, and this may explain the contrast between economic theory and the findings of empirical research. To overcome problems of aggregation bias, researchers need to consider linkages connecting the micro level with the macro one (Jones, 1991). Following Van Oort et al. (2012) and De Groot et al. (2015) it is important to account for the possibility of hierarchies in the data, hence the empirical methodology used in this research simultaneously analyzes firm- and regional-level data and applies spatial multilevel techniques. This leads to the following hypothesis:
Hypothesis 2: Simultaneously analyzing firm- and regional-level data in the analysis of agglomeration mechanisms allows improving empirical reliability.
1.3 Methodology
As already explained, this paper overcomes problems of aggregation bias by simultaneously analyzing firm- and regional-level data. Van Oort et al. (2012) and De Groot et al. (2015) highlight how important it is that the empirical methodology is able to account for the possibility of hierarchies in the data and spatial interactions. Hence, in order to consider both the nested structure of the data and the spatial dependence of regions and firms, this research combines the multilevel literature with spatial econometric techniques.
Corrado and Fingleton (2011) review, from a theoretical point of view, different methodologies to control for spatial spillovers in a hierarchical model. Moreover, Savitz and Raudenbush (2009) and Pierewan and Tampubolon (2014) include the geographical interactions by adding a spatial lag to the error term of the model. The main drawback of this model is that the dependence among neighboring units is left unexplained. This research aims at explaining the spatial relationships by modelling a spatial lag for the explanatory variables at the municipal level. The
underlying idea is that firm performance not only depends on the characteristics of the firm itself and the characteristics of the municipality where the firm is located, but also on the characteristics of the surrounding municipalities. For this reason, this study extends the basic hierarchical model by adding a spatial lag for the characteristics of the municipality. Hence, the spatial multilevel model here proposed is expressed by the following equation.
𝑦𝑖𝑗 = 𝛾00+ ∑ 𝑥𝑘𝑖𝑗𝛾𝑘0 𝐾 𝑘=1 + ∑ 𝑧ℎ𝑗𝛾0ℎ 𝐻 ℎ=1 + ∑ 𝛿0ℎ 𝐻 ℎ=1 ∑ 𝑤𝑙𝑗𝑧ℎ𝑙 𝐽 𝑙=1 + 𝑢0𝑗+ ∑ 𝑥𝑘𝑖𝑗𝑢𝑘𝑗 𝐾 𝑘=1 + 𝜀𝑖𝑗 (1.1)
where 𝑦𝑖𝑗 is the dependent variable, 𝑥𝑘𝑖𝑗 is the 𝑘-th characteristic of firm 𝑖 in region 𝑗, 𝑧ℎ𝑗 is the ℎ-th characteristic of region 𝑗, 𝐾 and 𝐻 are the number of regressors at the firm and municipal level, respectively. In addition, 𝑤𝑖𝑗 is the [𝑖, 𝑗]-th element of the spatial weights matrix 𝑊 and is a (negative) function of the distance between observation 𝑖 and observation 𝑗, with 𝑤𝑖𝑗 = 0 if 𝑖 = 𝑗.3
Finally, 𝜀𝑖 ~ 𝑁(0, 𝜎𝜀2) represents the traditional individual level error term, 𝑢0𝑗 ~ 𝑁(0, 𝜎𝑢0
2 ) is the
variability arising from differences between municipalities, 𝑢𝑘𝑗 is the variance of the impact of the
individual characteristics 𝑥𝑘𝑖𝑗 ~ 𝑁(0, 𝜎𝑢2𝑘) on the dependent variable between municipalities and 𝑛
is the number of observations.
1.4 Data and variables
This research considers firms nested into municipalities, the smallest geo-political unit of the Swiss canton Ticino. These territorial and political units are able to apply different fiscal policies through the level of the municipal tax rate. Additionally, they exhibit some decisional autonomy allowing them to invest in infrastructure projects. These considerations allow hypothesizing that within the same municipality firms face similar socio-economic, political and cultural environments. These reasons justify the choice of using municipalities as second level units.
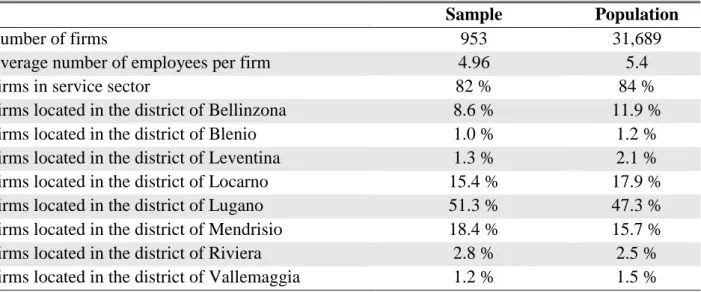
The dataset has been created by merging Swiss official secondary data with firm-level data obtained from Bisnode Dun & Bradstreet Switzerland Ltd. Bisnode D&B is a partner in the worldwide network of Dun & Bradstreet, the largest global service provider for business-to-business commercial information and credit history. The dataset comprises 953 firms from the manufacturing and services industries located in 68 Ticino municipalities. The reference year of this study is 2011. As shown in Table 1.1, the considered sample reasonably represents the 31,689 firms operating in Ticino in 2011.
3 According to Anselin (1988), there exist different definitions of the spatial weights matrix 𝑊. At the and of section 1.4 the specifications used in this study are introduced.
Table 1.1 - Comparison between sample and population of firms in Ticino
Sample Population
Number of firms 953 31,689
Average number of employees per firm 4.96 5.4
Firms in service sector 82 % 84 %
Firms located in the district of Bellinzona 8.6 % 11.9 %
Firms located in the district of Blenio 1.0 % 1.2 %
Firms located in the district of Leventina 1.3 % 2.1 %
Firms located in the district of Locarno 15.4 % 17.9 %
Firms located in the district of Lugano 51.3 % 47.3 %
Firms located in the district of Mendrisio 18.4 % 15.7 %
Firms located in the district of Riviera 2.8 % 2.5 %
Firms located in the district of Vallemaggia 1.2 % 1.5 %
The dependent variable of this study is firm solvency. It is identified with the SCORE indicator provided by Bisnode D&B Switzerland Ltd., ranging between 1 and 100, and indicating the credit rating profile of firms. This variable is computed by analyzing information concerning the payment history, debt collection and recovery information, information regarding operations and management as well as ties to other companies, both foreign and domestic. It is important to notice that this indicator is not self-reported by firms themselves, instead it is externally calculated in a standardized manner. Moreover, Bisnode D&B does not use any measure of agglomeration economies to compute the score indicator, ruling out potential problems of endogeneity. This indicator can also be interpreted as the inverse of the failure risk of the firms and it is used by the financial markets when deciding whether to grant credits to firms, since it allows to decrease the asymmetry of information.
The analysis considers three groups of explanatory variables: establishment-level characteristics, municipal-level information and agglomeration economies indices, varying across both sectors and municipalities. In order to interpret all the estimations on a similar scale, all the continuous independent variables, at both firm and municipal levels, need to be normalized. In particular, following Enders and Tofighi (2007), all the continuous municipal-level variables are standardized around their grand mean and all the continuous firm-level variables around their group mean. This procedure allows the coefficients related to firm-level variables to capture only differences within municipalities, and not between municipalities.
Following the literature on agglomeration economies (Henderson et al., 1995; Combes, 2000; Van Oort et al., 2012 and Mameli et al., 2014), this research focuses the analysis on two typologies of agglomeration economies, both defined at sectoral and municipal levels. MAR (specialization
economies) are computed as the ratio of the employment share of sector 𝑠 in municipality 𝑚 divided by the same ratio at the overall cantonal level4. JACOBS (urbanization economies) are measured with the ratio of the inverse of a Herfindhal index of sectoral concentration of all sectors in municipality 𝑚, except the considered sector 𝑠 divided by the same ratio at the overall cantonal level5. Data on the
total number of employees per sector and municipality are obtained from the Swiss structural business statistic (STATENT), offered by the Swiss Federal Statistical Office (FSO). NOGA 2008 sectoral nomenclature (2-digit code) are used, which aggregates sectors into 32 industrial sectors and 48 service sectors6.
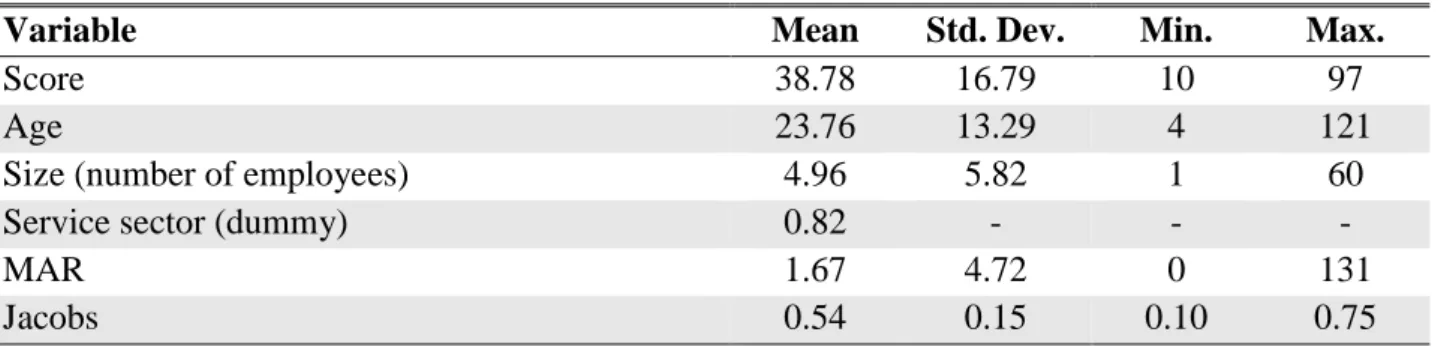
The availability of firm-level data allows controlling for linear and quadratic effects of the AGE of the firms, measured in years (as in Evans, 1987; Raspe and Van Oort, 2011). The underlying idea is that firms learn from their own experience. However, as firms evolve over their life cycle, the marginal effect of this learning process is expected to decline. Additionally, in order to capture the effects related to internal economies of scale and possible size congestion effects, this study also accounts for linear and quadratic effects of the SIZE of the firms, computed as the number of employees of the firms (following Jovanovic, 1982; Evans, 1987; Raspe and Van Oort, 2011). Finally, to distinguish firms in the industrial sector from those working in the service sector, this research includes a dummy variable which takes value 1 if the firm is operating in the SERVICE SECTOR, 0 otherwise (as in McGahan and Porter, 1997 and Van Oort et al., 2012). Data related to firm characteristics are obtained from the Bisnode D&B Switzerland Ltd. dataset. Table 1.2 reports the descriptive statistics related to firm-level variables as well as those relative to the two indicators of agglomeration economies.
Table 1.2 - Descriptive statistics of firm-level indicators and agglomeration economies
Variable Mean Std. Dev. Min. Max.
Score 38.78 16.79 10 97
Age 23.76 13.29 4 121
Size (number of employees) 4.96 5.82 1 60
Service sector (dummy) 0.82 - - -
MAR 1.67 4.72 0 131
Jacobs 0.54 0.15 0.10 0.75
n = 953 firms
4 A value of MAR above 1 implies that in municipality 𝑚 there is a higher employment share in sector 𝑠 than the one registered at the cantonal level. The higher the value of MAR, the higher the specialization in sector 𝑠 in municipality 𝑚. 5 The inverse of the Herfindhal index is maximum when all sectors except the considered sector 𝑠 have the same employment share in municipality 𝑚. Hence, a higher value of JACOBS indicates a high degree of diversification for sector 𝑠 in municipality 𝑚.
6 The NOGA 2008 is modelled after the latest version of the Statistical classification of economic activities in the European Community (NACE, rev. 2).
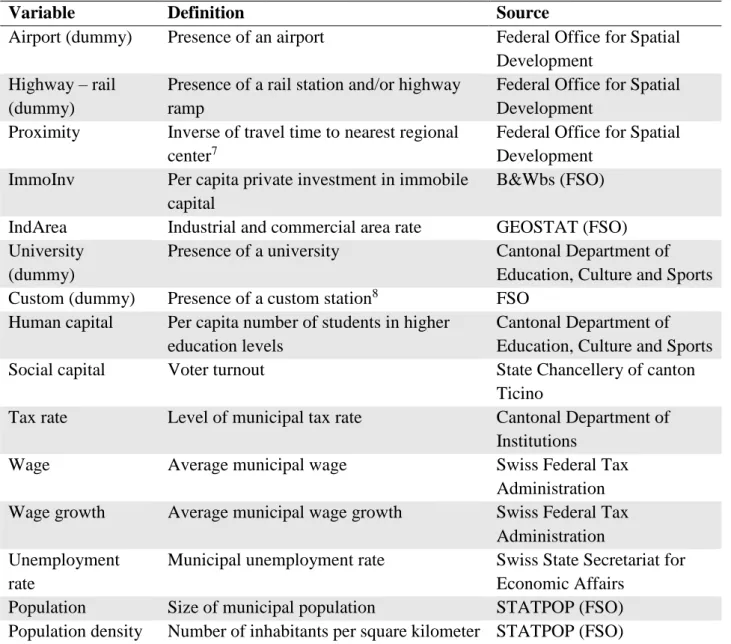
Besides agglomeration economies indices and characteristics at the firm level, in order to prevent problems of omitted-variable bias which might create problems of identification, this study also includes some independent variables at the municipal level, which are listed in Table 1.3, and Table 1.4 shows the related descriptive statistics (following Henderson et al., 1995; Gordon and McCann, 2000; Rosenthal and Strange, 2004; Raspe and Van Oort, 2008, 2011; Schwellnus and Arnold, 2008; Blanchard et al., 2009; De Bok and Van Oort, 2011; Van Oort et al., 2012 and Giovannetti et al., 2013).
Table 1.3 - List of municipal-level variables
Variable Definition Source
Airport (dummy) Presence of an airport Federal Office for Spatial
Development Highway – rail
(dummy)
Presence of a rail station and/or highway ramp
Federal Office for Spatial Development
Proximity Inverse of travel time to nearest regional center7
Federal Office for Spatial Development
ImmoInv Per capita private investment in immobile capital
B&Wbs (FSO)
IndArea Industrial and commercial area rate GEOSTAT (FSO)
University (dummy)
Presence of a university Cantonal Department of
Education, Culture and Sports
Custom (dummy) Presence of a custom station8 FSO
Human capital Per capita number of students in higher education levels
Cantonal Department of Education, Culture and Sports
Social capital Voter turnout State Chancellery of canton
Ticino
Tax rate Level of municipal tax rate Cantonal Department of
Institutions
Wage Average municipal wage Swiss Federal Tax
Administration
Wage growth Average municipal wage growth Swiss Federal Tax
Administration Unemployment
rate
Municipal unemployment rate Swiss State Secretariat for Economic Affairs
Population Size of municipal population STATPOP (FSO)
Population density Number of inhabitants per square kilometer STATPOP (FSO)
7 In canton Ticino there are 5 regional centers: Bellinzona, Chiasso, Locarno, Lugano and Mendrisio.
8 The literature generally uses a dummy taking value 1 if the region shares a border with another nation. However, this would skew the results because some municipalities might share a border with another nation, but there might not be any infrastructure connecting the municipality with the neighboring nation. Hence, measuring the presence of a customs station better captures the possibility of accounting for potential spillover coming from another nation.
Table 1.4 - Descriptive statistics of municipal-level indicators
Variable Mean Std. Dev. Min. Max.
Airport (dummy) 0.02 - - -
Highway – rail (dummy) 0.47 - - -
Proximity 0.18 0.24 0.03 1 ImmoInv 1.38 2.66 0 13.60 IndArea 9.06 7.75 0 29.36 University (dummy) 0.07 - - - Custom (dummy) 0.16 - - - Human capital 1.88 0.48 0.79 2.92 Social capital 60.43 6.86 45.72 73.30 Tax rate 81.91 11.87 53 100 Wage 72’156 9’959 55’171 111’894 Wage growth -0.67 5.24 -22.15 6.72 Unemployment rate 2.82 0.97 1.07 5.69 Population 4’139 7’004 479 55’151 Population density 892 1’267 8 8’063 n = 68 municipalities
A synthesis of municipal indicators
Analyzing the distribution of the municipal characteristics previously introduced shows that these variables are spatially associated. Therefore, this research performs an exploratory factor analysis in order to identify the underlying independent structure at the municipal level. Before carrying out the analysis, all the continuous variables have been standardized.
As a first step this study selects the number of factors to obtain. When five unobserved variables are identified, only four of these factors have eigenvalues greater than one, while the fifth is below. Following Kaiser (1960), only factors having eigenvalues greater than one are considered, hence four underlying independent and unobserved variables are identified. To further support this choice, the factor analysis with four factors records the lowest BIC value. In order to maximize the explained variance, the exploratory factor analysis is performed with VARIMAX-rotation.
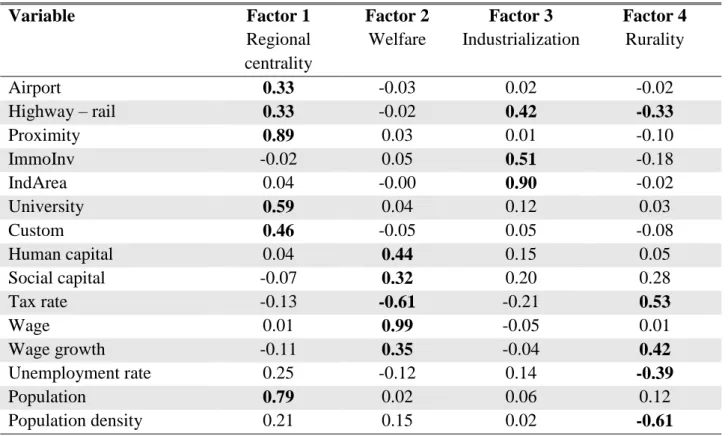
Table 1.5 shows the results of the exploratory factor analysis, reporting for each observed variable the corresponding loadings indicating the correlation between these indicators and the unobserved four factors. Values in bold indicate the loading of the variables which are combined together in the resulting four factors.
Table 1.5 - Factor scores at the municipal level
Variable Factor 1 Factor 2 Factor 3 Factor 4
Regional centrality
Welfare Industrialization Rurality
Airport 0.33 -0.03 0.02 -0.02 Highway – rail 0.33 -0.02 0.42 -0.33 Proximity 0.89 0.03 0.01 -0.10 ImmoInv -0.02 0.05 0.51 -0.18 IndArea 0.04 -0.00 0.90 -0.02 University 0.59 0.04 0.12 0.03 Custom 0.46 -0.05 0.05 -0.08 Human capital 0.04 0.44 0.15 0.05 Social capital -0.07 0.32 0.20 0.28 Tax rate -0.13 -0.61 -0.21 0.53 Wage 0.01 0.99 -0.05 0.01 Wage growth -0.11 0.35 -0.04 0.42 Unemployment rate 0.25 -0.12 0.14 -0.39 Population 0.79 0.02 0.06 0.12 Population density 0.21 0.15 0.02 -0.61
The first factor shows high scores on the degree of proximity to a regional center, the level of population, the presence of a university as well as the existence of a rail station and/or a highway ramp, an airport and a customs station. These characteristics and infrastructures are typical of the main regional centers of canton Ticino, hence, this factor is identified as being a measure of the “regional centrality” of each municipality.
Factor 2 combines different dimensions of the level of wellbeing. Particularly, it records high scores in locations with high average levels of human capital, social capital, wages and the growth rate of wages. Moreover, this factor is negatively related to high levels of tax rate, which usually indicate municipalities with low levels of financial health. Therefore, this factor can be identified as being a measure of the average level of “welfare” for each location.
The factor labelled “industrialization” shows high values on the ratio of industrial and commercial area divided by the total settlement and urban area, the amount of private investment in immobile capital goods (excluding houses) per capita and the presence of a rail station and/or a highway ramp. Hence, locations with high scores on this factor can be interpreted as being characterized by an environment allowing the industrial and commercial sectors to be particularly active.
Finally, the fourth factor is positively related to high levels of tax rate and the average growth rate of wages. Additionally, it negatively depends on high levels of population density, unemployment rate and the presence of a rail station and/or a highway ramp. Municipalities recording high scores on this factor can be interpreted as being locations with low levels of infrastructure and not densely populated. Therefore, this factor is identified as a measure of “rurality” for each municipality.
The scale of the spatial interactions
There exist different specifications of the spatial dependence matrix, 𝑊. Savitz and Raudenbush (2009) and Pierewan and Tampubolon (2014) use as the spatial dependence matrix, 𝑊, a contiguity matrix with entry 𝑤𝑖𝑗 = 1 if region 𝑖 and region 𝑗 share at least one border, 0 otherwise.
This approach restricts spatial interactions. In order to account for the spatial dependence among municipalities in a more realistic way, this research considers a spatial weight matrix based on the inverse travel times between the centroids of the municipalities9.
Moreover, the geographical area which this research analyses is characterized by a relatively high number of municipalities with rather small territorial extensions. This indicates that, on average, the distance between the different municipalities is comparably low. Therefore, the spatial interactions of canton Ticino are expected to be on a higher scale than the one considered with a contiguity spatial dependence matrix. For these reasons, considering the entire scale of the spatial interactions gives a more realistic representation.
Spatial econometricians (Anselin, 1988; Kelejian and Prucha, 1998; LeSage and Pace, 2009) usually standardize the 𝑊 matrix, such that each row sums to unity. This allows interpreting any matrix product involving 𝑊 as a weighted average of a certain variable observed in all locations.
1.5 Results
Besides finding the impact of agglomeration economies on firm solvency, this analysis has three empirical goals and is based on the comparison among eight models. First, this study aims to show the importance of the heterogeneity at both firm and regional levels. Second, various specifications of a spatial lag are introduced and this study identifies the one best representing reality. In particular, different models adding a spatial lag to the error term and/or the municipal independent
9 Travel time data are provided by the Federal Office for Spatial Development and consider the trip by car in minutes. The municipalities are based on the 2000 definition of the Swiss Federal Office for Statistics. The distances that involve municipalities which were geographically different in 2012 from the official definition of 2000 - because of
aggregations or newly created municipalities - are computed by weight averaging the distances based on the 2000 definition and their population.
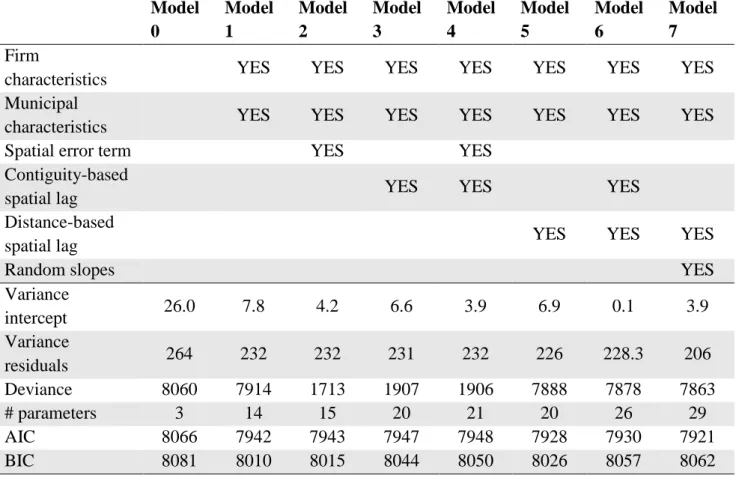
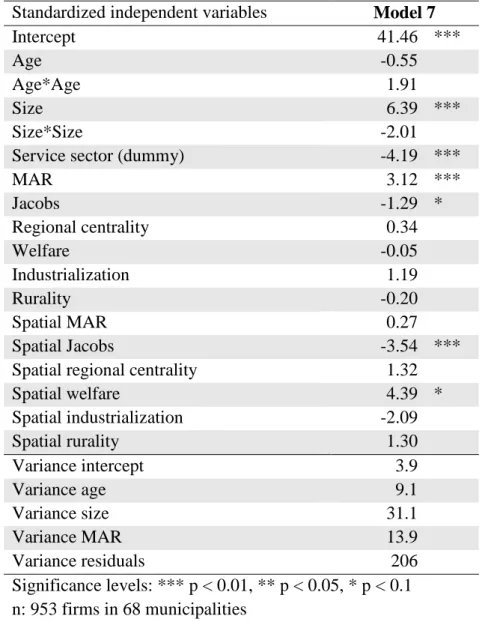
variables are compared. Moreover, this research also distinguishes between contiguity- and distance-based spatial lags. The goal is not to get involved in a theoretical or methodological debate, rather the aim is simply to empirically examine which extension of the spatial spillovers better represent reality. The results indicate that spatial effects among municipalities occur in Ticino and take place within the entire cantonal territory (distance-based spatial lag added to the independent variables). The third goal is to highlight the fact that researchers need to account for spatial slope effects, in order to capture cross-municipality differences in the effects of some firm characteristics. This section starts by focusing on the comparison between the fit of the different models in order to identify the one best capturing reality. Once this model has been identified, the analysis proceeds by interpreting the estimates and the results, particularly focusing on the effects of agglomeration externalities.
Table 1.6 - Model fit comparison
Model 0 Model 1 Model 2 Model 3 Model 4 Model 5 Model 6 Model 7 Firm
characteristics YES YES YES YES YES YES YES
Municipal
characteristics YES YES YES YES YES YES YES
Spatial error term YES YES
Contiguity-based
spatial lag YES YES YES
Distance-based
spatial lag YES YES YES
Random slopes YES
Variance intercept 26.0 7.8 4.2 6.6 3.9 6.9 0.1 3.9 Variance residuals 264 232 232 231 232 226 228.3 206 Deviance 8060 7914 1713 1907 1906 7888 7878 7863 # parameters 3 14 15 20 21 20 26 29 AIC 8066 7942 7943 7947 7948 7928 7930 7921 BIC 8081 8010 8015 8044 8050 8026 8057 8062 n: 953 firms in 68 municipalities
In the first model (Model 0), as reported in Table 1.6, the dependent variable is regressed on a random intercept without including any regressors. Hence, the intercept can vary randomly across municipalities, allowing distinguishing the between-municipality variance of firm performance from its between-firm variance. In particular, it is possible to compute the interclass correlation coefficient (ICC), measuring the ratio of variance in the dependent variable which is accounted for by
municipalities (Luke, 2004). The ICC of Model 0 indicates that 8.96% of the total variance is cross-municipality variance. The result highlights that less than 10% of the variance among firms is at the aggregated level. This underlines the importance of using firm-level data and implies that studies considering only aggregated data miss more than 90% of the information, generating the ambiguity that indeed characterizes the literature.
The next step of this study is to explain this variance by including the explanatory variables at both firm and municipal levels, without yet considering any spatial interactions. As indicated in column 2 of Table 1.6, the variance at the municipal level decreases from 26.0 to 7.8. Additionally, by comparing10 the baseline model (Model 0) with the one considering characteristics at both firm and regional levels, without any spatial interactions (Model 1), indicates that the baseline model provides a significantly worse fit (𝜒2 = 146.4, df = 11, p ≤ 0.001). This result highlights that it is also important to account for the heterogeneity at the municipal level in order to decrease the unexplained cross-municipality variance of firm performance.
Subsequently, the model without any spatial interactions (Model 1) is compared with the model including a spatial lag in the error term (Model 2) and with the one allowing spatial interactions to occur among contiguous municipalities (Model 3). In both cases it is not possible to asses that the model without spatial interactions is significantly worse (𝜒2 = 1.3, df = 1, p = 0.26; 𝜒2 = 6.6, df = 6, p = 0.36, respectively). Additionally, Model 4 shows that after inserting the spatial lag to the independent variables at the municipal level, as already done in Model 3, adding a spatial lag to the error term does not allow significantly better capturing the interactions among neighboring units. In fact, the model fit provided by Model 1 is not significantly worse than that of Model 4 (𝜒2 = 7.7, df = 7, p = 0.36). For this reason, the analysis continues by considering a spatial lag added only to the independent variables and considers a different specification of spatial interactions. Particularly, Models 2, 3 and 4 are based on a contiguity spatial dependence matrix. However, canton Ticino is expected to exhibit spatial relationships on a higher scale than the one considered in the previous models. For these reasons, Models 5, 6, 7 and 8 consider a spatial weights matrix based on the inverse travel times between the centroids of the municipalities.
In Model 5 spatial interactions occur within the entire cantonal territory. Comparing its ability to fit the data with that of Model 1, the findings suggest that considering this more precise specification of the relationships among municipalities is preferable (𝜒2 = 25.4, df = 6, p ≤ 0.001).
10 It is possible to compare two multilevel models if one is nested within the other one. In particular, the difference in the deviances of the two models is chi-squared distributed with degrees of freedom equal to the difference of the number of estimated parameters (Luke, 2004).