SCIENTIFIC ARTICLE
Evaluation of a prototype correction algorithm to reduce metal
artefacts in flat detector computed tomography of scaphoid
fixation screws
Lukas Filli&Magda Marcon&Bernhard Scholz& Maurizio Calcagni&Tim Finkenstädt&
Gustav Andreisek&Roman Guggenberger
Received: 26 April 2014 / Revised: 2 July 2014 / Accepted: 7 August 2014 / Published online: 28 August 2014 # ISS 2014
Abstract
Objectives The aim of this study was to evaluate a prototype correction algorithm to reduce metal artefacts in flat detector computed tomography (FDCT) of scaphoid fixation screws. FDCT has gained interest in imaging small anatomic structures of the appendicular skeleton. Angiographic C-arm systems with flat detectors allow fluoroscopy and FDCT imaging in a one-stop procedure emphasizing their role as an ideal intraop-erative imaging tool. However, FDCT imaging can be signifi-cantly impaired by artefacts induced by fixation screws.
Materials and methods Following ethical board approval, commercially available scaphoid fixation screws were inserted into six cadaveric specimens in order to fix artificially induced scaphoid fractures. FDCT images corrected with the algorithm were compared to uncorrected images both quanti-tatively and qualiquanti-tatively by two independent radiologists in terms of artefacts, screw contour, fracture line visibility, bone visibility, and soft tissue definition. Normal distribution of variables was evaluated using the Kolmogorov–Smirnov test. In case of normal distribution, quantitative variables were compared using paired Student's t tests. The Wilcoxon signed-rank test was used for quantitative variables without normal distribution and all qualitative variables. A p value of < 0.05 was considered to indicate statisti-cally significant differences.
Results Metal artefacts were significantly reduced by the cor-rection algorithm (p<0.001), and the fracture line was more clearly defined (p < 0.01). The inter-observer reliability was “almost perfect” (intra-class correlation coefficient 0.85, p < 0.001).
Conclusions The prototype correction algorithm in FDCT for metal artefacts induced by scaphoid fixation screws may facilitate intra- and postoperative follow-up imaging. Key Points
• Flat detector computed tomography (FDCT) is a helpful imaging tool for scaphoid fixation.
• The correction algorithm significantly reduces artefacts in FDCT induced by scaphoid fixation screws.
• This may facilitate intra- and postoperative follow-up imaging.
Keywords Tomography scanners, X-ray computed . Scaphoid bone . Fracture fixation, internal . Artefacts . Algorithms
L. Filli (*)
:
M. Marcon:
T. Finkenstädt:
G. Andreisek:
R. GuggenbergerDepartment of Diagnostic and Interventional Radiology, University Hospital of Zurich, Ramistrasse 100, 8091 Zurich, Switzerland e-mail: [email protected] M. Marcon e-mail: [email protected] T. Finkenstädt e-mail: [email protected] G. Andreisek e-mail: [email protected] R. Guggenberger e-mail: [email protected] M. Marcon
Institute of Diagnostic Radiology, Department of Medical and Biological Sciences, University of Udine, 33100 Udine, Italy B. Scholz
Siemens AG, Healthcare Sector, Imaging & Therapy Division, H IM AX IN, Siemensstr. 1, 91301 Forchheim, Germany
e-mail: [email protected] M. Calcagni
Division of Plastic Surgery and Hand Surgery, University Hospital of Zurich, Ramistrasse 100, 8091 Zurich, Switzerland
Abbreviations
FDCT Flat detector computed tomography
HU Hounsfield units
ICC Intra-class correlation coefficient
kV Kilovolts
mAs Milliampere-seconds
MDCT Multi-detector computed tomography
ROI Region of interest
Introduction
Internal fixation screws for treatment of scaphoid fractures have been shown to reduce fracture-associated complications, such as non-union or osteonecrosis [1,2]. Early detection of postoperative complications, including delayed bone healing, infection, or screw loosening, is crucial but can be challenging [3].
Multi-detector computed tomography (MDCT) is often used to detect complications after scaphoid screw fixation. Its advantages include high spatial resolution and the possi-bility of multi-planar reformation [4–6]. Recently, due to its inherent higher spatial resolution, flat detector computed to-mography (FDCT) has gained interest as an alternative to MDCT in imaging small anatomic structures of the appendic-ular skeleton such as the wrist [7–9]. In addition, angiographic C-arm systems are equipped with flat detectors and allow fluoroscopy and FDCT imaging in a one-stop procedure em-phasizing their role as an ideal intraoperative imaging tool, for example for internal fixation of scaphoid fractures. The FDCT technique may allow radiologists and/or trauma surgeons to directly verify fragment adaptation and hardware position intra-operatively.
However, similar to MDCT, metal-induced artefacts are an issue in FDCT because photon starvation and X-ray beam hardening may impair image quality and depiction of pathol-ogies adjacent to the orthopedic hardware [10]. In the case of scaphoid fixation screws, these artefacts may impair radiolog-ical evaluation of the screw contour, fracture line, nearby bone trabeculae, and soft tissue.
In order to overcome metal-induced artefacts in MDCT, numerous algorithms and techniques have been proposed [11–19]. Unfortunately, they cannot simply be implemented into FDCT due to fundamental differences in imaging proto-cols and image reconstruction. Therefore, current research focuses on the development of new metal artefact reduction algorithms dedicated to FDCT and their validation in clinical routine [10,20,21].
The aim of this study was to evaluate a new prototype correction algorithm to reduce metal artefacts in FDCT of scaphoid fixation screws. The hypothesis was that the algo-rithm would significantly reduce artefacts, thereby improving
the depiction of the screw contour, fracture line, nearby bone trabeculae, and soft tissue, which is important in the interpre-tation of postoperative scaphoid bone images.
Materials and methods Specimens and scaphoid screws
According to local regulations and laws, no ethical approval was required for this post-mortem study on six cadaveric specimens, which had been voluntarily donated to the institute of anatomy of our university. Each specimen (four right-sided, two left-sided) consisted of an upper extremity conserved in a dedicated Thiel solution allowing flexible conservation of soft tissues. None of the donators, whose personal data (name, age, gender) were blinded, had a history of fracture or surgical procedure of the upper extremity.
One senior hand surgeon (MC) with 15 years of clinical experience artificially induced complete scaphoid waist frac-tures in all six specimens and then inserted three different types of headless and cannulated titanium-based fixation screws. Each screw type was used in two specimens, respec-tively. Length and leading thread diameter of the three screw types were 20/2.0 mm (Martin Corp., Jacksonville, FL, USA), 26/2.2 mm (Medartis Corp., Basel, Switzerland), and 26/ 3.0 mm (Synthes Corp., West Chester, PA, USA), respectively.
Image acquisition
All images were acquired in June 2013 using an angiographic unit with a C-arm flat detector (Artis Zeego, Siemens Healthcare, Forchheim, Germany). Detector dimensions were 38 × 30 cm2 with a physical pixel size of 154 × 154 μm2 (effective pixel size of 308×308 μm2at 2×2 binning). By means of localizer images at 0° and 90° azimuth, the cadaveric specimens were positioned such that the scaphoid screw lay in the isocenter of the scan field and with the long axis 45° perpendicular to the XY-plane of the scanner, representing physiological hand position in clinical routine and allowing standardized artefact measurement at the same time.
CT scans of each specimen were performed using two different clinically approved sequences (5 s with 133 projec-tions and 20 seconds with 496 projecprojec-tions, respectively, with a rotation angle of 200° each; dose-area product: 267.3 and 960.4 mGy × cm2, respectively). All CT scans were obtained with a tube voltage of 70 kV, an automatically determined tube current ranging from 29 to 66 mAs, and a focus size of 0.6 mm without zoom factor.
Image post-processing and metal artefact correction algorithm Image post-processing was performed in July/August 2013 on a dedicated workstation (Syngo Leonardo, VE40A; Siemens Healthcare, Erlangen, Germany). Raw data were reconstruct-ed with standardizreconstruct-ed parameters (field of view at the center of rotation, 38×38×32 mm3; matrix, 512×512×431 isotropic voxels; resulting voxel edge length, 70μm) and a high con-volution bone kernel. The vendor provided a new prototype algorithm for metal artefact reduction, which was applied to generate“corrected” images out of the “uncorrected” initial images.
The algorithm applied, which is part of a broader package for metal artefact reduction in C-arm FDCT images, consists
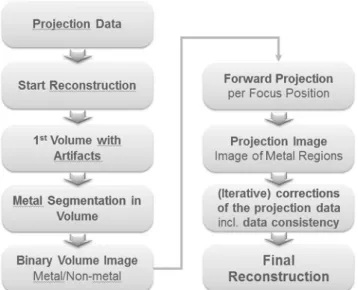
of the following steps: an initial reconstruction yielding a volume with artefacts, i.e., an uncorrected volume, next the correction of the projection data affected by metal, and then a final reconstruction using the corrected data. The correction itself consists of the segmentation of the metal object in the uncorrected volume, which leads to a binary volume, where a voxel value of one indicates metal, and zero non-metal. This binary volume is used to compute the metal shadow in each projection image. Thus, in each image the region affected by rays having passed through metal is determined. The data of this region are responsible for the artefacts, and therefore they have to be replaced. This is done by a non-linear interpolation procedure using the boundary data of the metal region as input. The corrected projection images are then used for the final reconstruction (Fig.1). The entire process is based on a semiautomatic approach and takes about 2–5 min, depending on the hardware used.
Quantitative and qualitative assessment
All images were loaded to the 3D-viewing card of the Syngo workstation for further evaluation. Prior to image evaluation, the visual contrast was standardized for optimal interpretation of screw and bone structures (level, 3,000 Hounsfield units (HU); window, 11,000 HU). Images were assessed quantita-tively and qualitaquantita-tively. Quantitative assessment was per-formed by one reader measuring the artefact-related noise, defined as standard deviation of HU, in standardized rectan-gular regions of interest (ROIs) on MPRs parallel to the longest diameter of screws. ROIs were placed as follows: two ROIs at the proximal thread (width, 1 mm; length, 3 mm), two at the level of the shaft (width, 1 mm; length, 5 mm), and two around the leading thread (width, 1 mm; length, 5 mm) (Fig.1). Different steps of the prototype algorithm for metal artefact reduction. First, the metal object (scaphoid fixation screw) is segmented, which leads to a binary volume,
Fig. 1 Different steps of the prototype algorithm for metal artefact reduction. First, the metal object (scaphoid fixation screw) is segmented, which leads to a binary volume, where a voxel value of one indicates metal, and zero non-metal. Next, the metal shadow is computed in each projection image. The data in regions affected by artefacts are replaced based on a non-linear interpolation procedure
Table 1 Quantitative measurements of different parameters on corrected and uncorrected images acquired with 5-s and 20-s sequences, respec-tively. Mean and standard deviation values result from the noise
measurements around all six scaphoid screws. HU Hounsfield units; SD standard deviation; IQR inter-quartile range
5 s 5-s corrected 20 s 20-s corrected Noise around screw [HU], mean ± SD Proximal thread 782.3±81.7 407.2±74.0 764.5±90.8 396.9±36.4
shaft 692.5±152.6 434.3±48.9 552.2±117.2 383.2±49.6 Leading thread 750.9±77.0 524.1±67.3 676.9±130.6 428.7±57.5 mean 741.9±52.6 455.2±52.6 664.5±57.2 402.9±19.8 Screw diameter [mm], median (IQR) Proximal thread 3.4 (3.3–3.5) 3.4 (3.3–3.7) 3.4 (3.1–3.6) 3.6 (3.4–3.7) Lunate density [HU], mean ± SD 635.6±168.8 633.7±198.0 590.2±223.2 576.7±244.9 Lunate, noise [HU], mean ± SD 400.8±47.4 347.2±59.2 368.3±52.2 310.9±59.9 Thenar, density [HU], mean ± SD 74.5±34.9 67.3±49.6 120.7±76.3 111.6±68.0 Thenar, noise [HU], mean ± SD 267.4±75.7 246.2±66.1 160.2±22.1 141.1±20.4 Air, noise [HU], mean ± SD 154.1±44.2 151.6±42.4 108.4±22.9 100.7±21.9
where a voxel value of one indicates metal, and zero non-metal. Next, the metal shadow is computed in each projection image. The data in regions affected by artefacts are replaced based on a non-linear interpolation procedure.
Furthermore, standardized ROIs were measured in the lunate bone, in the thenar muscles, and in the air surrounding the cadaveric specimen (circular, 6 mm2each). Additionally, the proximal screw thread diameter was measured on all images.
Qualitative assessment was performed on multi-planar reconstructed images in random order by two indepen-dent radiologists (R1 and R2, 2 and 5 years of experi-ence in musculoskeletal imaging) who were blinded to the acquisition protocol and correction algorithm. Both readers judged the amount of artefacts using a four-point Likert scale (1, poor image quality and/or exten-sive artefacts; 2, markedly compromised image quality and/or marked artefacts; 3, good image quality and/or few artefacts; 4, excellent image quality and/or no arte-facts). Furthermore, a four-point grading system was used for the evaluation of the screw contour, fracture line, bone visibility, and soft tissue definition (1, poor definition and/or very irregular screw margins; 2, re-duced definition and/or markedly irregular margins; 3, good definition and/or slightly irregular margins; 4, clear definition and/or smooth margins). Bone visibility was defined as definition of spongiotic trabeculae. Soft tissue definition was defined as the definition of borders between fat and muscle tissue. Figure 3 illustrates the quantitative and qualitative assessment.
Statistical analysis
Statistical analysis was performed using commercially available software (IBM SPSS Statistics, version 19, IBM Corp., Somers, NY, USA). Normal distribution of
variables was evaluated using the Kolmogorov–Smirnov test. In case of normal distribution, quantitative vari-ables were compared using paired t tests. The Wilcoxon signed-rank test was used for quantitative variables without normal distribution (e.g., screw diam-eter) and all qualitative variables (e.g., four-point Likert scale for amount of artefacts on corrected vs. uncorrect-ed images). For all tests, a p value of < 0.05 was con-sidered to indicate statistically significant differences. For the evaluation of the inter-observer agreement in qualitative analysis, intra-class correlation coefficient (ICC) was calculated. According to Landis and Koch [22], the ICC was interpreted as follows: poor (≤0.20),
fair (0.21–0.40), moderate (0.41–0.60), good (0.61– 0.80), and almost perfect (0.81–1.00).
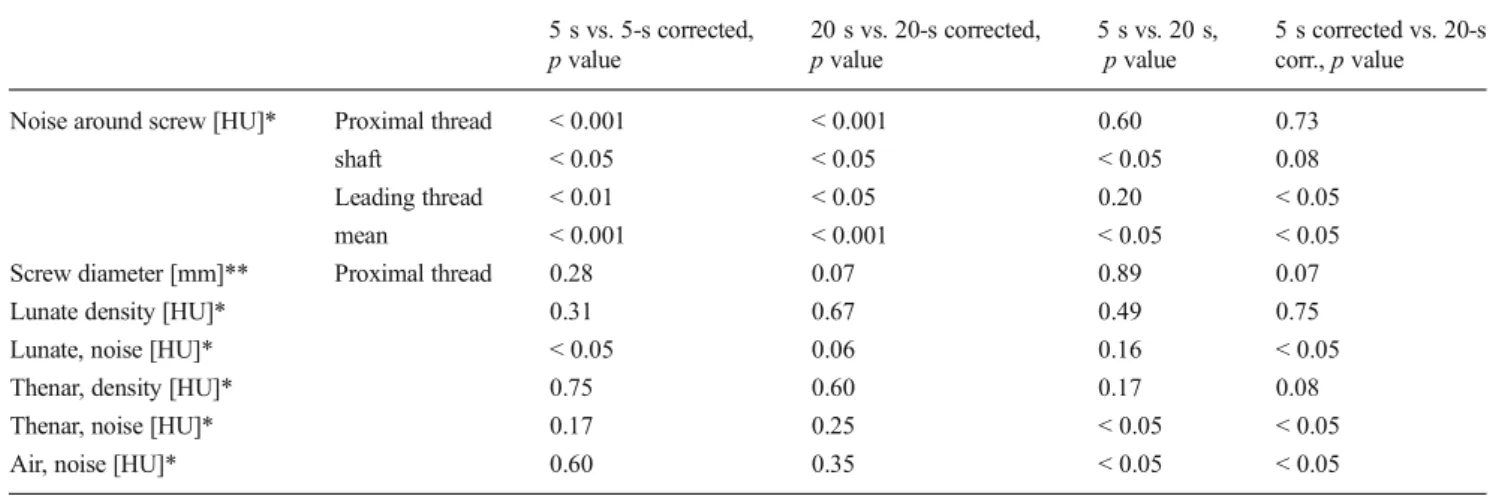
Table 2 Statistical significance of comparisons between quantitative measurements on corrected and uncorrected images acquired with 5-s and 20-s sequences, respectively. HU Hounsfield units; * paired t test; ** Wilcoxon signed-rank test
5 s vs. 5-s corrected, p value 20 s vs. 20-s corrected, p value 5 s vs. 20 s, p value 5 s corrected vs. 20-s corr., p value Noise around screw [HU]* Proximal thread < 0.001 < 0.001 0.60 0.73
shaft < 0.05 < 0.05 < 0.05 0.08 Leading thread < 0.01 < 0.05 0.20 < 0.05 mean < 0.001 < 0.001 < 0.05 < 0.05 Screw diameter [mm]** Proximal thread 0.28 0.07 0.89 0.07 Lunate density [HU]* 0.31 0.67 0.49 0.75 Lunate, noise [HU]* < 0.05 0.06 0.16 < 0.05 Thenar, density [HU]* 0.75 0.60 0.17 0.08 Thenar, noise [HU]* 0.17 0.25 < 0.05 < 0.05 Air, noise [HU]* 0.60 0.35 < 0.05 < 0.05
Fig. 2 Boxplots illustrating the mean artefact-related noise measured on both corrected and uncorrected images with an acquisition time of 5-s and 20-s sequences, respectively. The artefact-related noise was defined as the standard deviation of Hounsfield units (HU) within standardized regions of interest around the screws. y-axis, Hounsfield units; ***p<0.001
Results
Quantitative analysis
Descriptive data and statistical analyses are presented in Tables1and2. The artefact-related noise around the scaphoid fixation screws was significantly lower on the images corrected with the new artefact reduction algorithm in both the 5-s and 20-s sequences (p<0.001) (Fig.2). The respective noise measured in the lunate, thenar muscles, and air tended to be reduced by the algorithm; however, the differences were not always statistically significant (Fig.3).
The 20-s sequence showed significantly lower noise com-pared with the 5-s sequence on both uncorrected and corrected images around the screw, in the lunate (except for the uncor-rected images), in the thenar muscles, and in the air measured
at the edge of the display field of view (p<0.05 each). No significant difference was found in screw diameter measure-ments among the four different sequences.
Qualitative analysis
Descriptive data and statistical analysis of qualitative evalua-tion are listed in Tables3and4. On images corrected with the metal artefact algorithm, artefacts were significantly fewer (p<0.001), the screw contour was better visible (p<0.001), and the fracture line was more clearly defined (p<0.01) com-pared to the uncorrected images (Fig.4). The definition of the fracture line was significantly better on 20-s sequences com-pared to 5-s sequences on both corrected and uncorrected images (p<0.05). Furthermore, bone visibility and soft tissue definition were rated superior on 20-s images (uncorrected
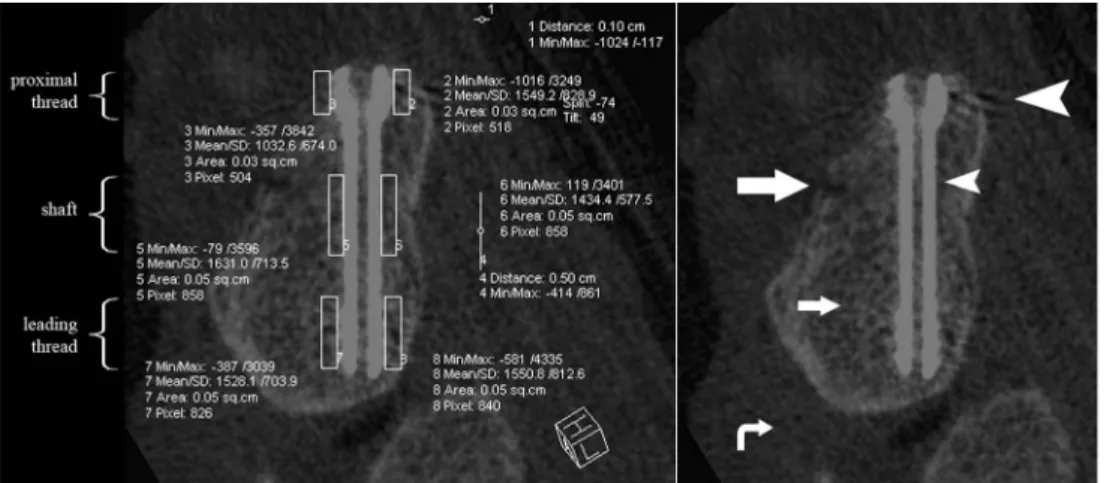
Fig. 3 Example of quantitative and qualitative assessment of different parameters around the same scaphoid fixation screw on flat detector CT images not corrected with the algorithm. Left: Quantitative measurement of artefact-related noise in standardized regions of interest (ROIs) around the proximal thread, shaft, and leading thread of the scaphoid fixation
screw. Right: Qualitative assessment included artefacts (large arrowhead), screw contour (small arrowhead), fracture line (large arrow), bone visibility (small arrow), and soft tissue definition (curved arrow)
Table 3 Qualitative analysis of different parameters on uncorrected and corrected images acquired with 5-s and 20-s sequences, respectively, performed by two independent readers. ICC intra-class correlation coef-ficient; IQR inter-quartile range; R1 reader one; R2 reader two. * rating: 1,
extensive artefacts; 2, marked artefacts; 3, few artefacts; 4, no artefacts. ** rating: 1, poor definition and/or very irregular screw margins; 2, reduced definition and/or markedly irregular margins; 3, good definition and/or slightly irregular margins; 4, clear definition and/or smooth margins
5 s 5-s corrected 20 s 20-s corrected ICC
R1 R2 R1 R2 R1 R2 R1 R2 Artefacts [median, IQR]* 2.0 (1.25–2.0) 2.0 (1.25–2.0) 3.0 (3.0–4.0) 4.0 (3.25–4.0) 2.0 (2.0–2.0) 2.0 (2.0–2.0) 3.0 (3.0–4.0) 4.0 (3.0–4.0) 0.88 (p<0.001) Screw contour [median, IQR]** 2.0 (1.25–2.0) 2.0 (2.0–2.0) 3.5 (3.0–4.0) 4.0 (3.25–4.0) 2.0 (2.0–2.0) 2.0 (2.0–2.75) 3.0 (3.0–3.75) 4.0 (3.0–4.0) 0.85 (p<0.001) Fracture line [median, IQR]** 1.5 (1.0–2.0) 1.0 (1.0–2.0) 2.0 (2.0–3.0) 2.0 (2.0–2.75) 2.0 (2.0–2.75) 2.0 (2.0–2.0) 3.0 (3.0–3.0) 3.0 (2.0–3.0) 0.82 (p<0.001) Bone visibility [median, IQR]** 2.0 (1.25–2.0) 2.0 (1.0–2.0) 2.0 (2.0–2.0) 2.0 (2.0–3.0) 2.5 (2.0–3.0) 2.5 (2.0–3.0) 3.0 (2.0–3.0) 3.0 (2.0–3.0) 0.76 (p<0.001) Soft tissue definition
[median, IQR]**
images: p<0.01; corrected images: p<0.05). An“almost per-fect” inter-observer reliability was indicated by an overall ICC of 0.85 (range, 0.76–0.88, p<0.001).
Discussion
Artefacts in CT induced by scaphoid fixation screws may substantially impair early detection of postoperative compli-cations, such as delayed bone healing, infection, or screw loosening [3]. The relatively new FDCT technique has been shown to be superior to MDCT in the imaging of small anatomic structures of the appendicular skeleton [7, 9]. Additionally, due to its full fluoroscopic versatility, mobile
C-arm FDCT facilitates direct intra- and postoperative verifi-cation of screw position and fragment adaptation. Modern angiographic units and hybrid operation rooms are hence increasingly often equipped with FDCT technology, as this allows full intraoperative 3D imaging with high spatial reso-lution at generally low radiation dose [8, 23, 24]. Current research focuses on the development of metal artefact reduc-tion algorithms dedicated to FDCT [10,20,21]. This study is the first to present a prototype correction algorithm for arte-facts in FDCT induced by metal hardware in the appendicular skeleton, i.e., scaphoid fixation screws.
The initial images, on which no correction algorithm was applied, showed severe streak artefacts, particularly affecting the screw contour and the fracture line. This may hamper direct intraoperative verification of hardware location and
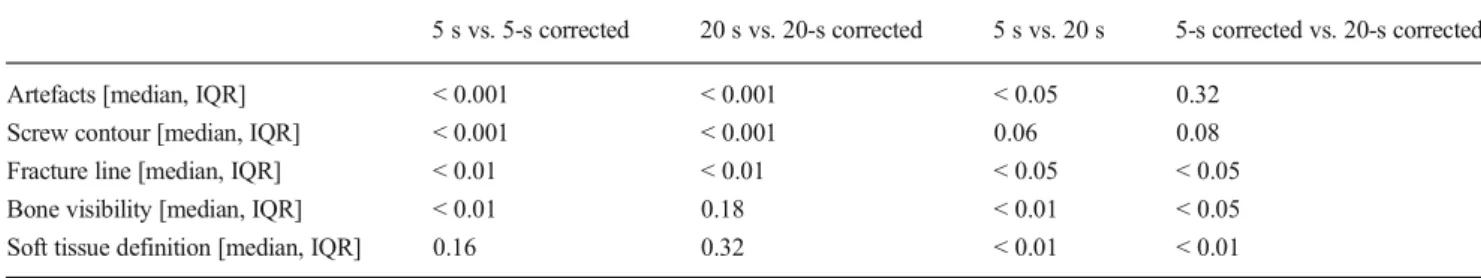
Table 4 Statistical significance of comparisons between qualitative measurements on corrected and uncorrected images acquired with 5-s and 20-s sequences, respectively. IQR inter-quartile range. All tests were performed using the Wilcoxon signed-rank test
5 s vs. 5-s corrected 20 s vs. 20-s corrected 5 s vs. 20 s 5-s corrected vs. 20-s corrected Artefacts [median, IQR] < 0.001 < 0.001 < 0.05 0.32
Screw contour [median, IQR] < 0.001 < 0.001 0.06 0.08 Fracture line [median, IQR] < 0.01 < 0.01 < 0.05 < 0.05 Bone visibility [median, IQR] < 0.01 0.18 < 0.01 < 0.05 Soft tissue definition [median, IQR] 0.16 0.32 < 0.01 < 0.01
Fig. 4 Multi-planar reformations of images of the same scaphoid screw with different acquisition times and with or without application of the correction algorithm (from left to right: 5-s uncorrected, 5-s corrected, 20-s uncorrected, 20-s corrected). Images are oriented parallel and orthogonal to the screw as well as axial to the scanner position (“true axial”). Window and level are 11,000 and 3,000 Hounsfield units (HU), respectively. The two images on the bottom show the difference between the corrected and uncorrected images in the 5-s and 20-s sequences, respectively, and illustrate the amount of artefacts removed by the algorithm
fracture adaption, one of the main advantages of mobile C-arm FDCT in musculoskeletal surgery. The new metal artefact correction algorithm, however, proved effective in artefact reduction and significantly improved depiction of the nearby structures of interest.
Most metal artefact reduction algorithms have their inher-ent limitations and may produce other artefacts [11]. However, we did not observe any negative effects caused by the algo-rithm that would have impaired image interpretation.
Soft tissue definition was rated rather poor in qual-itative assessment. These findings are in agreement with former observations that FDCT is mainly valuable for imaging of high-contrast structures (i.e., bones, iodinated contrast) [9, 25].
Compared to the 5-s sequences, the 20-s sequences (with more projections and higher radiation dose) showed a signif-icantly lower noise, and most qualitative variables were rated superior over the 5-s sequences. These findings are in accor-dance with former results from Guggenberger et al. [26]. On the 5-s sequence images, the mean density was measured around 50 HU higher in the lunate and around 50 HU lower in the thenar muscle compared to the 20-s sequence. Due to a high standard deviation in both groups, this difference was not statistically significant. Nevertheless, this result remains re-markable and indicates poor reliability of density measure-ment depending on different radiation doses.
No significant difference was found between uncorrected and corrected images in terms of densities, which means that the metal artefact correction algorithm did not alter densities, but only the noise. This characteristic is crucial for reliable interpretation of postoperative follow-up images.
There are limitations to this study. First, this is an ex vivo study design. No volunteers or patients were included, mainly for ethical reasons which obviate scanning of study subjects using a non-certified imaging technique. However, the spec-imens were conserved in a dedicated Thiel solution maintain-ing the integrity of soft tissue compartments, and physiolog-ical hand position was ensured. Second, although the two readers were entirely blinded to image parameters, the differ-ences between corrected and uncorrected images often were obvious so that, with increasing experience, the readers could recognize whether the algorithm had been applied or not. This may have influenced the qualitative scoring but not the quantitative measurement. Third, this algorithm has shown to work well with small-sized ortho-pedic hardware, i.e., scaphoid fixation screws. Larger and large-sized hardware need to be tested in the future. Fourth, the sample size of this study was rather small, owing to the complex preparation of the specimens; in the future, other studies with larger study samples may be necessary to confirm our findings.
In conclusion, our results suggest that the prototype cor-rection algorithm in FDCT for metal artefacts induced by
scaphoid fixation screws may facilitate intra- and postopera-tive follow-up imaging.
Disclosures One author (BS) is an employee of the vendor of the prototype algorithm, but had no influence on the measurements and results of this study. The other authors had full control of the data and declare no conflict of interest.
References
1. Sendher R, Ladd AL. The scaphoid. Orthop Clin North Am. 2013;44(1):107–20. doi:10.1016/j.ocl.2012.09.003.
2. Oduwole KO, Cichy B, Dillon JP, Wilson J, O’Beirne J. Acutrak versus Herbert screw fixation for scaphoid non-union and delayed union. J Orthop Surg (Hong Kong). 2012;20(1):61–5.
3. Gutow AP. Percutaneous fixation of scaphoid fractures. J Am Acad Orthop Surg. 2007;15(8):474–85.
4. Temple CL, Ross DC, Bennett JD, Garvin GJ, King GJ, Faber KJ. Comparison of sagittal computed tomography and plain film radiog-raphy in a scaphoid fracture model. J Hand Surg. 2005;30(3):534–42. doi:10.1016/j.jhsa.2005.01.001.
5. Lozano-Calderon S, Blazar P, Zurakowski D, Lee SG, Ring D. Diagnosis of scaphoid fracture displacement with radiography and computed tomography. J Bone Joint Surg Am Volume. 2006;88(12): 2695–703. doi:10.2106/JBJS.E.01211.
6. Smith M, Bain GI, Turner PC, Watts AC. Review of imaging of scaphoid fractures. ANZ J Surg. 2010;80(1–2):82–90. doi:10.1111/j. 1445-2197.2009.05204.x.
7. Kalender WA, Kyriakou Y. Flat-detector computed tomography (FD-CT). Eur Radiol. 2007;17(11):2767–79. doi: 10.1007/s00330-007-0651-9.
8. Kyriakou Y, Richter G, Dorfler A, Kalender WA. Neuroradiologic applications with routine C-arm flat panel detector CT: evaluation of patient dose measurements. AJNR Am J Neuroradiol. 2008;29(10): 1930–6. doi:10.3174/ajnr.A1237.
9. Gupta R, Cheung AC, Bartling SH, et al. Flat-panel volume CT: fundamental principles, technology, and applications. Radiographics. 2008;28(7):2009–22. doi:10.1148/rg.287085004.
10. Prell D, Kyriakou Y, Beister M, Kalender WA. A novel forward projection-based metal artifact reduction method for flat-detector computed tomography. Phys Med Biol. 2009;54(21):6575–91. doi:
10.1088/0031-9155/54/21/009.
11. Liu PT, Pavlicek WP, Peter MB, Spangehl MJ, Roberts CC, Paden RG. Metal artifact reduction image reconstruction algorithm for CT of implanted metal orthopedic devices: a work in progress. Skeletal Radiol. 2009;38(8):797–802. doi:10.1007/s00256-008-0630-5. 12. Mahnken AH, Raupach R, Wildberger JE, et al. A new algorithm for
metal artifact reduction in computed tomography: in vitro and in vivo evaluation after total hip replacement. Investig Radiol. 2003;38(12): 769–75. doi:10.1097/01.rli.0000086495.96457.54.
13. Guggenberger R, Winklhofer S, Osterhoff G, et al. Metallic artefact reduction with monoenergetic dual-energy CT: systematic ex vivo evaluation of posterior spinal fusion implants from various vendors and different spine levels. Eur Radiol. 2012;22(11):2357–64. doi:10. 1007/s00330-012-2501-7.
14. Wang G, Frei T, Vannier MW. Fast iterative algorithm for metal artifact reduction in X-ray CT. Acad Radiol. 2000;7(8):607–14. 15. Bal M, Spies L. Metal artifact reduction in CT using tissue-class
modeling and adaptive prefiltering. Med Phys. 2006;33(8):2852–9. 16. Lemmens C, Faul D, Nuyts J. Suppression of metal artifacts in CT
completion. IEEE Trans Med Imaging. 2009;28(2):250–60. doi:10. 1109/TMI.2008.929103.
17. Meyer E, Raupach R, Lell M, Schmidt B, Kachelriess M. Frequency split metal artifact reduction (FSMAR) in comput-ed tomography. Mcomput-ed Phys. 2012;39(4):1904–16. doi:10.1118/ 1.3691902.
18. Wang G, Snyder DL, O’Sullivan JA, Vannier MW. Iterative deblurring for CT metal artifact reduction. IEEE Trans Med Imaging. 1996;15(5):657–64. doi:10.1109/42.538943.
19. Zhang X, Wang J, Xing L. Metal artifact reduction in x-ray computed tomography (CT) by constrained optimization. Med Phys. 2011;38(2):701–11.
20. Prell D, Kalender WA, Kyriakou Y. Development, implementation and evaluation of a dedicated metal artefact reduction method for interventional flat-detector CT. Brit J Radiol. 2010;83(996):1052–62. doi:10.1259/bjr/19113084.
21. Buhk JH, Groth M, Sehner S, Fiehler J, Schmidt NO, Grzyska U. Application of a Novel Metal Artifact Correction Algorithm in Flat-Panel CT After Coil Embolization of Brain Aneurysms: Intraindividual Comparison. RoFo : Fortschritte auf dem Gebiete
der Rontgenstrahlen und der Nuklearmedizin. 2013;185(9):824–9. doi:10.1055/s-0033-1350117.
22. Landis JR, Koch GG. The measurement of observer agreement for categorical data. Biometrics. 1977;33(1):159–74.
23. Suzuki S, Furui S, Yamaguchi I, et al. Entrance surface dose during three-dimensional imaging with a flat-panel detector angiography system. J Vasc Interv Radiol : JVIR. 2008;19(9):1361–5. doi:10. 1016/j.jvir.2008.05.020.
24. Chida K, Inaba Y, Saito H, et al. Radiation dose of interventional radiology system using a flat-panel detector. AJR Am J Roentgenol. 2009;193(6):1680–5. doi:10.2214/AJR.09.2747.
25. Guggenberger R, Morsbach F, Alkadhi H, et al. C-arm flat-panel CT arthrography of the wrist and elbow: first experiences in human cadavers. Skeletal Radiol. 2013;42(3):419–29. doi: 10.1007/s00256-012-1501-7.
26. Guggenberger R, Winklhofer S, Spiczak JV, Andreisek G, Alkadhi H. In vitro high-resolution flat-panel computed tomographic arthrography for artificial cartilage defect detection: comparison with multidetector computed tomography. Investig Radiol. 2013;48(8): 614–21. doi:10.1097/RLI.0b013e318289fa78.