HAL Id: hal-01469783
https://hal-enac.archives-ouvertes.fr/hal-01469783
Submitted on 25 Jul 2017
HAL is a multi-disciplinary open access
archive for the deposit and dissemination of
sci-entific research documents, whether they are
pub-lished or not. The documents may come from
teaching and research institutions in France or
abroad, or from public or private research centers.
L’archive ouverte pluridisciplinaire HAL, est
destinée au dépôt et à la diffusion de documents
scientifiques de niveau recherche, publiés ou non,
émanant des établissements d’enseignement et de
recherche français ou étrangers, des laboratoires
publics ou privés.
Interactive exploration of 3D scanned baggage
Michael Traoré Sompagnimdi, Christophe Hurter
To cite this version:
Michael Traoré Sompagnimdi, Christophe Hurter. Interactive exploration of 3D scanned baggage .
IEEE Computer Graphics and Applications, Institute of Electrical and Electronics Engineers, 2017,
37 (1), pp.27-33. �10.1109/MCG.2017.10�. �hal-01469783�
Interactive Exploration of 3D Scanned Baggage
Michael Traor ´e, and Christophe Hurter
Abstract— In this paper, we present an interactive visualization system to support volumetric data exploration. While most existing
systems use a combination of Direct Volume Rendering (DVR) technique and its corresponding Transfer Function (TF), we considered alternative interaction techniques to explore such datasets. This paper is a user study where we investigated the specific activity of baggage inspection. We run contextual inquiries in an airport to better understand baggage exploration. From these investigations, we used a user centered design process to extract working scenarios. Thanks to brainstorming and participatory design process, we mock-up many working prototypes. We validated and aggregated them into a working system. Final users were involved into the full design process and thus also validated the final tools. In our system, we provide a set of interaction techniques which combine the direct manipulation of the voxels and their interactive visualization. Our contributions rely on providing new interaction paradigms and new volumetric dataset manipulations.
Index Terms— Focus + Context Techniques, Data Transformation and Representation, Pixel-oriented Techniques, Human-Computer
Interaction, Design Studies, Volume Visualization, Airport Security
1 INTRODUCTION
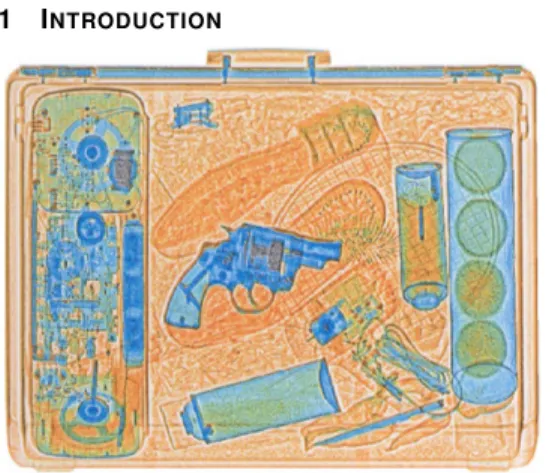
Fig. 1. X-ray scan with the 3 standard colors (orange, green, and blue). The orange color is used for low density materials. The blue color is used for high density items . The green color corresponds to either the superposition of different kinds of materials or average density materials.
Volumetric data are found in many fields, such as engineering, ma-terial sciences, medical imaging, astrophysics. Their exploration is not trivial, and heavily impacted by the users’ needs. In most air-ports, security agents deal with such data exploration during baggage inspections. They use two types of fluoroscopic systems: X-ray and tomography scanning systems. X-ray system provides a flattened 2D baggage scan while tomography scanning system produces transversal scans, also called slices. Thanks to data processing (e.g. Radon trans-form [1]), they can produce a full 3D scan (set of voxel with their corresponding density). Our input data is a uniformly sampled multi-variate field F : V −→ D, V ⊂ Rn,D ⊂ Rmwith n = 3 (volume) m=1 (a scalar), where V is a subset of space (x,y,z coordinates) and D the data attributes (the density).
Since the resulting X-ray scanned image only contains densities, it cannot display the material original colors. The standard color visual mapping uses 3 different colors (orange, green, and blue) to display the data density. Orange color corresponds to low density (mainly organic items). In opposition, blue color is used for high density items
• Michael Traor´e is with ENAC. E-mail: [email protected]. • Christophe Hurter is with ENAC. E-mail: [email protected].
(e.g. metal). In the case of X-ray systems, green color corresponds to the superposition of different kinds of materials or average density materials (Figure 1 ). The displayed 2D scanned image can suffer from four issues.
Superposition: A threat (e.g. prohibited object like knife, cut-ter. . . ) may be sheltered behind dense materials. Sometimes, it’s possible to see through these blind shield using some functionalities such as high penetration (enhanced X-ray power) or image processing (contrast improvement).
Location: Depending on its location inside the luggage, a threat can be difficult to detect. Objects located in the corners, in the edges or inside the luggage’s frame are very difficult to identify.
Dissociation: Another way to dissimulate a threat is to separate and to spread parts of it in the luggage (weapon or explosive are composed of many separated items like the trigger, the cannon...). This dissocia-tion can be combined with other dissimuladissocia-tion techniques.
Lure: An ill-intentioned individual may use a lure to hide the real threat. For instance, a minor threat like a small scissors may be clearly visible and catch security agent’s attention while a more important threat remains hidden.
3D baggage scan exploration are one potential solution of such lim-itations. Few systems investigated this activity domain with interactive volumetric exploration tools [2]. Even if extensive works have been done in medical 3D scan exploration and manipulation [3], there is a great opportunity to adapt and develop new interaction and data ma-nipulation techniques to support 3D baggage exploration.
We performed on site observations with contextual inquiry (one day observation in one of the major French airport). We also conducted one brainstorming with four security practitioners from which we de-fined relevant use cases. Thanks to these analysis, we extracted a set of top level needs and requirements :
• VIS: users need to visualize the content of the luggage.
• EXP: users have to explore the baggage with interactive naviga-tion system.
• OCL: the system must provide tools to address occlusion issues; the superposition of items inside the luggage hinders their visualiza-tion.
• INT: User need to explore luggage with simple interactions. User knowledge is too limited regarding volumetric data processing to un-derstand the involved techniques and their parameters.
This paper uses Image-Based Visualization techniques [4] applied to interactive visualization of volumetric datasets.
2 TOPLEVELSTRUCTURE
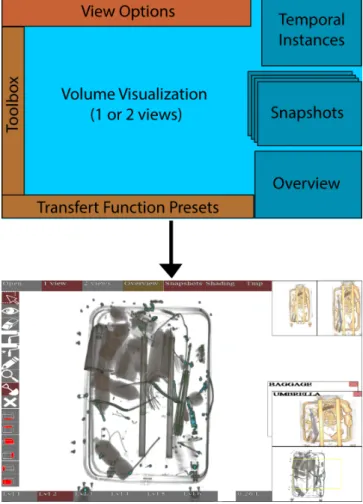
Our system is composed of one main view (Volume Visualization) and 5 sub views to control and customize it. Our interactive system does not provide menu and every feature is directly accessible from this
Fig. 2. Top level layout and screenshot of our Graphical User Interface. All the features are available throught this GUI
main view (Figure 2). The Volume Visualization can contain up to two views to ease interactions with the 3D scan. These views display the baggage and one can navigate through it (zoom, pan, rotation), manipulate its content (brushing, selection, deletion). These two views can be linked or disconnected in order to inspect selected objects with or without their context. A smaller view called Overview shows the location of the investigated area. The overview is one-eighth the size of the main window and is located at its bottom right.
Temporal Instances window, located in the top right of the inter-face, shows the current and the previous settings of the Volume Visu-alization. The current setting is modified when the user changes the transfer function or manipulates an object. The Snapshot shows saved instances with their setting (pan, zoom, rotation, transfer function, se-lection, brushing). The Toolbox contains every interactive tools to ex-plore the baggage (brushing, selection, eraser, density picker, naviga-tion tools). Transfer Funcnaviga-tion presets contains six predefined settings ordered by their filtering power. Low level shows every density, high level only show high density values. This global layout can be cus-tomized thanks to View Options. One can display one or two views of the Volume Visualization, the Temporal Instances, the Snapshot and the Overview.
3 INTERACTION TECHNIQUES
We used a multi touchscreen Wacom 24HD equipped with a stylus. Most of the developed interactions can be performed with every avail-able modality: mouse, hand or pen.
3.1 Transfer function edition
Datasets such as two dimensional raster images or three dimensional voxel based representations are often processed for representation
us-ing a transfer function (TF) defined by a curve.
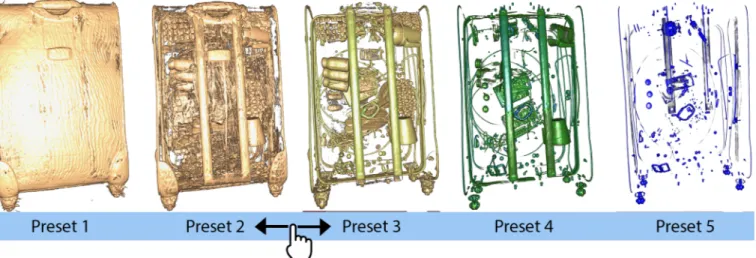
Since airport security agents have a reduced time frame and limited knowledge of technical constraints, we defined six TF presets (Fig-ure 3). These presets only modify the TF transparency curve while keeping the same color mapping. These presets are ordered by their density filtering power: the first preset displays every density and the last one only highest density of the volume (i.e. metal).
When clicking on a preset, the TF changes with a short transition (1 second) toward a new one. Finally, the user can select a transfer function located between two presets. To do so, the user drags from any location within the TF presets area until the volume visualization shows interesting features
3.2 Objects selection and investigation
In order to investigate in detail a specific object, one can isolate it, remove surrounding items to address occlusion issues, or find a suit-able point of view (Figure 4). This section details these interaction techniques which encompass the selection of many objects.
3.2.1 Selection of an object
We developed three different ways to select objects with the three dif-ferent modalities: hand, mouse or pen. When using his or her hand, the user has to double tap the desired object with his or her finger. When using the pen, the user must press the biggest button on the sty-lus while pointing at the target. Otherwise, the user has to double click on the target with the mouse pointer. After the target is selected, our system tries to find a better point of view to display the selected ob-ject with the minimum of occluded parts. The details of this algorithm will be explained in the technical part of this paper. We use a smooth transition to rotate and zoom the baggage.
If the user has activated the 2 views Volume Visualization (Button 2 views in the View Option panel), the selected object is isolated in the second view (on the right side of the main view Figure 5 ). The selec-tion is incremental and many object can be selected one after another. To undo the selection, the user has to select the desired object in the second view .
3.2.2 Occlusion management
In order to address occlusion issues, the eraser tool can interactively re-move selected objects from one view to the other one. This interaction is similar to the selection interaction with all the modalities (mouse, hand, and pen). When using his or her hand, the user has to double tap the desired object with his or her finger. When using the pen, the user must press the biggest button on the stylus while pointing at the target. The user can also double click on the target with the mouse pointer. To restore a deleted object from one view, the user has to erase it from the other view. This simple principle guarantees that every item of the baggage is always visible while addressing occlusion issues (Figure 6).
3.3 Extended Brushing techniques
Baggage is composed of low density items (e.g. fabrics, clothes, pa-pers, organic objects. . . ) and high density ones (e.g. metal, electronic components. . . ). Low density items are more numerous and surround high density ones. In order to perceive a metallic object, one needs to remove or hide its surrounding low density items thanks to an ad-equate TF. Since TF is applicable to the whole volume visualization, the visualization of a metallic bottle will prevent to visualize its con-tent (i.e. organic density). One cannot find out whether the metallic bottle is empty or not (Figure 7). To solve this problem, we developed two brushing techniques to explore the baggage by the mean of local removal of specific densities without modifying the TF.
3.3.1 Range Based brushing technique
This interaction removes all voxels which are bounded in a user de-fined range. A range-slider is available on top of the transfer function (Figure 8). The user enables the brush tool in the toolbox by clicking on it and then the right button of the mouse removes the voxels be-neath the mouse pointer. Original brushing technique removes every voxel which is bounded in a density range and which is beneath the
Fig. 3. Transfer function presets and their continuous interaction. The high density materials are revealed by dragging from left to right on the presets
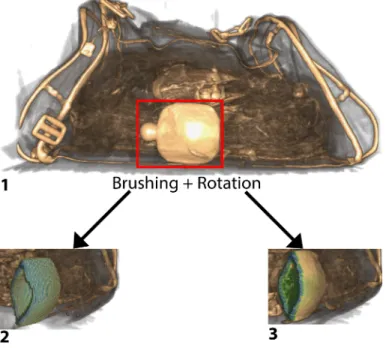
Fig. 4. Inspection of an object from different perspectives. 1- The user defines an object of interest for further inspection. This object is then inside a box with red borders. 2- The user modifies the transfer function to see the target in another context. 3- The user rotates the baggage to look at the menace from a different perspective. It stays visible whatever the manipulation carried out.
Fig. 5. Selection of an umbrella for further inspection. 1- The user wants to check an object looking like an umbrella. 2- After a double click, the object is selected and becomes gray as a feedback. 3- After the activation of the 2nd view, the user can manipulate the umbrella with or without the whole baggage. All the Selected items are also available on this second view.
Fig. 6. Addressing occlusion issue by removing objects from one view to another one. 1- The user wants to remove the bars of the baggage. 2-After a double click with the deletion tool, the object is removed from the main view. 3- After the activation of the 2nd view, the removed objects are visible outside the baggage.
Fig. 7. Brushing a bottle to see its content. 1- The initial baggage before brushing. 2- The result after using the old brushing technique: the content of the bottle has been removed too. 3- The result after using the new brushing technique: the content of the bottle is still visible. This brushing technique removes until it encounters an object out of the selected density range.
Fig. 8. Brushing low density materials to see a metallic object hidden inside the baggage. 1- The baggage before brushing. 2- After a den-sity range is defined, the users brushes a part of the baggage. This interaction reveals a metallic bottle.
mouse pointer. In case of the exploration of a metallic bottle full of liquid, original brushing technique will remove the surrounding of the bottle as well as its content. To address this issue we developed a new brushing technique as if one digs into a baggage. This digging process will stop when a dense layer is encountered. This dense layer (e.g. the outer layer of a metallic bottle) will act as a shield to protect voxels located behind it (Figure 7).
3.3.2 Magic brushing technique
This brushing technique has almost the same behavior as the range based brushing one. The main difference consist in the automatic range definition. This magic brushing removes all voxels with a lower density than the first one encountered at the beginning of the brushing process. This technique helps the user to directly define the densities he or she wants to brush. This technique avoid multiple interactions with the histogram and its range slider to define the range of brushable densities.
3.3.3 The cancellation of the brushing
Our system offers the possibility to restore previously brushed areas. To do so, the user must select the brushing tool in the toolbox and hold the shift key while brushing over a given area. The restored densities are those defined by the histogram range slider. This restoring pro-cessing does not act as the range brushing technique and the sheltering effect (dense layer provides to brush behind it). Every voxels within the range are restored in order not to confuse the user.
3.4 Snapshot
Our system can store visual configurations thanks to snapshots. These snapshots are displayed on the right of the main view and record the
current rotation, the zoom, the pan and the current transfer function. To take a snapshot, the user must press the space bar. A name can be given to any snapshot using the keyboard. This name is displayed on the top left of its thumbnail. The user can restore a saved object by clicking on its snapshot. When a snapshot is selected, the system animates the view from its current state to the selected snapshot (pan, zoom and transfer function linear interpolation). A snapshot can be deleted by clicking on the close icon located on its top right.
3.5 Dual temporal instance navigation
Our system provides many animated transitions when the user ex-plores the baggage (change of point of view, transfer function mod-ification, item selection...) [5]. To ease user’s navigation, we added two temporal instances representing the states before and after an au-tomatic modification of the visual configuration. This interaction is based on the undo-redo paradigm. On the top right of the main win-dow, we added two views representing the previous state before the transition and the final one after the transition. One can navigate through this transition by dragging from one state toward the other one. The more the cursor gets close to the center of a state, the more the current view gets close to its configuration. The user can also click on the desired state to directly assign its visual configuration.
4 TECHNICALCONSTRAINTS ANDIMPLEMENTATION
Tomographs generate files which contain all the densities encountered by the x-rays through the baggage. These files usually contains around 30 million values. To load and to display such dataset in an interactive system, we used the parallel computation power of the graphic card. We used a program written in C# combined with the CUDA parallel computing platform and a set of GPGPU techniques. To display the dataset, we used a standard ray casting algorithm. The contributions of you work rely on new interactions and their associated algorithms. This section will detail their implementations.
4.1 Object selection
Our software features interactive selection and voxel manipulation functionalities. To implement these interactions, we had to find a way to extract objects from the volume data. To do so, we explored many object detection algorithms such as contour trees [6] and branch trees [7] algorithms. But, according to the literature and our experience, these algorithms are computationally expensive and time-consuming especially during the preprocessing steps. In addition, this algorithm needs many settings and modifications to process the variety of avail-able possible items which compose a baggage. For these reasons, we developed our own selection algorithm. It is based on a simple brute force multi-threads propagation algorithm. The first step consists in casting a single ray toward the volume data where the selection need to start (we stop its progression as soon as it hits a visible voxel,). Second, we propagate the selection in every directions. For each en-countered voxel, we check whether it’s visible according to the current transfer function . If the voxel is visible we go on with the selection propagation. We spread within the baggage by launching many threads starting from the location where the first visible voxel has been hit. The number of thread depends on the number of logical processors in-side the current hardware. Each thread checks whether its neighbors are visible, and keep spreading towards the visible voxels. This prop-agation algorithm stops whenever there aren’t any more visible voxels to spread into.
4.2 Occlusion minimization
Once the item of interest is selected, our system animates the visual configuration to display a new point of view of the selection which minimizes object occlusions. To do so, the system first computes the selection bounding box composed of six faces. Then, the system com-putes the six possible point of views. For each of them, the system counts the number of visible pixels which display the selected ob-ject. This is done thanks to the ray casting algorithm which propa-gates though the data cube and thus can test if the ray hits the selected
items without any occlusion. Finally, the system defines the appropri-ate point of view as the bounding box face with the highest number of visible pixels of the selected item. The system can then animate the volume visualization toward this new visual configuration and up-date the two temporal instances (before and after the pan, zoom and rotation modifications).
4.3 Extended brushing technique
The extended brushing techniques help the user explore the volume without modifying the transfer function. This interaction is also based on the ray casting algorithm. We only cast the rays located inside the radius of the brush in a parallel way. When a ray hits a visible voxel whose density is within the brushing range, this voxel is then removed. If the voxel density is not in the brushing range, the ray casting algo-rithm stops. The cancellation of the brushing is quite similar to the previous algorithm. The rays start from the back of the volume toward the front instead of front-to-back. The second difference consists in restoring the voxels whose density is inside the range.
5 DISCUSSION ANDCONCLUSION
Since we developed this system with four baggage security practition-ers, we had the opportunity to validate the usefulness of each de-veloped technique. Through an interactive process, the users gave their feedbacks all along the development process which helped to assess and to guide the proposed interaction techniques. Feedback was mainly positive and the user did not face any specific difficulty to use our system. Users mainly appreciated the simple interface with few widgets and the reduced set of interactions. Surprisingly, users were very interested to use the transfer function. The histogram and its transfer function were also appreciated even if the corresponding technique is not simple to understand. We suppose that our interface motivates users to learn more regarding the technique behind it. Users also mentioned the need to display the actual density (the numerical value) of selected object. They also ask many times if the displayed color corresponds to the one currently in use in operational settings. This confirms the fact that users are willing to keep some existing fea-tures and prefer to use a system they are already familiar with. The users also appreciated our design requirements with smooth transitions and incremental investigations of baggage.
All of these observations and qualitative evaluations deserve to be validated through proper evaluations which are out of the scope of this design study paper. Our system is fully functional and interactive enough to perform baggage explorations. Many improvements can still be done in order to improve its usages in terms of new interac-tions and exploration time reducinterac-tions. Technically speaking, the se-lection of the adequate point of view can be improved with more than 6 investigated faces. But in practice, this simple paradigm remains suitable. If the computed point of view is not fully satisfactory, one can manual rotate the baggage. Nevertheless, the developed algorithm will not necessary provide the best solution (the lowest occlusion) but a satisfactory one.
Our goal was to develop innovative interactions to support baggage exploration but we did not really took into account the optimization of the exploration duration time. Manipulating the 3D volume may take time as well as our new interaction techniques. We think that these techniques have a great potential but they are suitable to explore in more details a suspicious baggage. Existing investigation techniques (with the 2D flattened image) are suitable to quickly and efficiently de-tect “clean” baggage. Then our tools can be a good solution to further investigate a potential threat with more available time.
6 ACKNOWLEDGEMENTS
This work was supported by the TERANoVA project ANR JCJC 2014 (Agence Nationale de la Recherche, Jeunes Chercheuses Jeunes Chercheurs).
REFERENCES
[1] S. R. Deans, The Radon Transform and Some of Its Applications. Courier Corporation.
[2] W. Li, G. Paladini, L. Grady, T. Kohlberger, V. K. Singh, and C. Bahlmann, “Luggage visualization and virtual unpacking,” in Proceedings of the Workshop at SIGGRAPH Asia, WASA ’12, (New York, NY, USA), pp. 161–168, ACM, 2012.
[3] B. Preim and C. P. Botha, Visual Computing for Medicine: Theory, Algo-rithms, and Applications. Newnes, 2013.
[4] C. Hurter, Image-Based Visualization: Interactive Multidimensional Data Exploration. Morgan & Claypool Publishers.
[5] B. Tversky, J. B. Morrison, and M. Betrancourt, “Animation: Can it facili-tate?,” vol. 57, no. 4, pp. 247–262.
[6] H. Carr, J. Snoeyink, and U. Axen, “Computing contour trees in all dimen-sions,” in Proceedings of the Eleventh Annual ACM-SIAM Symposium on Discrete Algorithms, SODA ’00, pp. 918–926, Society for Industrial and Applied Mathematics.
[7] V. Pascucci, K. Cole-McLaughlin, and G. Scorzelli, “Multi-resolution computation and presentation of contour trees,” pp. 452–290.
![Application of hybrid Computational Fluid Dynamics turbulence model, STRUCT-[epsilon], on heated flow cases](data:image/gif;base64,R0lGODlhAQABAIAAAP///wAAACH5BAEAAAAALAAAAAABAAEAAAICRAEAOw==)