Publisher’s version / Version de l'éditeur:
Journal of Cellular Plastics, pp. 313-319, 1977-09
READ THESE TERMS AND CONDITIONS CAREFULLY BEFORE USING THIS WEBSITE. https://nrc-publications.canada.ca/eng/copyright
Vous avez des questions? Nous pouvons vous aider. Pour communiquer directement avec un auteur, consultez la première page de la revue dans laquelle son article a été publié afin de trouver ses coordonnées. Si vous n’arrivez pas à les repérer, communiquez avec nous à [email protected].
Questions? Contact the NRC Publications Archive team at
[email protected]. If you wish to email the authors directly, please see the first page of the publication for their contact information.
NRC Publications Archive
Archives des publications du CNRC
This publication could be one of several versions: author’s original, accepted manuscript or the publisher’s version. / La version de cette publication peut être l’une des suivantes : la version prépublication de l’auteur, la version acceptée du manuscrit ou la version de l’éditeur.
Access and use of this website and the material on it are subject to the Terms and Conditions set forth at
Moisture gains by foam plastic roof insulations under controlled
temperature gradients
Hedlin, C. P.
https://publications-cnrc.canada.ca/fra/droits
L’accès à ce site Web et l’utilisation de son contenu sont assujettis aux conditions présentées dans le site LISEZ CES CONDITIONS ATTENTIVEMENT AVANT D’UTILISER CE SITE WEB.
NRC Publications Record / Notice d'Archives des publications de CNRC:
https://nrc-publications.canada.ca/eng/view/object/?id=b7012906-ca8f-4e71-9949-1d5c47773f92 https://publications-cnrc.canada.ca/fra/voir/objet/?id=b7012906-ca8f-4e71-9949-1d5c47773f92
NATIONAL RESEARCH COUNCIL OF CANADA CONSEIL NATIONAL DE RECHERCHES DU CANADA
MOISTURE GAINS BY FOAM PLASTIC ROOF INSULATIONS
UNDER CONTROLLED TEMPERATURE GRADIENTS
By C.P. Hedlin
4 .a ..,r--- rr --.. . . .s.---, ,.- -.2.-%-.-,> C . l ' , . . = , ' , . ' ' ' - . I , . . . ;: , --
L,$c;r.l-,$,L: 'l~?-
t \ , Reprinted from 11
Journal of Cellular Plastics
C "I $ yj;:; 1 :, , I SeptemberIOctober 1977 8p. f 11 W&.TIBMAL BP51AAfP CQWHc;r b--- -:-,-- : -s&..,- ,-....-..-; DBR Paper No. 740
Division of Building Research
Moisture gains of three closed cell and one open cell foam plastic insulation were studied in the laboratory. The purpose of the study was to investigate the relationship between rates of moisture gain and temperature- moisture environment under laboratory conditions
L'augmentat~on de la teneur en humidite a I'interieur d'isolantes en mousse plastique dont trois a cellules fermees et un a cellules ouvertes a ete etudiee en laboratoire. L'etude avait pour objet la relation entre les taux d'augmentation d'humidite du materiau et les conditions de temperature-humidite du milieu, dans des condi- tions de laboratoire simulant celles existant sur une toiture a membrane d'etancheite protegee.
NATIONAL R E S E A R C H COUNCIL O F CANADA DIVISION O F BUILDING RESEARCH
ADDENDUM
M o i s t u r e gains by f o a m p l a s t i c roof insulations under c o n t r o l l e d t e m p e r a t u r e g r a d i e n t s
by C. P. Hedlin
T h e following i n f o r m a t i o n w a s omitted f r o m the r e p r i n t s of t h i s p a p e r i s s u e d by DBR a s NRCC 16317
Hedlin - conrinued f r o m p. 319
Report N o . 2 0 2 , Goteborg, August 1 9 7 3 .
7 - J . Achtzieer, "Measurement o f the Thermal Conducti-
v11y oi Plastic Foams with a n y Desired Moisture Con- tent."E;rtnstsroffe if?] Bau, V o l . 2 3 , ( 1 9 7 1 ) . p. 3 .
8. Ivar Paljak, "Condensation in Slabs o f Cellular Plastics." Marenaux er Consrmcrions. V o l . 6, N o . 3 1 , ( 1 9 7 3 ) . p.
5 3 .
C. Hedlin
A native of Saskatchewan, Charles Hedlin obtained a B.Sc. degree from the University of Saskatchewan in 1950, an M.Sc. degree from the Univer- s i t y of Minnesota in 1952 (both in Agricultural Engineer- ing), and a Ph.D. degree from the University of Toronto in Mechanical Engineering in
J o u r n a l of CE1,LULAR PLASTICS
s e p t e m b e r / O c t o b e r 1977
1957. From 1952 to 1960, he taught engineering subjects and carried out research on the drying of agricultural products at the Ontario Agricultural College. In 1960 Dr. Hedlin joined the staff of the Division of Building Research, National Research Council of Canada at the Prairie Regional Station in Saskatoon, Saskatchewan, and has carried out re- search on humidity measurement, moisture absorp- tion characteristics of some building materials, and on flat roofing. At present he is Officer-in-Charge of the Division's Prairie Regional Station.
Moisture Gains
by
Foam Plastic
R o o f Insulations Under
Controlled Temperature Gradients
C. P. HedlinPrairie Regional Station Division of Building Research National Research Council of Canada
Saskatoon, Canada
Introduction
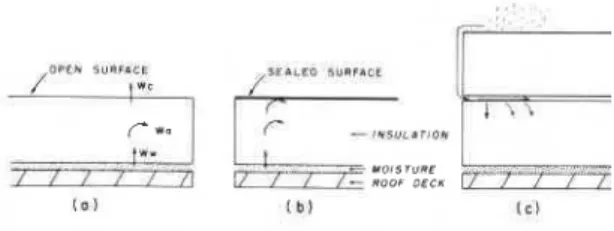
I n protected membrane roofs thermal in- sulation is placed above the waterproof membrane. Thus it is exposed to moisture and the possibility that it may become wet must be considered. This is a relatively new building concept in which the effects of moisture on insulation have not been fully explored.
In protected membrane roofing, rainwater may flow between the roof insulation and the membrane if they are not bonded together. During much of the year, the temperature at this interface, Ow, is higher than the temperature at the exterior surface of the
insulation, 0,. If moisture is present at the warm
surface, the vapour gradient drives it into the insula- tion along the path of decreasing temperature. Some
of the moisture entering the insulation (W,) may
pass through it (W,) unless the upper surface is sealed (Figures l a , b); some may condense in it (W,). A similar situation may also occur at the top surface. If moisture is trapped between the insula- tion and a covering layer, such as a paving stone, solar heating will periodically raise the water vapor pressure and promote moisture entry into the insulation (Figure I c).
Moisture reduces the thermal resistance of in- sulation and may contribute to its physical break- down. The amount of moisture gained in service and
l E A L F O T U R F A C I
R O O F D E C X
t o ) [ b l l c l
Figure 1. Moisture movement in insulations subjected t o a combined temperature - moisture gradient on a protected
membrane roof.
the consequences vary with the nature of the insula- tion, the design of the system and the environ- mental conditions. The effects of moisture on thermal resistance and physical breakdown are important parts of the over-all insulation-moisture problem but are outside the scope of this study. It is part of an investgation of how to control moisture gain by insulation in protected membrane roofs which, in turn, will help t o minimize its effects (1,2).
The study was designed to gain information about the relationship between rates of moisture gain and temperature-moisture environment under laboratory conditions that simulated those on a protected membrane roof. The main emphasis was given t o closed cell insulations, though one open cell material was included in some of the tests. Impor- tant differences existed between the field conditions and the laboratory model. In the laboratory, entry through only one side was considered, and that under steady state conditions. Freeze-thaw action which might damage cell walls and markedly modify the moisture uptake of some closed cell insulations was not included. Lastly, this study did not include the concept of moisture balance; in the field envir- onment. the moisture that enters the insulation under moist conditions leaves when conditions favor drying.
The literature on moisture movement in materi- als is extensive but the major emphasis has been on capillary materials, with relatively little on closed cell materials. Studies involving moisture gain in closed cell materials under temperature gradients in- clude studies of moisture gains by thermal insula- tions in protected membrane roofs (1,2), an analy- sis of moisture movement in structural systems (3), the effect of freeze-thaw action (4), and studies by
Levy (5), Thorsen (6), Achtizer (7) and Paljak (8)
on the effect of moisture on heat transfer.
Moisture movement in materials may be as- cribed generally to three agents: vapor pressure
gradients, gravity forces and capillary forces. The first can be regarded as producing vapor flow and the other two liquid flow. Owing to the complex nature of the sorption process in hygroscopic mater- ials and effect of water soluble components, the dis- tinction between vapor and liquid movement may not always be clear. However, for the purpose of this study, this simple division is probably adequate. The relative importance of each mode depends
on the nature of the material; for example, in mater-
ials with large pores, percolation under gravity may be the principle mode of transfer; in some fibrous materials, capillary movement is the important fac- tor. Neither of these forces is likely to be important in truly closed cell plastic materials, however, where vapor flow will probably dominate.
If it is assumed that moisture movement is due to a thermally induced vapor pressure gradient and that the material is wet on both surfaces, one can express the amount of moisture absorbed (Wa) as the difference between that entering at the warm
surface (W,) and that exiting at the cold surface
Wc):
where
These units are defined as follows. SI units are given first, followed by English units in brackets:
pw,p, permeability of the materials at the warm and
c o l d surfaces, respectively, kg/TPa.m.s*
(perm-in .);
A surface area m2 (ft2);
dp/dO slope of the water vapor saturation pressure curve Pa/K (in. Hgl°F);
dO/dx temperature gradient K/m ("Flin.);
T time elapsed, seconds s.
*kg/TPa-m-s simplifies to ps ( ~ = t e r a = l ~ " , p=pico=loT' '); kg - kilogram; Pa - pascal; m - m e t r e ; K - degrees kelvin. These equations represent boundary conditions only (warm and cold surfaces), and do not purport to represent the moisture movement within the insulation.
Experimental
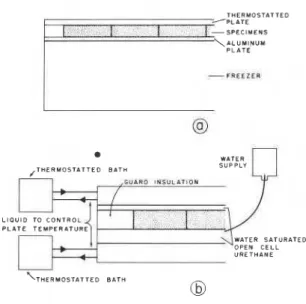
Two apparatus were used to produce a tempera- ture gradient across the specimens. One apparatus
consisted of an aluminum plate, 6 mm thick, placed
over the opening of a household freezer to provide the cold surface. The warm surface was controlled
by a thermostatted, electrically heated plate (Figure 2a).
In the second apparatus, the temperatures of two plates were controlled by liquid pumped from thermostatted baths (Figure 2b). Temperatures were regulated by proportional controllers with sensors in the liquid supply lines. The lower plate was sur- rounded by a lip, 25 mm high secured and sealed t o form a shallow water bath. Open cell urethane was placed in it and a water supply was arranged t o maintain a level even with the top of the urethane. The insulation specimens rested on this surface.
Extruded polystyrene, bead polystyrene and urethane (all closed cell) and phenolic foam (open cell) were used. The specimens were cut from board stock and, except for a few tests, any skin or protec- tive covering was removed t o expose the foamed material. Three specimens of each insulation were used together for each measurement and the results were averaged. T H E R M O S T A T T E D /PLATE I ! I - S P E C I M E N S \ A L U M I N U M P L A T E L I Q U I D TO C O N T R O L OPEN C E L L U R E T H A N E
Figure 2. Two types of apparatus for maintaining tempera-
ture and moisture gradients across the insulation specimens.
Results and Discussion
I (a). In the first set of experiments, extruded polystyrene with a density of 32 kg/m3, a bead polystyrene (16 kg/m3) and phenolic foam (52 kg/m3) were cut into pieces 100 mm square and
25.5 mrn thick. (Specimen thicknesses varied by
about k0.5 mm). Specimens of a urethane (29
kg/m3), 95 rnm in diameter and 25.5 mm thick,
were fitted into acrylic plastic collars to prevent them from deforming when they gained moisture. The edges and one surface of all specimens were wax sealed. Trios of specimens of each insulation were prepared.
Specimens were placed open-face down on a wet surface. The waxed surface was kept at the same
temperature as the unwaxed one1 or was cooled t o approximately 2.8, 11 or 22°C below that of the open surface by using the apparatus shown in Figure 2b. These differentials deviated somewhat and cal- culations are based on temperatures measured with a thermocouple in the middle of each main surface. The warm surface was kept at 27f l°C except for some measurements at the largest temperature dif- ferential when, toward the end of tests, the high moisture content caused it to fall as low as 24.S°C for the closed cell plastics, and to 21°C for the open cell plastic.
Each test lasted from 4 to 9 weeks. At intervals ranging from 3 days to a week, the specimens were taken out of the test apparatus, surface dried with tissue paper, weighed and immediately returned to the apparatus. At the end of a test, they were dried at room conditions and reused.
Moisture contents are given in terms of the gross volume of dry material.2 This provides a basis for comparing total amounts of moisture in different materials which is independent of their densities. To a first approxirnation,~some effects, such as loss of thermal resistance, are likely to vary in proportion to the total moisture content of the insulation. Changes in volume due to moisture absorption introduce a corresponding error, however.
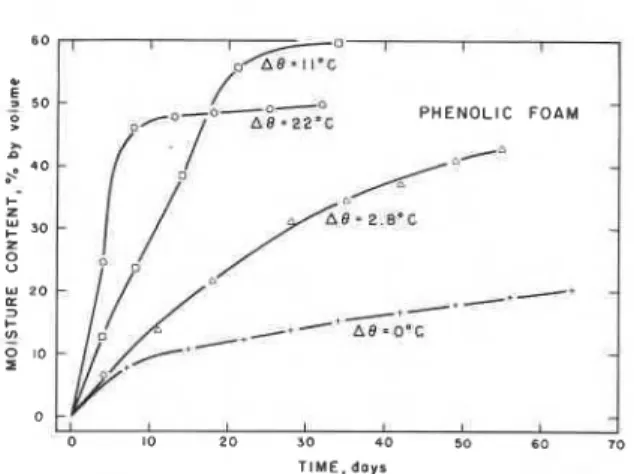
The results are plotted in three different ways: 1. moisture content vs time in Figures 3 (closed cell) and 4 (open cell insulation);
2 , average rate of gain, W/Ar vs dp/d6 A6/Ax in
@
E X T R U D E D
1
BEADP O L Y S T Y R E N E P O L Y S T Y R E N E U R E T H A H E
T I M E , days
Figure 3. Moisture gain in three foam plastic insulations, % of gross volume vs time elapsed in days, for 0, 2.8, 11, and 22°C temperature differentials. Specimen thickness 25.5+
0 . 5 mm thick. Cold surfaces wax sealed.
'
The measurements were made in a constant temperature air bath ( + 0 . 5 O ~ ) . The specimens were surrounded by insula- tion t o minimize the effect o f temperature fluctuations. To convert moisture contents in % of gross volume t o %weight, multiply by 997 +insulation density kg/m3 or by
6 2 . 3 +insulation density 1b/ft3. U
5
5 0 - PHENOLIC FOAM-
40-
-./*---
0 10 - 0 - I 0 10 2 0 30 40 50 60 70Figure 4. Moisture gain in phenolic foam, % of gross volume vs time elapsed in days, for 0 . 2 . 8 . 11, and 22" C temperature differentials. Specimen thickness 2 5 . 5 k 0 . 5 mrn thick. Cold
surfaces wax sealed.
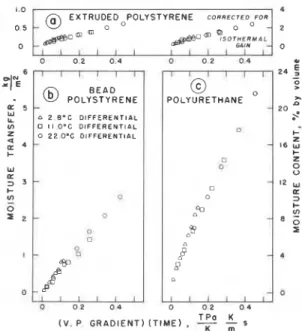
Figure 5 (closed cell insulation); and
3. accumulated gain, W/A, or moisture content vs dp/d6 A6lAx T in Figure 6.
In the isothermal tests, the polystyrenes gained about 0.1% by volume, the urethane 0.4% and the phenolic foam over 20%in the 64-day period. The rates of gain were highest at the outset and de- clined with time. In the non-isothermal measure- ments the initial gains were usually relatively high and were followed by a nearly constant gain rate or
one that continued to decline (Figures 3 and 4).
In order t o include the vapor pressure in the calculations, rates of gain (W/TA) and vapor pressure gradient (dp/d6 AO/Ax) were computed, the latter using measured surface temperatures. (W/TA and dp/d6 have been defined; AOlAx is the temperature difference across the specimen divided by its thick- ness). The first reading, taken 3 or 4 days after the beginning of the test, was arbitrarily neglected t o avoid "starting" effects. The data following it, for which the moisture content-time plot was linear, or nearly so, were used to estimate the average values of the above parameters. These results are plotted in Figure 5, and first order equations were fitted to the data by least squares analysis.
As shown in Figures 3, 4 and 5, temperature induced vapor pressure gradients have a large effect on the rate of transmission of moisture into the insulations, e.g., average rates of gain with an 11°C differential ranged from 10 times the isothermal rates for the open cell plastic to over 100 times for the bead polystyrene.
The slopes of the plots in Figure 5 have the dimensions of permeability, p. These p values were 1.1 6 (0.80), 6.8 (4.7) and 11.6 (8.0) ps (perm.-ii.) for the extruded polystyrene, bead polystyrene and urethane, respectively. For the phenolic foam the value was 118 (81 .l) ps (perm-in.). These were apparent rather than real values (hence are desig- nated pa) because the temperature gradient used t o
EXTRUDED + POLYSTYRENE I. 0 0 8 . 22'C
-
o An. 1l.C - D A8.2 B ' C * A 8 - 0.C POLYSTYRENEI
VAPOR PRESSURE GRADIENT
Figure 5. Rate of moisture gain b y closed cell insulations vs vapor pressure gradient. Individual values are averages of the tests at 0, 2.8, 11, and 22" C differentials using the data
shown in Figure 3.
calculate them was the average through the speci- mens. This assumed linearity of the temperature gradient. In fact, it may have been nearly linear at the outset, but would probably become non-linear because of non-uniform deposition of moisture in the insulation which affects the local thermal con- ductivity, hence the temperature gradient.
I n Figure 6 , W/A .is p l o t t e d against dp/dO M/Ax,T. The moisture content is given on the right hand side of the plots. The isothermal gain was ignored, thus introducing an error. The correct
plot should be W/A - W/AiSoth vs dp/dO AO/Ax T.
The error was calculated using the results in Figure
C O R R E C l E O F O R 0 5 G 4 l N - 0 I I I I I I I I I L I I 0 0 2 0 . 4 0 0 2 0 4 u
1
(@ B E A D P O L Y S T Y R E N EI
T P a 5 ( V . P G R A D I E N T ) ( T I M E ) , 7Figure 6. Moisture gain kglmz and % of gross volume vs (va- por pressuregradient) (time elapsed) for the closed cell insu- lations. The results for extruded polystyrene are given with-
out and with correction f o r isothermal gain.
4 and assuming that the factor producing a gain under isothermal conditions continued to contri- bute at the same rate under non-isothermal condi-
tions (see Table 1). The error decreased as the tem-
perature differential increased and was highest for the open cell phenolic foam, followed by extruded polystyrene, the urethane and the bead polystyrene.
Table 1. Calculated Percentage Errors i n W I A Due t o Iso- thermal Moisture Gain Based o n Data i n Figure 4.
- . Temperature DifferentialmoC 2.8 1 1 22 - Extruded Polystyrene 10.0 3.7 2.1 Bead Polystyrene 3.1 1.0 0.5 Urethane 4.1 1.6 1.1 Phenolic Foam 32.1 11.2 6.2
If the data were well correlated bv this method of plotting, the curves for each material would be superimposed on one another. Failure to do so arises from three main causes: error in measure- ment, difference between groups of specimens and inadequacy of the method of plotting. The last in- cludes the errors involved arising from neglect of the isothermal gain and the approximation inherent in the assumption of a linear temperature gradient.
The effectiveness of the method of correlating the data to accommodate the effects of temperature differential and isothermal gain can be estimated by statistical treatment. The data used were taken from the sections of the curves that overlapped. These sections were short and covered only the lower moisture content regions, e.g., to about 1% for ex- truded polystyrene i n d 4% for bead polystyrene. The first three points for each of the 22°C differen- tials were used (two for the phenolic foam) along with three points each for the 2.8 and 11°C differ- entials that fall within the same range of abscissa values. They were then grouped for each insulation, and a linear least squares fit was found. The coeffi- cients of variation and correlation coefficients (in brackets) were 6.5 (.975), 7.5 (.973), 12.2 (.968) and 19.4% (.952) for extruded polystyrene, ure- thane, bead polystyrene and phenolic foam, respec- tively. When corrections for isothermal gains were applied to the extruded polystyrene and phenolic foam, using figures from Table 1, the coefficients of variation and correlation coefficients were 3.5 (.994) and 4.9% (.992), respectively.
The slopes of these curves also have the units of permeability. From the above analysis, they were 1.27 (0.89), 11.4 (7.8), 5.6 (3.9) and 107 (74) ps (perm-in.) for the extruded polystyrene, urethane, bead polystyrene and phenolic foam, respectively. When the corrections for isothermal gain were applied, the slope of the extruded polystyrene did not change but that of the phenolic foam increased to 109 (75) ps (perm-in.).
I (b). The extruded polystyrenes used in these
experiments came with a thin skin on the surface, produced in the manufacturing process. Normally this would have been removed, but was left in place for a test with specimens 13.6, 25.2 and 48.7 mm thick. The other surfaces were wax sealed. The un- sealed surfaces (with skin) were kept at about
2 8 . 5 " ~ and the opposite ones at about 10°C. In
each case, the measured average temperature was
used in the calculations. The slopes were 0.50
(0.343, 0.60 (0.41) and 0.68 (0.47) ps (perm-in.) for
13.6, 25.2 and 48.7 rnrn specimens, respectively3
(Figure 7). This iIlustrates that surface skin reduces
moisture uptake and its effect decreases when speci- men thickness, hence total resistance, increases.
Figure 7. Moisture gains by specimens of extruded polysty- rene of three different thicknesses. Skin produced in the ex- trusion process was left on the warm side of all specimens.
11. A second set of measurements was carried
out to determine the rate of moisture transmission through the insulation. The first temperature con- trol apparatus described previously was used. The apparatus was devised so that the moisture passing through the cold surface could be measured. For each insulation, a trio of specimens, 95 mm in diameter and 25.5 k0.5 mm thick, were prepared and wax sealed in acrylic plastic collars. Plastic cups of the same diameter were filled with water saturat- ed filter paper. They were sealed to the collars using stopcock grease. A thermocouple was placed at each of the warm and cold surfaces of the specimens (Figure 8).
Moisture gain af the warm surface,
W
,
,
wasfound by weighing the entire assembly at the begin-
ning and end of an observation period. The cup was
then removed and the specimen weight determined,
thus obtaining W,. The difference between these
3 ~ h e s e are pseudo permeabilities because the specimens are not homogeneous with a surface coating.
was assumed t o be the moisture transmitted from the cold surface, Wc.
- W A X SEAL ' - M E T A L P L A T E BONDED - A S T I C - P A P E R S - - - -TO B O T T O M OF C U P
Figure 8. Apparatus used to measure moisture transmission into the warm surface, out through the cold surface and ab-
sorbed by the specimen.
I1 (a). One test was carried out with three ex- truded polystyrene specimens, a bead polystyrene (26 kg/m3) and a urethane specimen, with the warm surfaces uppermost. The warm and cold side tem- peratures were 40 and 29"C, respectively. The mois- ture transmitted t o the warm surface (W/AX, and from the cold surface @/A), for the extruded poly- styrene, the bead polystyrene and urethane is plot- ted (neglecting isothermal gain) in Figures 9a, b and c, respectively, against the corresponding values of dp/dtJ AtJ/Axr. Moisture content is also given. It was obtained by taking the difference in the total moisture that had entered and left the specimen,
i.e., (W/A), - (W/A), at the time of each obser-
vation. The abscissa in this case is the difference between the corresponding values of the (average
vapour pressure gradient) X time for the cold and
warm surfaces. The slopes of the curves representing moisture content have the units of permeability though this does not have any easily recognizable
- 0 WARM SIDE ENTRY
---0 COLD SIDE E X I T
zE
,
----..MOISTURE CONTENT ai
2 0 > EXTRUDED 0 0 4 0 8 0 0 4 0 8 0 0 4 0 8 ( V P G R A D I E N T ) I T I M E I.
+
sFigure 9. Moisture entering the warm surface, exiting from the cold surface end remaining in the specurnen vs (vapor pressure gradient) (time elapsedl. Warm surface uppermost. Specurnen thickness 25.5 e 0.5 mrn. The abecim for the moisture content is
[(z)~
)I
-
(:
timephysical meaning. However, the slopes give a measure of the tendency of the insulations to retain moisture under these conditions.
A slope was calculated for each set of points in Figures 9 and 10. These are approximate values since the plots are more or less curved. These values have not been placed on the graphs but are given below. From Figure 9 , for the extruded polysty- rene, the slope of the curve representing the warm surface, pa, = 0.93 ps (0.64 perm-in.); pa, (the moisture leaving the cold surface), however, was 1.9 ps (1.3 perm-in.). The high value for pa, might be accounted for if there had been an air gap between the specimen and the wet filter paper; the humidity at the surface would then have been below 100% which would have increased the vapor outflow. It was not apparent that this had occurred however.
I1 (b). The procedure was repeated but the assemblies were inverted so that the warm surface was downward. Warm and cold surface temperatures were 42 and 2S°C, respectively (Figure 10).
For extruded polystyrene (Figure lOa), the ini- tial moisture transfer rate was relatively high at both the warm and cold surfaces, but decreased there- after. The value for paw, calculated from the data in the upper part of the curve, was 1.3 ps (0.89 perm- in.).
For Figure lob, paw varied from an initial value of about 8.0 ps (5.5 perm-in.) t o 4.0 ps (2.8 perm- in.); pa, varied widely. In the period during which the moisture content rose t o nearly 20%, it averaged
ma -
0 C O L D 510E E X l T
POLYSTYRENE
Figure 10. Moisture entering the warm surface, exiting from the cold surface, and remaining in the specimen vs (vapor pressure gradient) (time elapsed). Warm surface on the bot- tom. Specimen thickness 25.5t 0.5 mm. The abscissa for the moisture content is
direction was lower than when the movement was downward. This may have been the effect of gravity or of moisture conditions at the cold surface.
Moisture permeability of these materials was found using the procedure outlined in ASTM C355. The values in Table 2 were averages of 3 to 6 speci- mens of each material.
about 3.0 ps (2.0 perm-in.).
For Figure IOc, yaw varied from roughly 15 ps Summary
(10 perm-in.) hitiallyto 2.2 ps (1.5 permlin.) at the Laboratory experiments were carried out to upper part of the plot. The value for pa, averaged assess the moisture absorption and transmission about 4.0 ps (2.8 perm-in.). properties of several foam plastic insulations when The results in Figures 9 and 10 differ somewhat. subjected to combined thermal-moisture gradients. It appears that egress of the moisture in an upward Extruded polystyrene, two bead polystyrenes, a
Table 2. Wet Cup Permeabilities (ASTM €355) and Apparent Permeabilities Estimated from the Temperature-Moisture Tests ps (perm-in.).
Wet cup Temperature-moisture gradient
permeabilities results
Figure No.
Vapor Liquid Uaw ac
ps (perm-in.) ps (perm-in.) ps (perm-in.)
Extruded polystyrene 1.1 1.1 I .l (.SO) 5
(32 kg/m3 (.76) (.76) 1.0-1.7 (.69-1.2) 1.9 (1.3) 9 1.3-1.4 (.89-.95) 1.7-4.5 (1.2-3.1) 10 Bead Polystyrene 3.0 - 6.8 (4.7 5 (16 kg/m3 ) (2.0) Bead polystyrene 2.2
-
* 10-14 (6.9-9.5) 8.0 (5.5) 9 (26 kg/m3 ) (1.5) 5.5-9 (3.8-6.2) 2.8 (1.9) 10 Polyurethane 7.1 7.1 1 1.6 (8.0) 10 (6.9) 5 (29 kg/m3 ) (4.9) (4.9) 10-1 2 (6.9-8.3) 2.5 (1.7) 9 4.5-14 (3.1-9.6)Phenolic foam 38 118 (81 Calculated
(52 kg/m3 (26) from data in
Figure 4 'Test not applicable - liquid flow through fissures.
urethane and a phenolic foam were placed under temperature differences ranging from 0 t o 2 2 ' ~ in the presence of free water.
The study was part of a research program on protected membrane roofing where insulations are exposed to combined temperature-moisture gradi- ents; the experimental arrangements were modeled after that system. Important differences existed be- tween the field and laboratory environments; the former involving idealized conditions, e.g., steady state conditions and saturated conditions at the insulation surfaces.
tn most of the laboratory measurements, surface
skins were removed to expose the base material,
thus voiding any pratection provided by the manu-
facturer which weuld hare reduced moisture gains. The laboratory results indicate:
1. The rate of moisture entry into the insulation increased with the applied vapor pressure gradient. In the early stages when moisture content was not too high, e.g., 20% by volume or less, the propor- tion was approximately linear, or gradually declin- ing. The rate of gain decreased as the moisture content increased. In the open cell plastic, it nearly ceased when the moisture content reached 50 to 60%.
2. Rates of gain under zero temperature gradient
were measured. These were small compared to those
produced when a temperature gradient was applied,
i.e.. using these results, average rates of gain under isothermal conditions, over a test period of 64 days,
were estimated to be equivalent to those produced
by the application o f a temperature gradient of abour 1.2"C for the open cell plastic, 0.4"C for the extruded polystyrene. and 0.1 "C for the bead poly- styrene and urethane.
3 . Data for moisture transmission for 25.5 mm thick specimens of extruded and bead polystyrene, a urethane, and a phenolic foam were correlated
using an equation based on Fick's Law. Tempera-
ture differences across the specimens were 2.8, 11 and 22°C. Calculations were based on conditions a t the warm surface and n o attempt was made specifi- cally t o include the effects of internal transport and
deposition. The correlation coefficient COT short,
over-lapping sections of the curves ranged from 0.97
to 0.99 for the four materials.
4. Apparent permeability values corresponding t o the imposed surface conditions were estimated from measured rates of moisture movement and the vapor pressure gradient based on an assumed linear temperature gradient. The values were higher than wet cup permeability values (ASTM C355) in nearly
all cases- about 50%higher for extruded polystyrene
and urethane, and 150 to 500% higher for bead polystyrene and phenolic foam.
5. When the cold surfaces of the polystyrenes and urethane were left open and kept wet, they exuded significant amounts of moisture.
6. In most of these tests, any protective surface coating was removed. In one test, where the natural skin was left on extruded polystyrene, the rate of moisture gain was reduced, as expected. In outdoor tests ( l , 2 ) , specimens were surface-sealed with coat- ed base sheet. The tests showed that under practical conditions surface-sealing could dramatically reduce the moisture gains. In practice this kind of protec-
tion could be acheved by applying a protective
membrane and would also be obtained if the insula- tion were fully bonded t o the membrane, e.g., in a bitumen pour coat.
7. In this study, attention has been given primar- ily to the rate of moisture gain under a temperature- moisture gradient. Moisture will also escape from insulations if the proper conditions exist. Thus a model based on the concept of moisture balance, in which both gain and loss play a part, may more nearly approximate the practical situation.
8. The procedure used in this work simulates the conditions on protected membrane roofs in that thermal-moisture gradients exist in both cases. Field conditions are different because temperature will fluctuate, moisture conditions will not always be saturated and freeze-thaw cycles may occur. Never- theless, a test based on the use of a thermal-mois- ture gradient may provide useful, though not complete, information about field performance of insulations in which the vapor mode of transport predominates.
Acknowledgments
The author wishes t o express his appreciation t o Mr. R. G. Nicholson who constructed the equip- ment and made the measurements for this study.
This paper is a contribution of the Division of Building Research, National Research Council of Canada, and is published with the approval of the Director of the Division.
References
1. C. P. Hedlin, "Moisture Attack on Insulations in R o -
tected Membrane Roofs,'' CIBjRlLEM Symposium on Moisture Problems in Buildings, Rotterdam, 1974. (reprinted as NRCC 14590).
2. C . P. Hedlin, "Moisture Content in Protected Membrane Roof Insulations - E f f e d of Design Features," ASTM Symposium on R m f i n ~ Systems. June 1975. (reprinted
as NHCC 15382).
3. T. Ambrus and T. J. Komoly, "Moisture Movement Un- der the Combined Effects of Temperature and Partial Vapour Pressure Gradient," J. Refrigeration, Four Parts
(July, August, September, October, 1968), pp. 182, 197, 22, 236, 253, 55.
4. Chester W. Kaplar, "Moisture and Freeze-Thaw Effects on Rigid Thermal Insulations," Tech. Report 249, C.R.R.E.L. (1974).
5. Marshall M. Levy, "Moisture Vapor Transmission and Its Effect on Thermal Efficiency of Foam Plastks,"
J. Celhrlnr plastic.^^ Val. 2. No. 1 (1966), p. 37.
6. Sven-Hakan Thorsen, "Determination of the EIongation Coefficient. Water Absorption. Moisture Diffusivity, as
weTl as Thermal Conductivity at Different Moisture
Contents for Polystyrene and Urethane Cellular mas- tics," (in Swedish), Chalrners Institute of Technology, Dept. of Building Technology, Diploma work 73:6,
Journal of CELLULAR PLASTICS, SeptemberIOctober, 1977
continued on p. 326
Hedlin - continued from p. 319
Report NO. 202, Goteborg, August 1973. 1957. From 1952 to 1960, he taught engineering
'7. 1. Achtziger. "Measurement of the Thermal Conducti-
and carried out
on
the Zrying ofvity of Plastic Foams with any Desired Moisture Con-
tent."Kunststoffe im ~ o u . VOI. 23.11971). o. 3. agricultural products at the Ontario Agricultural
8. Ivar Paljsk,
diden ens at ion
in ~ l a b s ' d f ceii"lar Plastics," College. In 1960 Dr. Hedlin joined the staff of theMatetiaux et
.-
Constnrctions, Vol. 6, No. 31, (1973), p. Division of Buildine Research. National Research>.*.
C. Hediin Council of Canada Saskatoon, Saskatchewan, and has carried out re. the prairie Regional Station in
A native of Saskatchewan, search on humidity measurement, moisture absorp- Charles Hedlin obtained a B.Sc. tion characteristics of some building materials, and degree from the University of on flat roofing. At present he is Officer-in-Charge of Saskatchewan in 1950, an the Division's Prairie Regional Station.
M.Sc. degree from the Univer- sity of Minnesota in 1952 (both in Agricultural Engineer- ing), and a Ph.D, degree from the University of Toronto in Mechanical Engineering in
J o u r n a l of C E L L U L A R PLASTICS ~ e ~ t e m b e r / ~ c t o b e r 1 9 7 7