HAL Id: hal-02972571
https://hal.archives-ouvertes.fr/hal-02972571
Submitted on 29 Nov 2020
HAL is a multi-disciplinary open access
archive for the deposit and dissemination of
sci-entific research documents, whether they are
pub-lished or not. The documents may come from
teaching and research institutions in France or
abroad, or from public or private research centers.
L’archive ouverte pluridisciplinaire HAL, est
destinée au dépôt et à la diffusion de documents
scientifiques de niveau recherche, publiés ou non,
émanant des établissements d’enseignement et de
recherche français ou étrangers, des laboratoires
publics ou privés.
Recommending Deployment Strategies for Collaborative
Tasks
Dong Wei, Senjuti Basu Roy, Sihem Amer-Yahia
To cite this version:
Dong Wei, Senjuti Basu Roy, Sihem Amer-Yahia. Recommending Deployment Strategies for
Collabo-rative Tasks. SIGMOD/PODS ’20: International Conference on Management of Data, 2020, Portland
(virtual), United States. pp.3-17, �10.1145/3318464.3389719�. �hal-02972571�
Recommending Deployment Strategies
for Collaborative Tasks
Dong Wei
NJIT, USA
Senjuti Basu Roy
NJIT, USA
Sihem Amer-Yahia
CNRS, Univ. Grenoble Alpes, France
sihem.amer- [email protected]
ABSTRACT
Our work contributes to aiding requesters in deploying
col-laborative tasks in crowdsourcing. We initiate the study of
recommending deployment strategies for collaborative tasks
to requesters that are consistent with deployment
parame-ters they desire: a lower-bound on the quality of the crowd
contribution, an upper-bound on the latency of task
com-pletion, and an upper-bound on the cost incurred by paying
workers. A deployment strategy is a choice of value for three
dimensions:Structure (whether to solicit the workforce se-quentially or simultaneously),Organization (to organize it collaboratively or independently), andStyle (to rely solely on the crowd or to combine it with machine algorithms).
We proposeStratRec, an optimization-driven middle layer
that recommends deployment strategies and alternative
de-ployment parameters to requesters by accounting for worker
availability. Our solutions are grounded in discrete
optimiza-tion and computaoptimiza-tional geometry techniques that produce
results with theoretical guarantees. We present extensive
experiments on Amazon Mechanical Turk, and conduct
syn-thetic experiments to validate the qualitative and scalability
aspects ofStratRec.
ACM Reference Format:
Dong Wei, Senjuti Basu Roy, and Sihem Amer-Yahia. 2020.
Recom-mending Deployment Strategies for Collaborative Tasks. In
Pro-ceedings of . ACM, New York, NY, USA, 15 pages. https://doi.org/ 10.1145/nnnnnnn.nnnnnnn
1
INTRODUCTION
Despite becoming a popular means of deploying tasks,
crowd-sourcing offers very little help to requesters. In particular,
task deployment requires that requesters identifyappropriate deployment strategies. A strategy involves the interplay of multiple dimensions:Structure (whether to solicit the work-force sequentially or simultaneously),Organization (to orga-nize it collaboratively or independently), andStyle (to rely on the crowd alone or on a combination of crowd and
ma-chine algorithms). A strategy needs to be commensurate
, , © 2020 .
https://doi.org/10.1145/nnnnnnn.nnnnnnn
todeployment parameters desired by a requester, namely, a lower-bound on quality, an upper-bound on latency, and an
upper-bound on cost. For example, for a sentence translation
task, a requester wants the translated sentences to be at least
80% as good as the work of a domain expert, in a span of
at most 2 days, and at a maximum cost of $100. Till date,
the burden is entirely on requesters to design deployment
strategies that satisfy desired parameters. Our effort in this
paper is to present a formalism and computationally
effi-cient algorithms to recommend multiple strategies (namely k) to the requester that are commensurate to her deployment parameters, primarily for collaborative tasks.
A recent work [5] investigated the deployment of text
cre-ation tasks in Amazon Mechanical Turk (AMT) empirically.
The authors validated the effectiveness of different strategies
for different collaborative tasks, such as text summarization
and text translation, and provided evidence for the need to
guide requesters in choosing the right strategy. In this paper,
we proposeto automate strategy recommendation. This is
particularly challenging because the estimation of the cost,
quality, and latency of a strategy for a given deployment
request must account for many factors.
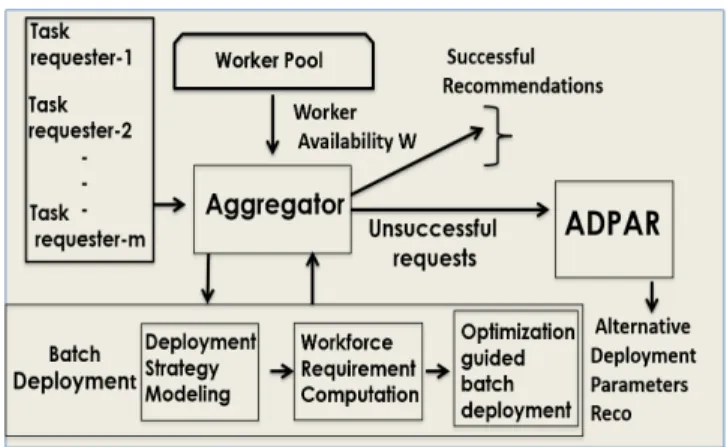
To realize our contributions, we developStratRec (refer to Figure 1), an optimization-driven middle layer that sits
between requesters, workers, and platforms.StratRec has
two main modules:Aggregator and Alternative Parameter
Recommendation (ADPaR in short). Aggregator is
respon-sible for recommendingk strategies to a batch of
incom-ing deployment requests, considerincom-ing worker availability.
If the platform does not have enough qualified workers to
satisfy all requests,Aggregator triages them by optimizing platform-centric goals, i.e., to maximize throughput or pay-off (Section 2.2). Unsatisfied requests are sent to ADPaR, which
recommends different deployment parameters for whichk
strategies are available.
In principle,recommending deployment strategies involves modeling worker availability considering their skills for the tasks that require deployment. This gives rise to a complex function that estimates parameters (quality, latency, and
cost) of a strategy considering worker skills, task types, and
worker availability. As the first ever principled
investiga-tion of strategy recommendainvestiga-tion in crowdsourcing, we first
make a binary match between workers’ skills and task types
Figure 1: StratRec Framework
workers’ availability. Worker availability is captured as a
probability distribution function (pdf ) by leveraging
histor-ical data on a platform. For example, the pdf can capture
that there is a 70% chance of having 7% of the workers and a
30% chance of having 2% of the workers available who are
suitable to undertake a certain type of task. In expectation,
this gives rise to 5.5% of available workers. If a platform has 4000 total workers available to undertake a certain type of
task, that gives rise to a total of 220 available workers in an
expected sense.StratRec works with such expected values. Contribution 1. Modeling and Formalism: We present a general frameworkStratRec for modeling quality, cost, and latency of a set of collaborative tasks, when deployed based
on a strategy considering worker availability (Section 3.1).
The first problem we study isBatch Deployment
Recommen-dation inside to deploy a batch of tasks to maximize two different platform-centric criteria: task throughput and
pay-off. After that, unsatisfied requests are sent one by one to
theAlternative Parameter Recommendation module (ADPaR).
ADPaR solves an optimization problem that recommends al-ternative parameters for whichk deployment strategies exist. For instance, if a request has a very small latency
thresh-old that cannot be attained based on worker availability, ADPaR may recommend increasing the latency and cost thresholds to findk legitimate strategies. ADPaR does not arbitrarily choose the alternative deployment parameters. It
recommends those alternative parameters that areclosest,
i.e., minimizing the`2distance to the ones specified.
Contribution 2. Algorithms: In Section 3, we design BatchStrat, a unified algorithmic framework to solve the Batch Deployment Recommendation problem. BatchStrat is greedy in nature and provides exact results for the
through-put maximization problem, and a 1/2-approximation factor
for the pay-off maximization problem (which is NP-hard). In
Section 4, we developADPaR-Exact to solve ADPaR that is
geometric and exploits the fact that our objective function is
monotone (Equation 3). Even though the original problem
is defined in a continuous space, we present a discretized
technique that is exact.ADPaR-Exact employs a sweep-line
technique [9] that gradually relaxes quality, cost, and
la-tency, and is guaranteed to produce the tightest alternative
parameters for whichk deployment strategies exist. Contribution 3. Experiments: We conduct comprehen-sive real-world deployments for text editing applications
with real workers and rigorous synthetic data experiments
(Section 5). The former validates that worker availability varies over time, and could be reasonably estimated through multiple real world deployments. It also shows with statistical significance that cost, quality, latency have a linear relation-ship with worker availability for text editing tasks. Our real data experiments (Section 5.1.2) also validate that when tasks
are deployed considering the recommendation ofStratRec,
with statistical significance, they achieve higher quality and
lower latency, under the fixed cost threshold on an average,
compared to the deployments that do not consultStratRec.
These results validate the effectiveness of deployment
recom-mendations of our proposed framework and its algorithms.
2
FRAMEWORK AND PROBLEM
2.1
Data Model
Crowdsourcing Tasks: A platform is designed to crowd-source tasks, deployed by a set of requesters and undertaken
by crowd workers. We consider collaborative tasks such as
sentence translation, text summarization, and puzzle
solv-ing [29, 30].
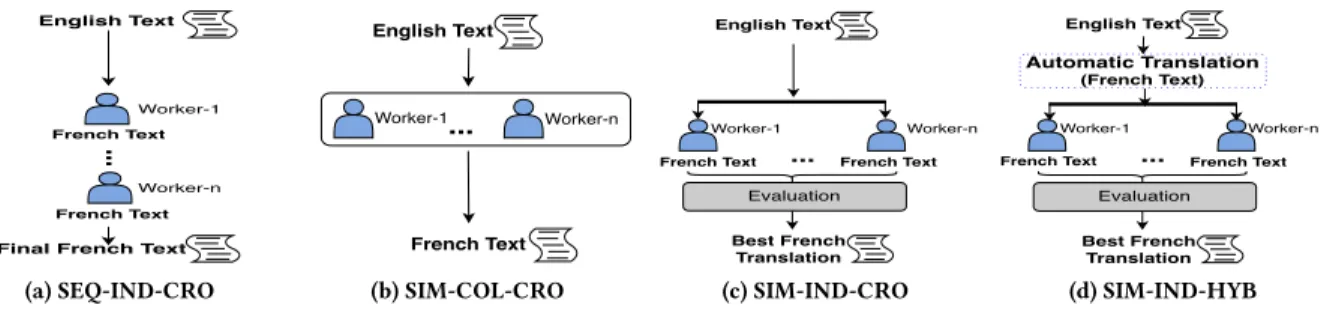
Deployment Strategies: A deployment strategy [17] instantiates three dimensions:Structure (sequential or simul-taneous),Organization (collaborative or independent), and Style (crowd-only or crowd and algorithms). We rely on
com-mon deployment strategies [5, 17] and refer to them asS.
Figure 2 enlists some strategies that are suitable for text
translation tasks (from English to French in this example).
For instance,SEQ-IND-CRO in Figure 2(a) dictates that work-ers complete tasks sequentially (SEQ), independently (IND)
and with no help from algorithms (CRO). In SIM-COL-CRO
(Figure 2(b)), workers are solicited in parallel (SIM) to
com-plete a task collaboratively (COL) and with no help from
algorithms (CRO). The last strategy SIM-IND-HYB dictates a
hybrid work style (HYB) where workers are combined with
algorithms, for instance with Google Translate.
A platform could provide the ability to implement some
strategies. For instance, communication between workers
enablesSEQ, while collaboration enables COL. Additionally, coordination between machines and humans may enable HYB. Therefore, strategies could be implemented inside or outside platforms. In the latter, a platform could be used
solely for hiring workers who are then redirected to an
envi-ronment where strategies are implemented. In all cases, we
will assume a set of strategiesS for a given platform. For the purpose of illustration, we will only use a few
strategies in this paper. However, in principle, the number
of possible strategies could be very large. The closest
anal-ogy is query plans in relational databases in which joins,
selections, and projections could be combined any number
of times and in different orders. Additionally, there exists
multiple real world tools Turkomatic [19] or Soylent [4], that
aid requesters in planning and solving collaborative tasks. In
Turkomatic, while workers decompose and solve tasks,
re-questers can view the status of worker-designed workflows
in real time; intervene to change tasks; and request new
solutions. Such tools would certainly benefit from strategy
recommendation.
Task Requests and Deployment Parameters: A requester intends to find one or more strategies (notationallyk, a small integer) for a deploymentd with parameters on quality, cost, and latency (d.quality, d.cost, d.latency) such that, when a task ind is deployed using strategy s ∈ S, it is estimated to achieve a crowd contribution qualitys.quality, by spending at mosts.cost, and the deployment will last at most s.latency.
Quality Cost Latency
d1 0.4 0.17 0.28 d2 0.8 0.2 0.28 d3 0.7 0.83 0.28 s1 0.5 0.25 0.28 s2 0.75 0.33 0.28 s3 0.8 0.5 0.14 s4 0.88 0.58 0.14
Table 1: Deployment Requests and Strategies
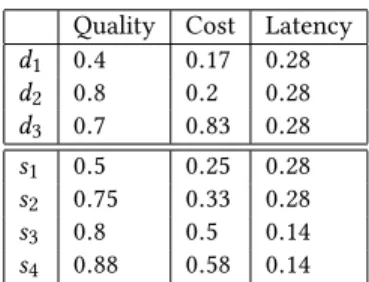
Example 1. Assume there are 3 (m = 3) task deployment
requests for different types of collaborative sentence translation tasks. The first requesterd1is interested in deploying sentence
translation tasks for 2 days (out of 7 days), at a cost up to $100 (out of $600 max), and expects the quality of the translation to reach at least 40% of domain expert quality. Table 1 presents these after normalization between [0 − 1]. We setk = 3.
A strategys is suitable to be recommended to d, if s.quality ≥ d.quality AN D s.cost ≤ d.cost AN D s.latency ≤ d.latency. Estimating the parameters s.quality, s.cost, s.latency for each s and deployment d requires accounting for the worker pool and their skills who are available to
un-dertake tasks ind. A simple yet reasonable approach to that is to first match task types in a deployment request with workers’ skills to select a pool of workers. Following that, we account for worker availabilityfrom this selected pool, since the deployed tasks are to be done by those workers. Thus, the (estimated) quality, cost and latency of a strategy for a task is a function
of worker availability, considering a selected pool of workers who are suitable for the tasks.
Worker Availability: Worker availability is a discrete random variable and is represented by its corresponding
distribution function (pdf ), which gives the probability of
the proportion of workers who are suitable and available
to undertake tasks of a certain type within a specified time d.latency (refer to Example 1). This pdf is computed from his-torical data on workers’ arrival and departure on a platform. StratRec computes the expected value of this pdf to represent the available workforceW , as a normalized value in [0, 1]. In the remainder of the paper, worker availability stands for
worker availability in expectation, unless otherwise
speci-fied. How to accurately estimate worker availability is an
interesting yet orthogonal problem and not our focus here.
2.2
Illustration of StratRec
StratRec is an optimization-driven middle layer that sits
be-tween requesters, workers, and platforms. At any time, a
crowdsourcing platform has a batch ofm deployment
re-quests each with its own parameters as defined above,
com-ing from different requesters.StratRec is composed of two
main modules -Aggregator and Alternative Parameter
Rec-ommendation (or ADPaR).
For the purpose of illustration, continuing with Example 1, S consists of the set of 4 deployment strategies, as shown in
Figure 2:COL-CRO, SEQ-IND-CRO, IND-CRO,
SIM-IND-HYB. To ease understanding, we name them ass1,s2,s3,
s4, respectively.
These requests, once received byStratRec, are sent to the Aggregator. First, it analyzes the Worker Pool to estimate worker availability. There is a 50% probability of having 700
workers and a 50% probability of having 900 workers out of
1000 suitable workers for sentence translation tasks available
for the next 7 days. Thus, the expected worker availabilityW is 0.8. After that, it consults the Deployment Strategy Model-ing in Batch Deployment module to estimate the quality, cost, and latency of a strategy (more in Section 3.1) for a
deploy-ment. Since all deployments are of the same type, Equation 4,
could be used to estimate those Strategy parameters (also
presented in Table 1). Then, it consults theWorkforce Require-ment Computation to estimate the workforce requireRequire-ment of each strategy (more in Section 3.2 and Figure 3). Finally, the Optimization Guided Batch Deployment (refer to Section 3.3) is invoked to select a subset of requests that optimizes the
underlying goal and recommendsk strategies for each. Each unsatisfied requestdi is sent toADPaR that recommends an alternative deploymentdi0to the requester for which there existk deployment strategies.
Using Example 1, out of the three deployment requests,
English Text
Final French Text
Worker-1 French Text
...
Worker-n French Text (a) SEQ-IND-CRO English Text French Text Worker-1... Worker-n (b) SIM-COL-CRO English Text Evaluation Best French Translation Worker-1 French Text ... Worker-n French Text (c) SIM-IND-CRO English Text Evaluation Best French Translation Worker-1 French Text ... Worker-n French Text Automatic Translation (French Text) (d) SIM-IND-HYBFigure 2: Deployment Strategies or pay-off objective) ands2,s3,s4are recommended.d1and
d2are then sent toADPaR one by one.
2.3
Problem Definitions
Problem 1. Batch Deployment Recommendation:
Given an optimization goalF , a set S of strategies, a batch of m deployment requests from different requesters, where the i-th task deploymentdi is associated with parametersdi.quality,
di.cost and di.latency, and worker availability W , distribute
W among these requests by recommending k strategies for each request, such thatF is optimized.
The high level problem optimization problem could be for-malized as:
MaximizeF =X fi
s.t.Xw~i ≤W AND di is successful
(1)
wherefi is the optimization value of deploymentdi and ~
wi is the workforce required to successfully recommendk
strategies it. A deployment requestdi is successful, if for each of thek strategies in the recommended set of strategies Si
d, the following three criteria are met:s.cost ≤ di.cost, s.latency ≤ di.latency and s.quality ≥ di.quality.
Using Example 1,d3is successful, as it will returnS 3
d =
{s2, s3, s4}, such thatd3.cost ≥ s4.cost ≥ s3.cost ≥ s2.cost
&d3.latency ≥ s4.latency ≥ s3.latency ≥ s2.latency &
d3.quality ≤ s4.quality ≤ s3.quality ≤ s2.quality, and it
could be deployed with the available workforceW = 0.8.
In this work,F is designed to maximize one of two different platform centric-goals: task throughput and pay-off.
Throughput maximizes the total number of successful
strat-egy recommendations without exceedingW . Formally,
Maximize m X i=1 xi s.t.X xi ×w~i ≤W xi =
1 di.cost ≤ sj.cost AND di.latency ≤ sj.latency AND
di.quality ≥ sj.quality AND
|Sid|= k, ∀i = 1, . . . ,m; j = 1, . . . , |S|
0 otherwise
(2)
Pay-off maximizesdi.cost, if di is a successful deployment request without exceedingW . The rest of the formulation is akin to Equation 2.
Problem 2. Alternative Parameter Recommendation:
Given a deploymentd, worker availability W , a set of de-ployment strategies S, and a cardinality constraintk, ADPaR
recommends an alternative deploymentd0and associatedk
strategies, such that, the Euclidean distance (`2) betweend and
d0
is minimized.
Formally, our problem could be stated as a constrained opti-mization problem:
min (d0.cost − d.cost )2
+ (d0.latency − d.latency)2 + (d0.quality − d.quality)2 s.t. | S | X j=1 xj = k xj =
1 d0.cost ≤ sj.cost AND d0.latency ≤ s j.latency AND d0.quality ≥ s j.quality 0 otherwise (3)
Based on Example 1, ifADPaR takes the following input
valuesd1:(0.4, 0.17, 0.28) and S. For d1, the alternative
rec-ommendation should be(0.4, 0.5, 0.28) with three strategies s1, s2, s3.
3
DEPLOYMENT RECOMMENDATION
We describe our proposed solution forBatch Deployment
Recommendation (Problem 1). Givenm requests and W , the
Aggregator invokes BatchStrat, our unified solution to solve the batch deployment recommendation problem. There are
three major steps involved.BatchStrat first obtains model parameters of a set of candidate strategies (Section 3.1),
then computes workforce requirement to satisfy these
re-quests (Section 3.2), and finally performs optimization to
select a subset ofm deployment requests, such that differ-ent platform-cdiffer-entric optimization goals could be achieved
(Section 3.3).
We first provide an abstraction that serves the purpose
of designingBatchStrat. Given m deployment requests and
W workforce availability, we intend to compute a two
di-mensional matrixW, where there are |S | columns that map
to available deployment strategies andm rows of different deployment requests. Figure 3a shows the matrix built for
Example 1. A cellwij in this matrix estimates the workforce required to deployi-th request using j-th strategy. This ma-trixW is crucial to enable platform centric optimization for batch deployment.
3.1
Deployment Strategy Modeling
BatchStrat first performs deployment strategy modeling to estimate quality, cost, latency of a strategys for a given de-ployment requestd. As the first principled solution, it models these parameters as a linear function of worker availability,
from the filtered pool of workers whose profiles match tasks
in the deployment request1. Therefore, ifd is deployed us-ing strategys, the quality parameter of this deployment is modeled as:
sd.quality = αqds.(wqds) + βqds (4)
Our experimental evaluation (Table 6) in Section 5.1,
per-formed on AMT validates this linearity assumption with 90%
statistical significance for two text editing tasks.
Model parametersα and β are obtained for every s, d,
and parameter (quality, cost, latency) combination, by fitting
historical data to this linear model. Once these parameters
are known,BatchStrat uses Equation 4 again to estimate
workforce requirementwqdsto satisfy quality threshold (cost and latency like-wise) for deploymentd using strategy s. We repeat this exercise for eachs ∈ S, which comprises our set of candidate strategies for a deploymentd.
1
We note thatStratRec could be adapted for tasks that do not exhibit
such linear relationships.
3.2
Workforce Requirement Computation
The goal of theWorkforce Requirement Computation is to
estimate workforce requirement per (deployment, strategy)
pair. It performs that in two sub-steps, as described below. (1) Computing Matrix W: The first step is to compute W, wherewi, j represents the workforce requirement of deploy-ingdiwith strategysj. Recall that in Equation 4, as long as for a deploymentdi, the deployment parameters on quality, cost, and latency, i.e.,di.quality, di.cost and di.latency are known, for a strategy,sj, we can computewi, j, i.e., that is the mini-mum workforce needed to achieve those thresholds, by
con-sidering the equality condition, i.e.,sj.quality = di.quality (similarly for cost and latency), and solving Equation 4 for w, with known (α, β) values. Using Example 1, the table in
Figure 3a shows the rows and columns of matrixW and
how a workforce requirement could be calculated forw11.
Basically, once we solve the workforce requirement of
qual-ity, cost, and latency(wqij,wcij,wlij), the overall workforce requirement of deployingdi usingsjis the maximum over these three requirements. Formally, they could be stated as
follows: wij = Max
di.quality = αqijwqij+ βqij
di.cost = αcijwcij+ βcij
di.latency = αlijwlij + βlij
Using Example 1,w11is the maximum over{wq11, wc11, wl11}.
Figure 3a shows howw11needs to be computed for
deploy-mentd1and strategys1for the running example.
Running Time: Running time of computing W isO (m|S|),
since computing each cellwijtakes constant time.
(2) Computing Workforce Requirement per Deploy-ment: For a deployment requestdi to be successful, Batch-Strat has to find k strategies, such that each satisfies the deployment parameters. In step (2), we investigate how to
make compute workforce requirement for allk strategies,
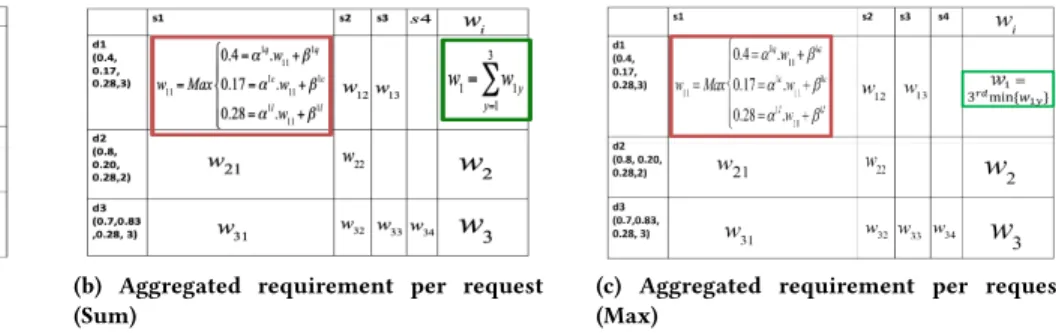
for eachdi. The output of this step produces a vectorW~ of lengthm, where the i-th value represents the aggregated workforce requirement for requestdi. Computing ~W requires understanding of two cases:
• Sum-case: It is possible that the task designer intends to perform the deployment using allk strategies. There-fore, the minimum workforce (wi) needed to satisfy cardinality constraintki isΣk
y=1wiy (wherewiyis the y-th smallest workforce value in row i of matrix W.
• Max-case: The task designer intends to only deploy
one of thek recommended strategies - in that case,
wi = wiy, (wherewiy is thek-th smallest workforce value in rowi of matrix W).
Figures 3b and 3c represent how ~W is calculated considering sum-case and max-case, respectively.
(a) Requirement for (d1, s1) (b) Aggregated requirement per request
(Sum)
(c) Aggregated requirement per request (Max)
Figure 3: Computing Workforce Requirement Running Time: The running time of computing the
ag-gregated workforce requirement of thei-th deployment
re-quest isO (|S|kloд|S|), if we use min-heaps to retrieve the k smallest numbers. The overall running time is again O (mk loд|S|).
3.3
Optimization-Guided Batch
Deployment
Finally, we focus on the optimization step of BatchStrat,
where, given ~W , the objective is to distribute the available
workforceW among m deployment requests such that it
op-timizes a platform-centric goalF . Since W can be limited, it may not be possible to successfully satisfy all deployment
requests in a single batch. This requires distributingW ju-diciously among competing deployment requests and
satis-fying the ones that maximize platform-centric optimization
goals, i.e., throughput or pay-off.
At this point, a keen reader may notice that the batch
deployment problem bears a resemblance to a well-known
discrete optimization problem that falls into the general
cat-egory of assignment problems, specifically, Knapsack-type
of problems [10]. The objective is to maximize a goal (in
this case, throughput or pay-off ), subject to the capacity
constraint of worker availabilityW . In fact, depending on the nature of the problem, the optimization-guided batch
deployment problem could become intractable.
Intuitively, when the objective is only to maximize
through-put (i.e., the number of satisfied deployment requests), the
problem is polynomial-time solvable. However, when there
is an additional dimension, such as pay-off, the problem
becomes NP-hard problem, as we shall prove next.
Theorem 1. The Pay-Off maximization problem is
NP-hard [33].
Our proposed solution bears similarity to the greedy
ap-proximation algorithm of the Knapsack problem [14]. The
ob-jective is to sort the deployment strategies in non-increasing
order of fi
~ wi
. The algorithm greedily adds deployments based
on this sorted order until it hits a deploymentdi that can no longer be satisfied byW , that is, Σi=1..xdi > W . At that step, it chooses the better of{d1, d2, di−1} anddi and the
pro-cess continues until no further deployment requests could
be satisfied based onW . Lines 4 − 8 in Algorithm BatchStrat describe those steps.
Running Time: The running time of this step is domi-nated by the sorting time of the deployment requests, which
isO (m loдm).
Algorithm 1 Algorithm BatchStrat
1: Input:m deployment requests, S, objective function F ,
available workforceW
2: Output: recommendations for a subset of deployment
requests.
3: Estimate model parameters for each (strategy, deploy-ment) pair.
4: Compute Workforce Requirement MatrixW
5: Compute Workforce Requirement per Deployment
Vec-tor ~W
6: Compute the objective function value fiof each deploy-ment requestdi
7: Sort the deployment requests in non-increasing order of
fi ~ wi
8: Greedily add deployments until we hitdi, such that Σi=1..xdi > W
9: Pick the better of{d1, d2, di−1} anddi
3.3.1 Maximizing Throughput. When task throughput is
maximized, the objective functionF is computed simply by
counting the number of deployment requests that are
satis-fied by theAggregator. Therefore,fi, the objective function value of deploymentdi is the same for all the deployment re-quests and is 1. Our solution,BatchStrat-ThroughPut, sorts the deployment requests in increasing order of workforce
requirementw~ito make 1
~ wi
non-increasing. Other than that,
(a) Deployment parameters in 3-D space
(b) Projection ofd0 on (L, Q)
plane
Figure 4: ADPaR
Theorem 2. Algorithm BatchStrat-ThroughPut gives an
exact solution to the problem [33].
3.3.2 Maximizing Pay-Off. Unlike throughput, when pay-off
is maximized, there is an additional dimension involved that
is different potentially for each deployment request.fi for deployment requestdiis computed usingdi.cost, the amount of payment deploymentdi is willing to expend. Other than that, the rest of the algorithm remains unchanged.
Theorem 3. Algorithm BatchStrat-PayOff has a
1/2-approximation factor [33].
4
ADPAR
We discuss our solution to theADPaR problem, that takes a deploymentd and strategy set S as inputs, and is designed to recommend alternative deployment parametersd0to opti-mize the goal stated in Equation 3 (Section 2.3), such thatd0 satisfies the cardinality constraint ofd.
Going back to Example 1 with the requestd2,StratRec
there is no strategy that satisfiesd2(refer to Figure 4a).
At a high level,ADPaR bears a resemblance to Skyline and Skyband queries [8, 16, 27] - but as we describe in Section 6, there are significant differences between these two problems
- thus the former solutions do not adapt to solveADPaR. Sim-ilarly,ADPaR is significantly different from existing works on query refinement [2, 11, 24, 25], that we further delineate
in Section 6.
4.1
Algorithm ADPaR-Exact
Our treatment is geometric and exploits the monotonicity
of our objective function (Equation 1 in Section 2.3). Even
though the original problem is defined in a continuous space,
we present a discretized technique that is exact.
ADPaR-Exact, employs three sweep-lines [9], one for each parameter, quality, cost, and latency and gradually relaxes the
parame-ters to produce the tightest alternative parameparame-ters that admit k strategies. By its unique design choice, ADPaR-Exact is empowered to select the parameter that is most suitable to
optimize the objective function, and hence, produces exact
solutions toADPaR.
ADPaR-Exact has four main steps. Before getting into those details, we present a few simplifications to the
prob-lem for the purpose of elucidation. As we have described
before, we normalize quality, cost, latency thresholds of a
deployment or of a strategy in [0, 1], and inverse quality to (1 − quality). This step is just for unification, making our
treatment for all three parameters uniform insideADPaR,
where smaller is better, and the deployment thresholds are
considered as upper-bounds. With this, each strategy is a
point in a 3-dimensional space and a deployment parameter
(modulo its cardinality constraint) is an axis-parallel
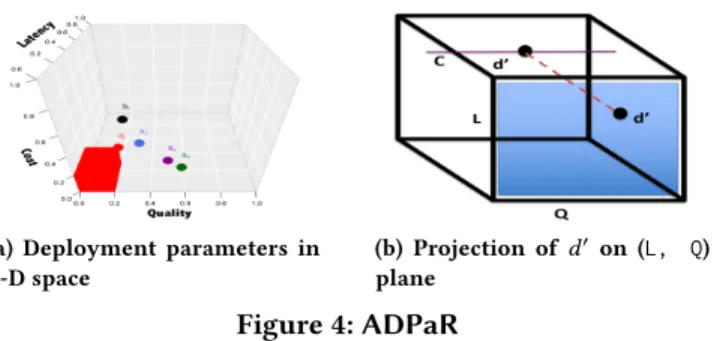
hyper-rectangle[9] in that space. Consider Figure 4a that shows the
4 strategies in Example 1 andd2as a hyper-rectangle.
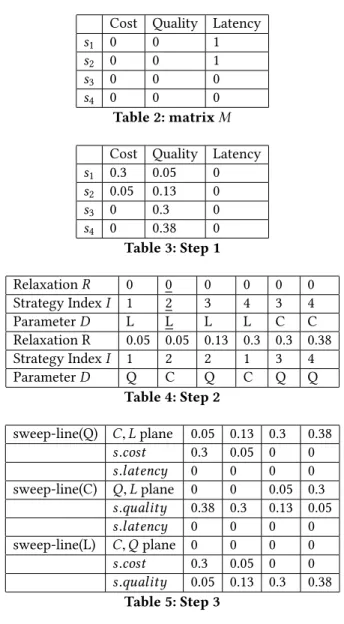
Step-1 of ADPaR-Exact computes the relaxation
(incre-ment) that a deployment requires to satisfy a strategy among
each deployment parameter. This is akin to computingsi.cost− d2.cost (likewise for quality and latency) and when the
strat-egy cost is smaller than the deployment threshold, it shows
no relaxation is needed - hence we transform that to 0. The
problem is studied for quality, cost, and latency (referred to
asQ, C, L) (Table 3). It also initializesd0= {1, 1, 1}, the worst possible relaxation.
Step-2 ofADPaR-Exact involves sorting the strategies based on the computed relaxation values from step-1 in an
increas-ing order across all parameters, as well as keepincreas-ing track of
the index of the strategies and the parameters of the
relax-ation values. The sorted relaxrelax-ation scores are stored in list R, the corresponding I data structure provides the strategy index, andD provides the parameter value. In other words, R[j] represents the j-th smallest relaxation value, where I[j] represents the index of the strategy andD[j] represents the parameter value corresponding to that. A cursorr is initial-ized to the first position inR (Table 4). Another data structure, a boolean matrixM of size |S| ×3 (Table 2) is used that keeps track of the number of strategies that are covered by the
cur-rent movement of cursorr in list R. This matrix is initialized to 0 and the entries are updated to 1, asr advances.
Step-3 involves designing three sweep-lines alongQ, C, and L (Table 5). A sweep line is an imaginary vertical line which is swept across the plane rightwards. TheQ sweep-line sorts theS in C L plane in increasing order of Q (the other two
works in a similar fashion).ADPaR-Exact sweeps the line
as it encounters strategies, in order to discretize the sweep.
At the beginning, each sweep-line points thek-th strategy alongQ, C, L, respectively.d0is updated and contains the currentQ, C, L value i..e,d0.quality = Q, d0.cost = C, and d0.latency = L. Cursor r points to the smallest of these three
values in R. MatrixM is updated to see what parameters of which strategies are covered so far.
At step-4,ADPaR-Exact checks if the current d0coversk strategies or not. This involves reading throughI and check-ing if there existsk strategies such that for each strategy s.quality ≤ d0.quality and s.cost ≤ d0.cost and s.latency ≤
d0.latency. If there are not k such strategies, it advances r to
the next position and resetsd0= {1, 1, 1} again.
If there are more thank strategies, the new d0, however, does not ensure that it is the tightest one to optimize
Equa-tion 3. Therefore,ADPaR-Exact cannot halt. ADPaR-Exact
needs to check if there exists anotherd 00
that still coversk strategies better thand0. This can indeed happen as we are dealing with a 3-dimensional problem and these three values
in combination determine the objective function.
ADPaR-Exact takes a turn in considering the current val-ues of each parameter based ond0, and creates a projec-tion on the corresponding 2-D plane, for the fixed value of
the third parameter. Figure 4b shows an example in (Q, L) plane for a fixed cost. It then considers all strategies whose s.cost ≤ d0.cost. After that, it finds the largest expansion
among the two parameters such that this newd
00
coversk strategies. This gives rise to three new deployment
parame-ters,d 00 C,d 00 Q,d 00
L. It chooses the best of these three and updates d0. At this point, it checks ifM has k strategies covered. If it
does, it stops processing and returns the newd0and thek strategies. If it does not, it advances the cursorr to the right.
Using Example 1, the alternative parameters are(0.75, 0.5, 0.28) for d2ands1, s2, s3are returned.
Lemma 1. To coverk strategies, d0needs to be initialized at least to thekthsmallest values on each paramete [33].
Lemma 2. Going by the relaxation value and parameter
order ofR and D, it ensures the tightest increase in the objective function in ADPaR-Exact [33].
Theorem 4. ADPaR-Exact produces an exact solution to the ADPaR problem [33].
Running Time: Step-1 of Algorithm ADPaR-Exact takes O (|S|). Step-2 and 3 are dominated by sorting time, which takesO (|S| loд|S|). Step-4 is the most time-consuming and takesO (|S3|). Therefore, the overall running time of the algorithm is cubic to the number of strategies.
5
EXPERIMENTAL EVALUATION
In our real-world deployments, we estimate worker
availabil-ity and demonstrate the need for optimization (Section 5.1).
In synthetic data experiments (Section 5.2), we present
re-sults to validate the qualitative and scalability aspects of our
algorithms.
5.1
Real Data Experiments
We perform two different real data experiments that involve
workers from AMT focusing on text editing tasks. The first
Cost Quality Latency
s1 0 0 1
s2 0 0 1
s3 0 0 0
s4 0 0 0
Table 2: matrixM
Cost Quality Latency
s1 0.3 0.05 0 s2 0.05 0.13 0 s3 0 0.3 0 s4 0 0.38 0 Table 3: Step 1 RelaxationR 0 0 0 0 0 0 Strategy IndexI 1 2 3 4 3 4 ParameterD L L L L C C Relaxation R 0.05 0.05 0.13 0.3 0.3 0.38 Strategy IndexI 1 2 2 1 3 4 ParameterD Q C Q C Q Q Table 4: Step 2 sweep-line(Q) C, L plane 0.05 0.13 0.3 0.38 s.cost 0.3 0.05 0 0 s.latency 0 0 0 0 sweep-line(C) Q, L plane 0 0 0.05 0.3 s.quality 0.38 0.3 0.13 0.05 s.latency 0 0 0 0 sweep-line(L) C, Q plane 0 0 0 0 s.cost 0.3 0.05 0 0 s.quality 0.05 0.13 0.3 0.38 Table 5: Step 3
experiments (Section 5.1.1) empirically validate key
assump-tions in designingStratRec. the second experiments
(Sec-tion 5.1.2) validate the effectiveness ofStratRec when com-pared to the case where no recommendation is made.
5.1.1 Validating Key Assumptions. We consider two types
of tasks: a) sentence translation (translating from English to
Hindi) and text creation (writing 4 to 5 sentences on some
topic) to validate the following questions:
1. Can worker availability be estimated and does it vary over time? We performed 3 different deployments for each task. The first deployment was done on the weekend (Friday 12am
to Monday 12am), the second deployment was done at the
beginning to the middle of the week (Monday to
Thurs-day), the last one is from the middle of the week until the
week-end (Thursday to Sunday). We design the HITs
Algorithm 2 Algorithm ADPaR-Exact for alternative de-ployment parameter recommendation
Require: S,k, W , d, k.
1: Compute relaxation valuess.quality −d.quality, s.cost − d.cost, s.latency − d.latency, ∀s ∈ S.
2: ComputeR by sorting 3|S| numbers in increasing order.
3: ComputeI and D accordingly.
4: InitializeM to all 0’s and d0= {1, 1, 1}
5: Initialize Cursorr = R[0]
6: Sort (C L) , (Q L), and (Q C) planes based on the Q, C, L sweep-lines respectively. 7: x= k-th value in ( C L), y= k-th value in ( Q L), z= k-th value in (Q C) plane 8: Updated0={x,y, z} 9: r = minimum {x,y, z} 10: Update matrixM
11: ifd0covers≥k strategies then
12: Compute the bestd
00
better thand0that coversk strategies
13: ifM covers k strategies then
14: d0= d
00
and return
15: ifM covers < k strategies then
16: mover to the right
17: ifd0covers< k strategies then
18: Mover to the right
19: Updated0’s one of the parameters by consultingR
andD
20: go back to line 10
be undertaken by a maximum number of workersx. Worker
availability is computed as the ratio of x 0
x, wherex0is the actual number of workers who undertook the task during the
deployment time (although this does not fully conform to our
formal worker availability definition, it is our sincere attempt
to quantify worker availability using public platforms). 2. How does worker availability impact deployment parame-ters? We need to be able to calculate the quality, cost, and latency, along with worker availability. Latency and cost
are easier to calculate, basically, it is the total amount of
money that was paid to workers and the total amount of
time the workers used to make edits in the document. Since
text editing tasks are knowledge-intensive, to compute the
quality of the crowd contributions, we ask a domain expert
to judge the quality completed tasks as a percentage. Once
worker availability, quality, cost, and latency are computed,
we perform curve fitting that has the best fit to the series of
data points.
3. How do deployment strategies impact different task types? We deployed both types of text editing tasks using two
differ-ent deploymdiffer-ent strategiesSEQ-IND-CRO and SIM-COL-CRO
that were shown to be effective with more than 70% of quality
Original Text
Mary had a little lamb, little lamb, little lamb,
Mary had a little lamb, its fleece was white as snow. Everywhere that Mary went, Mary went, Mary went,
Everywhere that Mary went, the lamb was sure to go.
Lavender’s blue, dilly dilly, Lavender’s green When you are king, dilly dilly, I shall be queen
Rock-a-bye, baby, in the treetop When the wind blows, the cradle will rock When the bough breaks, the cradle will fall
And down will come baby, cradle and all
Sequential -independe nt- crowd !री $ एक 'ड पाली, 'ड पाली, 'ड पाली, !री $ एक 'ड पाली सफ.द बालौ वाली. जहा5 भी !री जाती थी, जाती थी, जाती थी, जहा5 भी !री जाती थी, वो पी: आती थी. ल<=डर की नीली, गहरी नीली, ल<=डर का हरा जब आप राजा हो@ A, तो आप बBत खDश हो@ A। G रानी बनHIगी रॉक-ए-बाय, Lबी, Mीटोप O जब हवा चQगी, तो खड़खड़ाहट उठUगी जब कड़ा फVगा तो खWटया Wगर जाएगी और नीY आएगा बZचा, पालना और सब simultaneo us -collaborativ e- crowd [री \ पास एक छोटा सा !मना था, थोड़ा सा !मना, थोड़ा सा 'ड़ का बZचा, [री \ पास थोड़ा सा !मना था, उसका ऊन बफ` की तरह सफ.द था। हर जगह [री चली गई, [री चली गई, [री चली गई, हर जगह [री चली गई, !म$ का जाना Wनिcत था ल<=डर की नीली, गहरी नीली, ल<=डर का हरा जब आप राजा हो@ A, तो आप बBत खDश हो@ A। G रानी बनHIगी रॉक-ए-बाय, Lबी, Mीटोप O जब हवा चQगी, तो खड़खड़ाहट उठUगी जब कड़ा फVगा तो खWटया Wगर जाएगी और नीY आएगा बZचा, पालना और सब
Sentence Translation Tasks Results
Figure 5: Translation: Original Texts and Translation score for short texts [5]. Since our effort here was to evaluate
the effectiveness of these two strategies considering
qual-ity, cost, and latency, we did not set values for deployment
parameters and we simply observed them through
experi-mentation.
Tasks and Deployment Design: We chose three popular English nursery rhymes for sentence translation. Each rhyme
consisted of 4-5 lines that were to be translated from English
to Hindi (one such sample rhyme is shown in Figure 5). For
text creation, we considered three popular topics,Robert
Mueller Report, Notre Dame Cathedral, and 2019 Pulitzer prizes. One sample text creation is shown in Figure 6.
We designed three deployment windows at different days
of the week. Unlike micro-tasks in AMT, text editing tasks
require significantly more time to complete (we allocated 2
hours per HIT). A HIT contains either 3 sentence translation
tasks or three text creation tasks as opposed to micro-tasks,
where a HIT may contain tens of tasks. For each task type, we
validated 2 deployment strategies - inSEQ-IND-CRO, workers were to work in sequence and independently, whereas, in SIM-COL-CRO, workers were asked to work simultaneously and collaboratively. We created 2 different samples of the
same study resulting in a total of 8 HITs deployed inside the
same window. Each HIT was asked to be completed by 10
workers paid $2 each if the worker spent enough time (more
than 10 minutes). This way, a total of 80 unique workers
were hired for each deployment window, and a total of 240
workers were hired for all three deployments.
Worker Recruitment: For both task types, we recruited workers with a HIT approval rate greater than 90%. For
Strategy TOPIC TEXT Sequential - independent-crowd Robert Mueller report
The Mueller Report, formally titled the Report on the
Investigation into Russian Interference in the 2016 Presidential Election, is the official report documenting the findings of the
Special Counsel investigation, led by Robert Mueller, into Russian efforts to interfere in the 2016 United States presidential election, allegations of conspiracy or coordination between Donald Trump's presidential campaign and Russia, and allegations of obstruction of justice. The report was submitted to Attorney General William Barr on March 22, 2019. This report addressed obstruction of justice, stating it "does not conclude that the President committed a crime, [and] it also does not exonerate him”.
simultaneous - collaborative-crowd Robert Mueller report
It was a report related to United States counterintelligence investigation of the Russian government's efforts to interfere in the 2016 presidential election. As of April 2019, thirty-four individuals were indicted by Special Counsel investigators. Eight have pled guilty to or been convicted of felonies, including at least five Trump associates and campaign officials. The report concluded that Russian interference in the 2016 presidential election did occur and "violated U.S. criminal law."
Figure 6: Text Creation: Robert Mueller Report
0 0.2 0.4 0.6 0.8 1 1.2
Window-1 Window-2 Window-3
W or ke r Av ai la bi lit y Deployment-window Seq-IC Sim-CC
Figure 7:Worker Availability Estimation
sentence translation, we additionally filtered workers on
ge-ographic locations, either US or India. For text creation tasks,
we recruited US-based workers with a Bachelor’s degree. Enabling collaboration: After workers were recruited from AMT, they were directed to Google Docs where the
tasks were described and the workers were given
instruc-tions. The docs were set up in editing mode, so edits could
be monitored.
Experiment Design: An experiment is comprised of three steps. In Step-1, all initially recruited workers went through
qualification tests. For text creation, a topic (Royal
Wed-ding) was provided and the workers were asked to write
5 sentences related to that topic. For sentence translation,
the qualification test comprised of 5 sample sentences to be
translated from English to Hindi. Completed qualification
tests were evaluated by domain experts and workers with
more than 80% or more qualification scores were retained
and invited to work on the actual HITs. In Step-2, actual HITs
were deployed for 72 hours and the workers were allotted 2
hours for the tasks. In Step-3, after 72 hours of deployment,
results were aggregated by domain experts to obtain a
qual-ity score. Cost and latency were easier to calculate directly
from the raw data.
Summary of Results: Our first observation is that worker availabilitycan be estimated and does vary over time (standard error bars added). We observed that for both task
types, workers were more available during Window 2
(Monday-Thursday), compared to the other two windows. Detailed
results are shown in Figure 7.
Our second observation is that each deployment param-eter has a linear relationship with worker availability for text
editing tasks. Quality and cost increase linearly with worker
availability. Latency decreases with increasing worker
avail-ability. This linear relationship could be captured and the
parameters(α, β) could be estimated. Table 6 presents these results and the estimated(α, β) always lie within 90% confi-dence interval of the fitted line.
Our final observation is that SEQ-IND-CRO performs better thanSIM-COL-CRO for both task types. However, this difference is not statistically significant. On the other hand, SEQ-IND-CRO has higher latency. Upon further analysis, we observe that when workers are asked to collaborate and edit
simultaneously, that gives rise to an edit war and an overall
poor quality. Figure 8 presents these results.
Worker Availability and Deployment Parameters
Task-Strategy Parameters α,β TranslationSEQ-IND-CRO Quality 0.09, 0.85 Cost 1.00, 0.00 Latency −0.98, 1.40 TranslationSIM-COL-CRO Quality 0.09, 0.82 Cost 0.82, 0.17 Latency −0.63, 1.01 CreationSEQ-IND-CRO Quality 0.10, 0.80 Cost 1.00, 0.00 Latency −1.56, 2.04 CreationSIM-COL-CRO Quality 0.19, 0.70 Cost 1.00, −0.00 Latency −1.38, 1.81 Table 6:α, β Estimation
5.1.2 Validating the Effectiveness of StratRec. We are unable to ask specific user (task designer’s) satisfaction questions
in this experiment, simply because AMT does not allow to
recruit additional task designers and only workers could
be recruited. For this purpose, we deploy 10 additional
sen-tence translation (translating nursery rhymes from English
to Hindi) and 10 additional text creation tasks considering a
0.2 0.4 0.6 0.8 1 1.2 0.6 0.6 0.8 0.9 1 1 D e p lo y m e n t P a ra m e te rs Worker Availability Quality Cost Latency
(a) Translation SEQ-IND-CRO
0.2 0.4 0.6 0.8 1 1.2 0.6 0.6 0.8 0.9 1 1 D e p lo y m e n t P a ra m e te rs Worker Availability Quality Cost Latency (b) Translation SIM-COL-CRO 0.2 0.4 0.6 0.8 1 1.2 0.7 0.7 0.8 0.9 1 1 D e p lo y m e n t P a ra m e te rs Worker Availability Quality Cost Latency (c) Creation SEQ-IND-CRO 0.2 0.4 0.6 0.8 1 1.2 0.6 0.7 0.8 0.9 0.9 1 D e p lo y m e n t P a ra m e te rs Worker Availability Quality Cost Latency (d) Creation SIM-COL-CRO
Figure 8:Relationship Between Deployment Parameters and Worker Availability
0 10 20 30 40 50 60 70 80 90
StratRec Without StratRec
Sentence Translation Quality Cost Latency 0 10 20 30 40 50 60 70 80 90
StratRec Without StratRec
Text Creation
Quality Cost Latency
Figure 9:Average Quality, Cost, Latency Comparison of De-ployments with and without StratRec
We create 2 mirror deployments for the same task (one
according toStratRec recommendation and the other
with-out) resulting in a total of 40 HITs deployed. For the latter
scenario, the deployments were not recommended any
struc-ture, organization, or style and the workers were given the
liberty to complete the task the way they preferred. Each
HIT was asked to be completed by 7 workers paid $2 each
if the worker spent enough time (more than 10 minutes).
This way, a total of 280 unique workers are hired during this
experiment. The quality, cost, and latency thresholds of each
deployment are set to be 70%, $14, 72 hours.
The worker recruitment, and the rest of the experiment
design, and result aggregation steps are akin to those steps
that are described in Section 5.1.1. Figure 9 represents the
average quality, cost, and latency results of these experiments
with statistical significance.
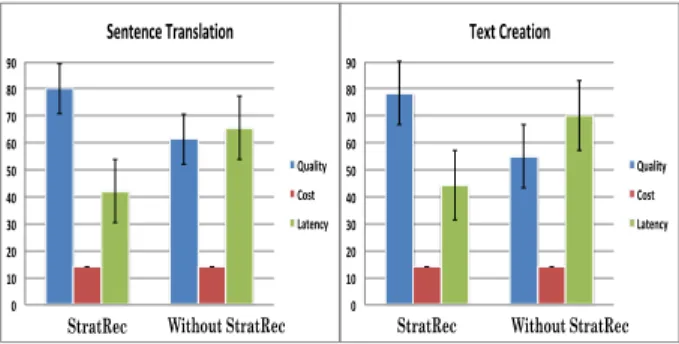
Summary of Results: We have two primary observa-tions from these experiments.Our first observation is that (Figure 9), when tasks are deployed considering
recommen-dation ofStratRec, with statistical significance, they achieve higher quality and lower latency, under the fixed cost
thresh-old on an average compared to the deployments that do not
consultStratRec. These results validate the effectiveness of deployment recommendations of our proposed framework
and its algorithms.
Our second observation (upon further investigating the Google Docs where the workers undertook tasks), is that the
deployments that do not considerStratRec recommendations
have more edits, compared to that are deployed considering StratRec. In fact, on average, StratRec deployments have an average of 3.45 edits for sentence translation, compared to 6.25 edits on average for those deployed with no recom-mendations. Indeed, when workers were not guided, they
repeatedly overrode each other’s contributions, giving rise
to an edit war.
5.2
Synthetic Experiments
We aim to evaluate the qualitative guarantees and the
scala-bility. Algorithms are implemented in Python 3.6 on Ubuntu
18.10. Intel Core i9 3.6 GHz CP U, 16GB of memory.
5.2.1 Implemented Algorithms. We describe different
algo-rithms that are implemented.
Batch Deployment Algorithms. Brute Force: An ex-haustive algorithm which compares all possible
combina-tions of deployment requests and returns the one that
opti-mizes the objective function.
BaselineG: This algorithm sorts the deployment requests in decreasing order of fi
~ wi
and greedily selects requests until
worker availabilityW is exhausted.
BatchStrat: Our proposed solution described in Section 3. ADPaR Algorithms. ADPaRB: This is a brute force algo-rithm that examines all sets of strategies of sizek. It returns the one that has the smallest distance to the task designer’s
original deployment parameters. While it returns the exact
answer, this algorithm takes exponential time to run. Baseline2: This baseline algorithm is inspired by a related work [24]. The main difference though, the related work
modifies the original deployment request by just one
param-eter at a time and is not optimization driven. In contrast, ADPaR-Exact returns an alternative deployment request, where multiple parameters may have to be modified.
Baseline3: This one is designed by modifying space par-titioning data structure R-Tree [3]. We treat each strategy
parameters as a point in a 3-D space and index them using an
R-Tree. Then, it scans the tree to find if there is a minimum
bounding box (MBB) that exactly containsk strategies. If so, it returns the top-right corner of that MBB as the alternative
deployment parameters and correspondingk strategies. If
such an MBB does not exist, it will return the top right
cor-ner of another MBB that has at leastk strategies and will randomly returnk strategies from there.
ADPaR-Exact: Our proposed solution in Section 4.
Summary of Results: Our simulation experiments
high-light the following findings:Observation 1: Our solution
BatchStrat returns exact answers for throughput optimiza-tion, and the approximation factor for pay-off maximization
is always above 90%, significantly surpassing its theoretical
approximation factor of 1/2. Observation 2: Our solution
BatchStrat is highly scalable and takes less than a second to handle millions of strategies, and hundreds of deployment
re-quests, andk. Observation 3: Our algorithm ADPaR-Exact
returns exact solutions to theADPaR problem, and signifi-cantly outperforms the two baseline solutions in objective
function value.Observation 4: ADPaR-Exact is scalable and takes a few seconds to return alternative deployment
param-eters, even when the total number of strategies is large and k is sizable.
5.2.2 Quality Experiment.
Batch Deployment Recommendation. Goal: We
val-idate the following two aspects: (i)how many deployment
requests BatchStrat can satisfy without invoking ADPaR? (ii)How does BatchStrat fare to optimize different platform-centric goals? We compare BatchStrat with the other two baselines, as appropriate.
Strategy Generation: The dimension values of a strategy are generated considering uniform and normal distributions.
For the normal distribution, the mean and standard deviation
are set to 0.75 and 0.1, respectively. We randomly pick the value from 0.5 to 1 for the uniform distribution.
Worker Availability: For a strategy, we generateα
uni-formly from an interval [0.5, 1]. Then, we set β = 1 − α to make sure that the estimated worker availabilityW is within [0, 1]. These numbers are generated in consistence with our real data experiments.
Deployment Parameters: OnceW is estimated, the qual-ity, latency, and cost - i.e., the deployment parameters, are
generated in the interval [0.625, 1]. For each experiment, 10 deployment parameters are generated, and an average of 10
runs is presented in the results.
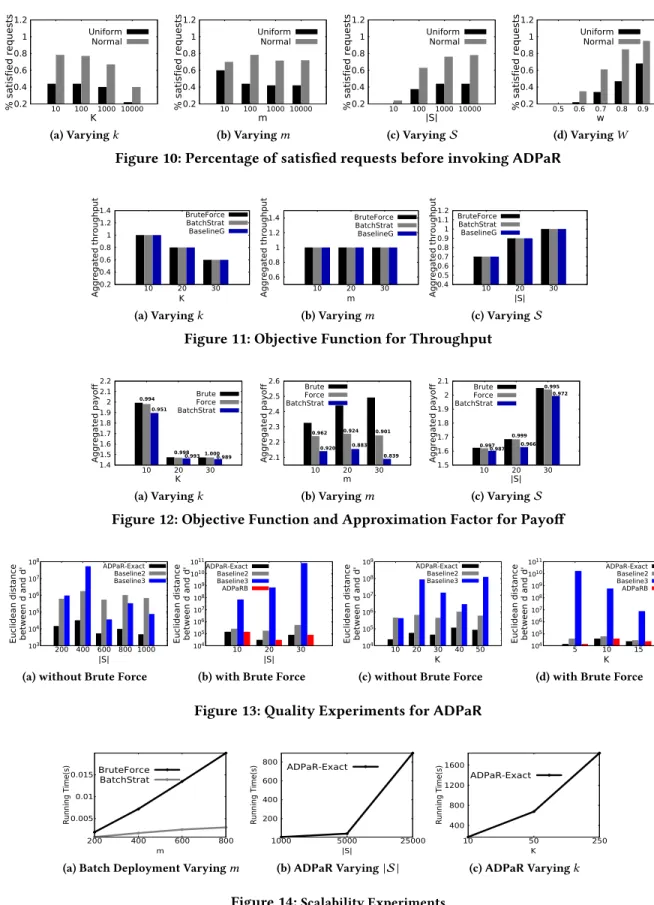
Figure 10 shows the percentage of satisfied requests by BatchStrat with varying k, m, |S|, W . In general, normal dis-tribution performs better than uniform. Upon further
analy-sis, we realize that normal distribution has a very small
stan-dard deviation, and is thereby able to satisfy more requests.
As shown in Figure 10(a), the percentage of satisfied requests
decreases with increasingk, which is expected. Contrarily, the effect of increasing batch sizem is less pronounced. This is because all requests use the same underlying distribution,
allowingBatchStrat to handle more of them. With more
strategies|S |, as Figure 10(c) illustrates,BatchStrat satisfies more requests, which is natural, because with increasing |S |, it simply has more choices. Finally, in Figure 10(d), with higher worker availabilityBatchStrat satisfies more requests. By default, we set|S |= 10000,m = 10,k = 10,W = 0.5.
Figure 11 shows the results of throughput ofBatchStrat
by varyingk, m,|S|, compare with the two baselines.
Fig-ure 12 shows the approximation factor ofBatchStrat and
BaselineG.BatchStrat achieves an approximation factor of
0.9 most of the time. For both experiments, the default values
arek = 10,m = 5, |S| = 30,W = 0.5 because brute force
does not scale beyond that.
Alternative Deployment Recommendation ADPaR. The goal here is to measure the objective function. Since ADPaRB takes exponential time, to be able to compare with this, we set|S |= 20, k = 5,W = 0.5 for all the quality exper-iments that has to compare with the brute force. Otherwise,
the default values are|S |= 200, k = 5.
In Figure 13, we vary|S | andk and plot the Euclidean distance betweend and d0(smaller is better). Indeed, ADPaR-Exact returns exact solution always. The other two baselines perform significantly worse, whileBaseline 3 is the worst. That is indeed expected, because these two baselines are not
optimization guided, and does not satisfy our goal.
Natu-rally, the objective function decreases with increasing|S |, because more strategies mean smaller change ind0, making the distance betweend and d0smaller. As the results depict, optimal Euclidean distance betweend and d0increases with increasingk, which is also intuitive, because, with higher k value, the alternative deployment parameters are likely to
have more distance from the original ones.
5.2.3 Scalability Experiments. Our goal is to evaluate the running time of our proposed solutions. Running time is
measured in seconds. We present a subset of results that are
representative.
Batch Deployment Recommendation. Since the BaselineG
has the same running time as that ofBatchStrat (although
qualitatively inferior), we only compare the running time
betweenBrute Force andBatchStrat. The default setting
0.2 0.4 0.6 0.8 1 1.2 10 100 1000 10000 % s a ti sf ie d r e q u e st s K Uniform Normal (a) Varyingk 0.2 0.4 0.6 0.8 1 1.2 10 100 1000 10000 % s a ti sf ie d r e q u e st s m Uniform Normal (b) Varyingm 0.2 0.4 0.6 0.8 1 1.2 10 100 1000 10000 % s a ti sf ie d r e q u e st s |S| Uniform Normal (c) Varying S 0.2 0.4 0.6 0.8 1 1.2 0.5 0.6 0.7 0.8 0.9 % s a ti sf ie d r e q u e st s w Uniform Normal (d) VaryingW
Figure 10: Percentage of satisfied requests before invoking ADPaR
0.2 0.4 0.6 0.8 1 1.2 1.4 10 20 30 A g g re g a te d t h ro u g h p u t K BruteForce BatchStrat BaselineG (a) Varyingk 0.6 0.8 1 1.2 1.4 10 20 30 A g g re g a te d t h ro u g h p u t m BruteForce BatchStrat BaselineG (b) Varyingm 0.4 0.5 0.6 0.7 0.8 0.9 1 1.1 1.2 10 20 30 A g g re g a te d t h ro u g h p u t |S| BruteForce BatchStrat BaselineG (c) Varying S
Figure 11: Objective Function for Throughput
1.4 1.5 1.6 1.7 1.8 1.9 2 2.1 2.2 10 20 30 0.994 0.951 0.998 0.993 1.0000.989 A g g re g a te d p a y o ff K Brute Force BatchStrat (a) Varyingk 2.1 2.2 2.3 2.4 2.5 2.6 10 20 30 0.962 0.920 0.924 0.883 0.901 0.839 A g g re g a te d p a y o ff m Brute Force BatchStrat (b) Varyingm 1.5 1.6 1.7 1.8 1.9 2 2.1 10 20 30 0.997 0.987 0.999 0.966 0.995 0.972 A g g re g a te d p a y o ff |S| Brute Force BatchStrat (c) Varying S
Figure 12: Objective Function and Approximation Factor for Payoff
103 104 105 106 107 108 200 400 600 800 1000 E u cl id e a n d is ta n ce b e tw e e n d a n d d ' |S| ADPaR-Exact Baseline2 Baseline3
(a) without Brute Force
104 105 106 107 108 109 1010 1011 10 20 30 E u cl id e a n d is ta n ce b e tw e e n d a n d d ' |S| ADPaR-Exact Baseline2 Baseline3 ADPaRB
(b) with Brute Force
104 105 106 107 108 109 10 20 30 40 50 E u cl id e a n d is ta n ce b e tw e e n d a n d d ' K ADPaR-Exact Baseline2 Baseline3
(c) without Brute Force
104 105 106 107 108 109 1010 1011 5 10 15 E u cl id e a n d is ta n ce b e tw e e n d a n d d ' K ADPaR-Exact Baseline2 Baseline3 ADPaRB
(d) with Brute Force
Figure 13: Quality Experiments for ADPaR
0.005 0.01 0.015 200 400 600 800 R un ni ng T im e( s) m BruteForce BatchStrat
(a) Batch Deployment Varyingm
200 400 600 800 1000 5000 25000 R un ni ng T im e( s) |S| ADPaR-Exact (b) ADPaR Varying | S | 400 800 1200 1600 10 50 250 R un ni ng T im e( s) K ADPaR-Exact (c) ADPaR Varyingk
The first observation we make is, clearlyBatchStrat can handle millions of strategies, several hundreds of batches,
and very largek and still takes only a few fractions of seconds to run. It is easy to notice that the running time of this
problem only relies on the size of the batchm (or the number
of deployment requests), and not onk or S. As we can see
in Figure 14a,Brute Force takes exponential time with
increasingm, whereas BatchStrat scales linearly.
Alternative Deployment Recommendation. We varyk and
|S | with defaults set to 5 and 10000 respectively, and
eval-uate the running time ofADPaR-Exact. W is set to 0.5. As
Figures 14b and 14c attest, albeit non-linear,ADPaR-Exact scales well withk and |S|. We do not present the baselines as they are significantly inferior in quality.
6
RELATED WORK
Crowdsourcing Deployment: Till date, the burden is en-tirely on the task requester to design appropriate
deploy-ment strategies that are consistent with the cost, latency,
and quality parameters of task deployment. A very few
re-lated works [1, 35] have started to study the importance
of appropriate deployment strategies but these works do
not propose an algorithmic solution and are limited to
em-pirical studies. A recent work [13] presents the results of
a 10-month deployment of a crowd-powered system that
uses a hybrid approach to fast recruitment of workers, called Ignition. These results suggest a number of opportunities to deploy work in the online job market.
Crowdsourcing Applications: A number of interactive crowd-powered systems have been developed to solve
diffi-cult problems and develop applications [4, 7, 12, 18–20, 23, 28,
31]. For instance, Soylent uses the crowd to edit and
proof-read text [4]; Chorus recruits a group of workers to hold
sophisticated conversations [22]; and Legion allows a crowd
to interact with a UI-control task [21]. A primary challenge
for such interactive systems is to decrease latency without
having to compromise with the quality. A comprehensive
sur-vey on different crowdsourcing applications could be found
at [34]. All crowd-powered systems share these challenges
and are likely to benefit fromStratRec.
Query planning and Refinement: The closest analogy of deployment strategy recommendation is recommending
the best query plan in relational databases, in which joins,
selections and projections could be combined any number
of times. Typical parametric query optimization problems,
like [15], only focus on one objective to optimize. Afterward,
multi-objective problems have been studied, with a focus on
optimizing multiple objectives at the same time [32]. Our
work borrows inspiration from that and studies the problem
in the deployment context, making the challenges unique
and different from traditional query planning.
Query reformulation has been widely studied in
Informa-tion Retrieval [11]. In [24], authors take users’ preference
into account and propose an interactive method for seeking
an alternative query which satisfies cardinality constraints.
This is different fromADPaR since it only relaxes one dimen-sion at a time. Aris et al. [2] proposed a graph modification
method to recommend queries that maximize an overall
util-ity. Mottin et al. [25] develop an optimization framework
where solutions can only handle Boolean/categorical data.
Skyline and Skyband Queries: Skyline queries play an essential role in computing favored answers from a
data-base [6, 8]. Based on the concepts of skylines, other classes
of queries arise, especially top-k queries and k-skyband prob-lems which aim to bring more useful information than
origi-nal skylines. Mouratidis et al. [26, 27] study several related
problems. In [26], sliding windows are used to track the
records in dynamic stream rates. In [27], a geometry
arrange-ment method is proposed for top-k queries with uncertain
scoring functions. Because our problem seeks the optimal
group ofk strategies, it is similar to the top-k queries problem.
However, unlike Skyband or any other related work,ADPaR
recommends alternative deployment parameters. Thus, these
solutions do not extend to solveADPaR.
7
CONCLUSION
We propose an optimization-driven middle layer to
recom-mend deployment strategies. Our work addresses multi-faceted
modeling challenges through the generic design of modules
inStratRec that could be instantiated to optimize different types of goals by accounting for worker availability. We
de-velop computationally-efficient algorithms and validate our
work with extensive real data and synthetic experiments.
This work opens up several important ongoing and future
research directions. As an ongoing investigation, we are
de-ploying additional types of tasks usingStratRec to evaluate its effectiveness. Our future investigation involves adapting
batch deployment to optimize additional criteria, such as
worker-centric goals, or to combine multiple goals inside
the same optimization function. Understanding the
computa-tional challenges of such an interactive system remains to be
explored. Finally, how to designStratRec for a fully dynamic stream-like setting of incoming deployment requests, where
the deployment requests could be revoked, remains to be an
important open problem.
ACKNOWLEDGMENTS
The work of Dong Wei and Senjuti Basu Roy are supported by
the National Science Foundation, CAREER Award #1942913,
IIS #1814595, and by the Office of Naval Research Grant No:
![Figure 5: Translation: Original Texts and Translation score for short texts [5]. Since our effort here was to evaluate the effectiveness of these two strategies considering qual-ity, cost, and latency, we did not set values for deployment parameters and w](https://thumb-eu.123doks.com/thumbv2/123doknet/14363083.502961/10.918.490.820.136.459/translation-original-translation-effectiveness-strategies-considering-deployment-parameters.webp)