A Client-Server Software Application for
Statistical Analysis of fMRI Data
by
Vijay Singh Choudhary
Bachelor of Technology in Civil Engineering,
Indian Institute of Technology Bombay (2002)
Submitted to the Department of Civil and Environmental Engineering
in partial fulfillment of the requirements for the degree of
Master of Science
at the
MASSACHUSETTS INSTITUTE OF TECHNOLOGY
June 2004
@
2004 Massachusetts Institute of Technology. All rights reserved.
Author ...
...
Dwartment of Civil an) Environmental Engineering
May 7, 2004
Certified by..
...
Randy Gollub
Affiliated Faculty of Harvard-MIT Division of Health Sciences and
Technology
Thesis Supervisor
C ertified by ..---
...
Steven R. Lerman
Director of Center for Educational Computing Initiatives and
Prpfessor of CivA and Envjonmental Engineering
Thesis Supervisor
Accepted by ..
...
Heidi M. Nepf
Chairman, Committee for Graduate Students
MASSACHUSETTS INSTM.TE
BARKER
OF TECHNOLOGY
JUN
O
7 2004
A Client-Server Software Application for Statistical Analysis
of fMRI Data
by
Vijay Singh Choudhary
Submitted to the Department of Civil and Environmental Engineering
on May 7, 2004, in partial fulfillment of the
requirements for the degree of Master of Science
Abstract
Statistical analysis methods used for interrogating functional magnetic resonance imaging (fMRI) data are complex and continually evolving. There exist a scarcity of educational material for fMRI. Thus, an instructional based software application was developed for teaching the fundamentals of statistical analysis in fMRI.
For wider accessibility, the application was designed with a client/server archi-tecture. The Java client has a layered design for flexibility and a nice Graphical User Interface (GUI) for user interaction. The application client can be deployed to multiple platforms in heterogeneous and distributed network. The future possi-bility of adding real-time data processing capabilities in the server led us to choose CGI/Perl/C as server side technologies. The client and server communicates via a simple protocol through the Apache Web Server. The application provides students with opportunities for hands-on exploration of the key concepts using phantom data as well as sample human fMRI data. The simulation allows students to control rele-vant parameters and observe intermediate results for each step in the analysis stream (spatial smoothing, motion correction, statistical model parameter selection etc.). Eventually this software tool and the accompanying tutorial will be disseminated to researchers across the globe via Biomedical Informatics Research Network (BIRN) portal.
Thesis Supervisor: Randy Gollub
Title: Affiliated Faculty of Harvard-MIT Division of Health Sciences and Technology Thesis Supervisor: Steven R. Lerman
Title: Director of Center for Educational Computing Initiatives and Professor of Civil and Environmental Engineering
Acknowledgments
First and foremost, I would like to extend my sincerest thanks to my advisors, Randy Gollub and Steven Lerman, for all their help and support during the project. This work has been made possible only with their continual guidance and encouragement over past one year. Randy helped me a lot in learning the fMRI and neuroscience domain knowledge throughout the course of project. Regular counselling and sugges-tions from Steve were of great help. I would also like to thank Rick Hoge, my project co-advisor, who assisted me greatly with the implementation, specially on the server side.
I would like to thank Ian Lai, the predecessor of the project, who was always available whenever I had technical difficulties in design or implementaion.
I sincerely thank all my colleagues and staff at Center for Educational Computing
Initiatives (CECI), MIT for providing me a very professional working environment. Specially, I am grateful to Mesrob Ohannessian who helped me alot in understanding image processing concepts and Jed Northridge for his help, whenever needed.
I would like to thank my friends for making my stay at MIT enjoyable as well as my family, for their constant support. I must also thank Greg Llacer for assisting with the administrative portions of the project.
Finally, I thank Harvard-MIT division of Health Sciences and Technology for sup-porting this project through VaNTH educational initiative, with grants from National Science Foundation (NSF).
Contents
1 Introduction 8
1.1 M otivations . . . . 9
1.2 Aims and Objectives . . . . 10
1.3 Scope of the Work . . . . 10
1.4 Overview of the Thesis . . . . 11
2 Background on fMRI Data Acquisition and Analysis 12 2.1 Introduction: What is functional imaging of the brain? . . . . 12
2.2 Basics of fM RI . . . . 13
2.3 Applications of fMRI . . . . 14
2.4 Designing an fMRI Experiment . . . . 15
2.5 Analysis of fMRI experiments data . . . . 16
2.5.1 Pre-processing of fMRI Data . . . . 16
2.5.2 Statistical Analysis . . . . 17
2.6 Previous Work in teaching fMRI . . . . 19
2.6.1 Software packages for the analysis of fMRI data . . . . 19
2.6.2 Courses and workshops . . . . 20
3 Educational Goals and Challenges 22 3.1 Introduction . . . . 22
3.2 HPL framework . . . . 23
4 Web-based Client-Server Application 4.1 Background 4.2 Client/Server Application . . 4.2.1 Requirements . . . . . 4.2.2 Architecture . . . . 4.2.3 Platform technologies .
5 Detailed Client Design
5.1 Design Goals . . . . 5.2 User Interface . . . . 5.3 Data Abstractions . . . . 5.3.1 View Parameter . . . . . 5.3.2 Graph Data . . . . 5.4 Layered Architecture . . . .
5.4.1 Graphical User Interface
5.4.2 Main Layer . . . .
5.4.3 Data Retrieval Layer . .
5.5 Package Structure . . . .
6 Detailed Server Design
6.1 Server Architecture . . . . 6.2 Precomputation of Data . . . . 6.3 Communications Protocol . . . 6.3.1 Request Protocol . . . . 6.3.2 Response Protocol . . . (GUI) La er . . . . .
7 Conclusions and Future work
7.1 Client-Server Application . . 7.2 Future Work . . . . .. . 26
. . . . .
26 . . . . 27 27 28 32 35 35 36 39 39 39 40 42 46 48 49 51 51 55 55 56 56 61 61 62 . . . . . . . .List of Figures
3-1 The How People Learn (HPL) environment; Source [30] . . . . 24
4-1 Client/Server application architecture . . . . 30
5-1 Screenshot of Web-based Java Client for fMRI Analysis of Phantom
data (3D V iew ) . . . . 36
5-2 Screenshot of Web-based Java Client for fMRI Analysis of human brain
data (4D V iew ) . . . . 37
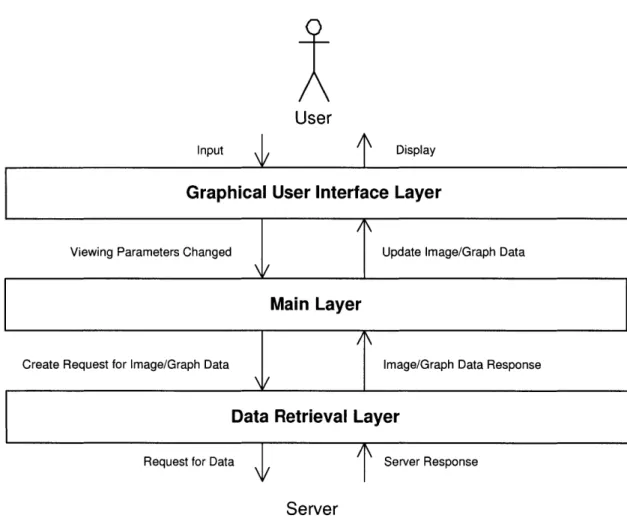
5-3 Layered architecture of web bases Java client . . . . 41
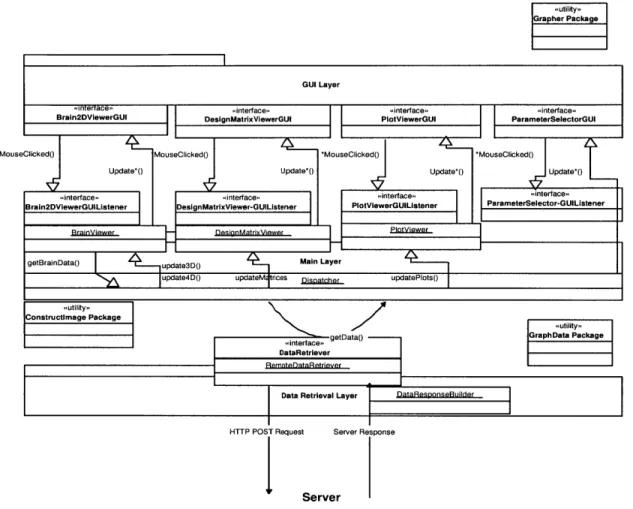
5-4 A detailed view of the communications among layers in the Web-based Java client. Interfaces are labelled as "<<interface>>, with their ac-companying implementations in adjacent boxes. Method calls are rep-resented by thin arrows; the one method which returns data, getData, loops back to the caller (called as Dispatcher). The arrows between the GUI Layer and the Main Layer represent the various Mouse Clicked and update methods. See Section 5.4.1 for the list of methods. Utility packages are labelled as "<<utility> >and are used by most of these
layers. . . . . 42
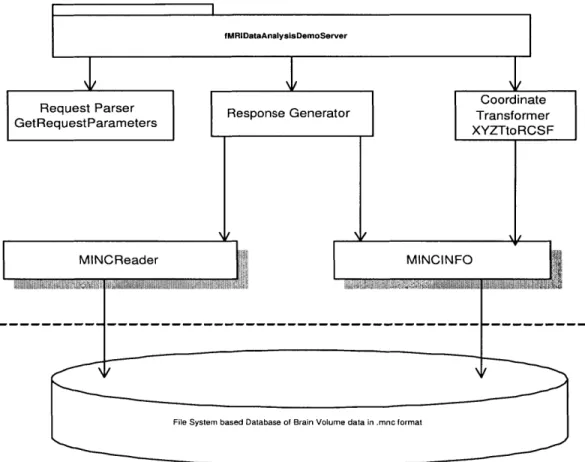
6-1 The architecture of the Web-based fMRI Data Analysis Server. Boxes
with shadow represent a C executable and the rest are CGI/Perl scripts,
and each arrow indicates a call from one script to another. . . . . 52
List of Tables
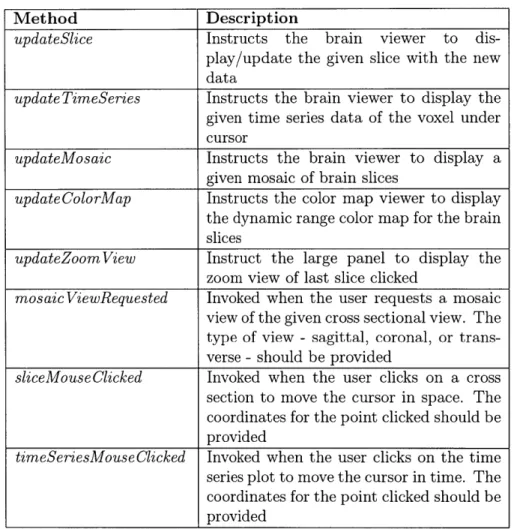
5.1 Brain2dViewerGUI methods . . . . 44
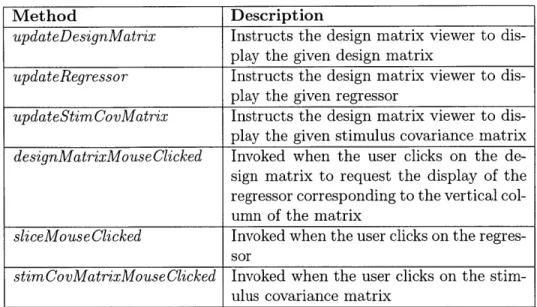
5.2 DesignMatrixViewerGUI methods . . . . 44
5.3 The list of Java packages and their description for the Web-based client 49
6.1 A list of usage statements for MINCRead program . . . . 53
6.2 The keys and the valid corresponding values for the client request . . 55
6.3 The suffixes for keys specifying the different properties of graph/data
Chapter 1
Introduction
Functional Magnetic Resonance Imaging (fMRI) is a new medical imaging technology providing functional, as opposed to anatomical, mapping of the human brain. Brain activity indications in fMRI data is based on the observation that increased neural activity leads to increases in localized cerebral blood flow, blood volume, and blood oxygenation. In fMRI this is referred to as Blood Oxygen Level Dependent (BOLD) contrast. FMRI can provide detailed images of localized brain activity with a spatial accuracy of millimeters and a temporal resolution of seconds [1]. Thus, FMRI is cur-rently one of the best techniques for studying the function of the brain regions that underlie visual perception in humans. This relatively new research tool has found widespread use in a variety of applications at the intersection of biomedical engi-neering and neuroscience, for example, mapping the boundaries between functional regions of the brain, identifying tumor margins prior to surgery, and investigating the pathology underlying diseases such as schizophrenia [2].
In a typical fMRI experiment, the signal can be overshadowed by noise, making the detection of activation-related signal changes difficult. Though, by applying statistical analysis methods to the time series of signals from each voxel in the brain permits optimal extraction of the signal of interest. This thesis describes the technical details of a Web-based software application developed to help researchers in understanding the fundamentals of statistical analysis of fMRI experiment data.
1.1
Motivations
While magnetic resonance imaging (MRI) was introduced for clinical use in the 1970s, functional magnetic resonance imaging (fMRI) was discovered only in the early 1990s [2]. Although the field of fMRI research is still relatively young, it has experienced explosive growth; in the years 1999-2001 more than 900 abstracts were submitted to the International Conferences on the Functional Mapping of the Human Brain [3]. While some investigators in the field have expertise concerning the details of fMRI data analysis, others simply apply free or commercial software packages to their data. These packages often include a multitude of parameters that can be optimized by an fMRI expert, but are rarely adjusted by others [2]. Since the packages have preset defaults that may not be appropriate for all situations, investigators lacking a proper understanding of fMRI data analysis may draw false conclusions from their data if they do not have a proper knowledge in data analysis.
Students and researchers wanting to learn more about fMRI data analysis have limited resources available to them. The most widely available resources are a few recently published textbooks [4, 5] and documentation that accompanies particular software packages. There are also a number of courses and workshops on fMRI, but these represent a limited resource that is not available to all researchers in the field. Thus, there exist a need of educational material for learning about the steps and assumptions underlying standard fMRI data analysis. Hence, we developed an on-line, interactive software application which would help students and researchers to acquire insights required to use existing software packages in an informed fashion and adapt them to their own purposes. The focus of the application is on the fundamental processing steps and parameters commonly used in fMRI data analysis. For these reasons, this educational material will be invaluable to researchers working in domain
of fMRI.
The intended audience includes advanced undergraduate and graduate students, as well as investigators who wish to use fMRI in their research but are not familiar with the methods and techniques of fMRI data analysis. This module is intended to
be a standalone source for learning about fMRI data analysis, although it may also be a useful adjunct to existing courses at various universities.
1.2
Aims and Objectives
The main objective was to develop an educational module (a software application and accompanying tutorial) to assist advanced undergraduate and graduate students in learning the fundamentals of statistical analysis of fMRI data. This module should allows students to learn about each of the steps in fMRI data analysis, pre-processing, signal to noise estimation, and statistical inference. The software application should provide students with opportunities for hands-on exploration of key concepts for each step in the analysis stream using phantom data, as well as sample human fMRI data. The accompanying tutorial should provide appropriate background materials and guidance, in order to promote exploration, understanding of key concepts and to encourage constructive use of the interactive demonstration.
Another objective was to modify the current tutorial being used in one of the labs for the course "HST.583 Functional Magnetic Resonance Imaging: Data Acquisition and Analysis" through the lens of How People Learn (HPL) framework. The HPL framework and major learning objectives of this educational module are discussed in detail in chapter 3.
1.3
Scope of the Work
The software tool and the tutorial covers the basic preprocessing steps and parameters commonly used in analysis of fMRI data, as described in detail in section 5.2. Topics such as fMRI experimental design, the physics of fMRI data acquisition, and advanced methods for data processing and analysis are beyond the scope of this module.
1.4
Overview of the Thesis
Chapter 2, Background on fMRI Data Acquisition and Analysis, builds background
on basics of fMRI, fMRI experiment design, noise issues and statistical analysis of data. Also, it presents a compiled report on available educational material for teaching
fMRI.
Chapter 3, Educational Goals and Challenges, describes the enhancements to the
tutorial motivated by How People Learn (HPL) framework, a strategy for designing effective learning environment
Chapter 4, Web-based Client-Server Application, covers the overall requirements,
architecture and platform technologies chosen for the Web-based interactive software application.
Chapter 5, Detailed Client Design, covers the details of the design decisions and
implementation of the complete client. Chapter describes some of the software de-velopment concepts being used in the current web application such as modularity, layered architecture and data abstraction.
Chapter 6, Detailed Server Design, covers the details of the server design and
im-plementation. In detail, it covers pre-processing of data, server architecture and communication protocols being used with client.
Chapter 7, Conclusions and Future Work, summarizes some of the key points of
the client/server application. Also, it suggests future scope of improvements in the application.
Chapter 2
Background on fMRI Data
Acquisition and Analysis
2.1
Introduction: What is functional imaging of
the brain?
Magnetic resonance (MR) imaging uses radio waves and a strong magnetic field to provide clear and detailed pictures of internal organs and tissues. Functional magnetic resonance imaging (fMRI) is a relatively new procedure that uses MR imaging to measure metabolic changes that take place in an active part of the brain or as a result of a stimulus. Physicians know the general areas of the brain responsible for speech, sensation, memory, and other functions. However, the exact locations can vary from individual to individual. Injuries and disease, such as stroke or brain tumor, can even cause aforementioned functions to shift to a different part of the brain. fMRI can help radiologists or physicians to determine precisely which part of the brain is handling critical functions such as thought, speech, movement, and sensation. This information can be critical to planning surgery, treatment for stroke, or other interventions to treat brain disorders.
2.2
Basics of fMRI
To understand the statistical issues inherent in fMRI, it is essential to first gain an understanding of how the imaging process itself is thought to work. In this section, author outlines the physics and biophysics underlying fMRI image acquisition.
As described by Ogawa, Lee et al. [6] "Atomic nuclei with an odd number of protons or an odd number of neutrons are affected by magnetic fields. Exposing such nuclei to a strong magnetic field will cause them to try to align themselves parallel or anti-parallel to the field. The parallel orientation has a slightly lower energy than does the anti-parallel orientation. This causes more nuclei to align themselves in the parallel orientation, which, collectively, results in an overall magnetization of the object in the field. The alignment of the nuclei isn't perfect in either direction; instead, the atoms precess about the field at a fixed frequency. "Precession" refers to the revolution of the axis of rotation of the atoms. Frequency of precession varies for each type of nucleus and is related linearly to the strength of the magnetic field. When radiofrequency energy at the frequency of precession of the nuclei is injected into the system, the level of energy increases temporarily, but then returns to equilibrium. The energy emitted in the return to the starting state is at the frequency of precession. Both the absorption and the emission of energy are therefore selective, in that only nuclei that are near the appropriate precession frequencies will be affected. This is the key aspect of resonance. It is the selective absorption and emission of energy that produce the MR (magnetic resonance) signal. Magnetic resonance imaging (MRI) involves gathering data on the precession of the atomic nuclei, resulting in high-resolution images. The strength of the signal is proportional to the number of nuclei of a specific type. Hence the method allows us to count nuclei with particular properties. MR images are typically three-dimensional, representing volumes." The images are divided into volume elements, or voxels; the amplitude of the recorded signal at each voxel in each image is the average nuclear density of the chosen element (usually hydrogen).
formation about neuronal activation in the brain during the course of a scan. While the scan is being performed, subjects may be asked to carry out various cognitive processing tasks; the images will then convey information on which regions of the brain were active and hence involved in the particular task under study. The con-nection between neuronal activation and the MR images is believed to be as follows. When resting brain neurons become active, the rate of blood flow to the neighbor-hood of these neurons increases, as glucose is delivered to the regions in question. This is known as the hemodynamic response. As the rate of firing increases for the neurons, their metabolism also increases. The increase in metabolism results in an influx of oxygenated blood to the affected region. Oxygen levels rise in the nearby blood vessels, since active neurons do not consume much more oxygen than when at rest. The magnetic properties of oxygenated and deoxygenated hemoglobin differ (as demonstrated by Pauling in 1935), and this difference affects the measured MR signal through what is called the Blood Oxygenation Level Dependent (or BOLD) effect. Hence, the MR signal from the neighborhood of a neuron should change as the concentration of oxygenated blood around the neuron changes. MR imaging is sensitive enough to detect these functionally induced changes in blood oxygenation in the human brain [6].
The idea that blood flow changes can be correlated to changes in brain function is an old one, presented as early as the end of the last century by the British physiol-ogists Roy and Sherrington (1890). They postulated the existence of an "automatic mechanism" that regulated the blood supply to the brain in a manner dependent on variations in activity [6]. Subsequent research has confirmed this hypothesis, although the exact nature of the system is still unknown. Functional magnetic resonance imag-ing (fMRI) is a step in the further understandimag-ing of this process.
2.3
Applications of fMRI
The range of applications of fMRI to neuroscience is growing rapidly. Here is the list of the some of the research areas in which fMRI is proving to be an important tool
[4]:
1. Defining neurophysiological correlates of human behavior;
2. Defining ways in which brain functions can be modulated;
3. Establishing a 'system-level' description for the brain basis of learning;
4. Defining 'networks' for cognitive processing
Other than these, fMRI is also becoming common in clinical applications as well. To list few of these general areas:
1. Mapping of the functional area in the damaged brain;
2. Providing state or trait markers (Whether underlying abnormalities are present only during periods of illness, with return to normal between episodes, or persist
independent of clinical status can be addressed through fMRI studies [7]);
3. Defining mechanism of reorganization or compensation from injury.
2.4
Designing an fMRI Experiment
In a typical fMRI scanning sequence, over a hundred successive echo-planar images (EPI) are taken at a rate of 1 every 2 to 6 seconds, which gives a total of 4 to
10 minutes for the functional part of the experiment. EPI is a type of magnetic
resonance imaging that uses only one nuclear spin excitation per image and therefore can obtain images in a fraction of a second rather than the minutes required in traditional MRI techniques. Since the FMRI measures the relative signal change over time under different stimulus conditions, a control condition is necessary to determine whether the change in the signal is due to the test stimulus condition. Because the change in the MR signal lags behind the change in neural activity by a few seconds (typically 5 sec), the duration of a condition should be in the range of 20 to 60 sec, in which 5 to 15 scans would then take place. To provide maximum contrast between the different stimulus conditions, the order of these conditions should be rotated
somewhat cyclically. Thus, the design of the stimulus should take these constraints into account. Most importantly, the stimulus display must be synchronized with the scanning sequence.
2.5
Analysis of fMRI experiments data
The goal of fMRI analysis is to detect, in a robust, sensitive, and valid way those parts of the brain which show increased intensity at the points in time that stimulation was applied. A single volume is made up of individual cuboid elements called voxels. An
fMRI dataset from a single session can either be thought of as t volumes, one taken
every few seconds, or as v voxels, each with an associated time series of t time points
[4].
The basic problem in analysis of functional imaging experiments is to identify voxels that show signal change varying with the changing brain states of interest across the serially acquired images. This becomes a challenging problem for fMRI data because the signal changes are small and the number of voxels simultaneously interrogated across the image is very large. One of the potentially most significant artifacts for fMRI that distinguishes it from other functional imaging techniques is its susceptibility to motion from the movements, either of the head or brain (e.g. with the respiratory or cardiac cycle). So the idea is to address the ways in which the data can be prepared to minimize artifacts and maximize sensitivity for the detection of activation changes. The aim of fMRI analysis is to identify in which voxels' time-series the signal of interest is significantly greater than the noise level. For this, a 4D dataset is initially pre-processed, i.e. prepared for statistical analysis.
2.5.1
Pre-processing of fMRI Data
Once fMRI data has been acquired, the preprocessing starts by reconstructing the raw 'k-space' data into images. The next step applied is slice-timing correction; because each slice in each volume is acquired at slightly different times, it necessary to adjust the data so that it appears that all voxels within one volume had been
acquired at exactly the same time. Each volume is now transformed (using rotation and translation) so that image of the brain within each volume is aligned with that in every other volume; this is known as motion correction.
After artifact removal two general approaches to maximizing the signal-to-noise ratio for the time course data then are applied typically: spatial and temporal filtering (smoothing). fMRI is being used to detect a signal change that lasts for only a limited period of time and covers just a small region of the brain. A general result of signal detection is that blurring of a signal (in this case both the dimensions of space and time need to be considered) can enhance the signal-to-noise, hopefully without significantly affecting the activation signal. Also, generally data have large number of spuriously activated voxels that appear to be sites of significant brain activation but are really just an artifact- these typically disappear with the spatial smoothing. After this, each volume's overall intensity level is adjusted so that all volumes have
the same mean intensity -this intensity normalization can help reduce the effects of
global changes in intensity over time and provide the means to compare images across subjects and sessions. Reduction in low and high frequency noise is normally desired as final step; each voxel's time series is filtered by linear or non-linear tools in order
to achieve this [4].
In our software application, we have pre-processed several complete data sets in advance so that we can have good speed of data exchange over the network. If we do the processing of data in real time, it would just add latency to the response from the server, often as much as 15 or 20 minutes. So for demonstrating the effects of pre-processing of data, we do guide the user in a way that he/she understands the basics of pre-processing, its effects and importance before doing statistical analysis.
2.5.2
Statistical Analysis
After the pre-processing steps, statistical analysis is carried out to determine which voxels are activated by the stimulation. This can be a simple correlation analysis or more advanced modeling of the expected hemodynamic response to the stimula-tion. Various possible statistical corrections can be included, such as correction for
smoothness of the measured time series at each voxel. The main output from this step is a statistical map which indicates those points in the image where the brain has activated in response to the stimulus. Mostly each voxel's time series is analyzed independently ('univariate analysis') but there are also 'multivariate' methods. For example, standard general linear model (GLM) analysis is univariate. It's not in the scope of this thesis to explain the complete GLM Analysis. There are many valid ways of performing statistical comparisons between signals in images associated with different brain states and their time courses of change. A common approach is to generate a map of t statistics (the ratio of the mean signal intensity to its standard error) on a voxel-by-voxel basis and use this to identify voxels with significance level exceeding a chosen threshold (i.e. t > 3, which might correspond in a particular case to p < 0.01).
In the current software application, we model the signal that we record from an fMRI session as a linear combination of the actual signal and the noise. With GLM analysis, we use the signal and noise as regressors, and solve for the coefficients for
the linear combination. The mathematical equation for the model is y = 13 x + e,
where y is the observed signal, x is the estimated signal, 0 is the parameter estimate for x, and e is error term that corresponds to our noise. Our application users have the option of choosing different signal and noise models for the analysis. Once analy-sis parameters are selected, user can request the results by selecting statistical maps (t-maps or p-maps) view in the module. In addition to seeing the default statistical map that shows every voxel, user can also specify a threshold such that only the activation is visible. Also, we have a module for representation of the regressors used in the analysis with the design matrix and stimulus covariance matrix. The design matrix is a visual representation of the regressors used in the analysis, and consists of one or more columns. The first column represents the paradigm convolved with the hemodynamic response function, and the subsequent columns represent polyno-mials used in detrending. The stimulus covariance matrix is necessary when testing contrasts involving multiple parameters under the general linear model.
2.6
Previous Work in teaching fMRI
Most of the currently available educational material for fMRI focuses on the physics of image acquisition and experimental design, but few resources exist for fMRI data analysis, and those that do focus primarily on theory or one specific software package
[8]. There are a few recent of text books [5, 6] that provide chapters on fMRI data
analysis and delve into detail about the theory behind the statistics of general linear model (GLM) analysis. There also exist some journal and research publications on statistical analysis, but all of them talk about new cutting edge methods. Several researchers have posted online material on the Web to explain the basics of fMRI
with some detail [9] - [16], but they cover data analysis briefly and sometimes in the
context of software analysis packages [14, 16], such as SPM [17] or Brain Voyager [18].
2.6.1
Software packages for the analysis of fMRI data
This section describes some of the extensively used packages in the MRI and fMRI community. AFNI (Analysis of Functional Neuroimages) [19] is a flexible package that allows graphical display of image data and analysis using the correlation method, developed by Bandettini et al, among others [20]. "Plug-in" modules are available to help users customize their analyses and extensive documentation on these and other aspects of the program can be found on the AFNI website maintained at National Institute of Health (NIH) by Bob Cox, accessible from http://afni.nimh.nih.gov/afni/.
Statistical Parametric Mapping, or SPM [21], was originally developed for Positron Emission Tomography, another imaging technique, and was extended to fMRI. The approach used by this package is voxel based, assuming a parametric statistical model at each voxel. General linear models describe the variability in the data in terms of experimental and confounding effects and residual variability [22]. At each voxel, hypotheses regarding the model parameters can be assessed and images can be created based on the calculated test statistics. There is extensive documentation about SPM at the site http://www.fil.ion.bpmf.ac.uk/spm/.
(Func-tional Imaging Analysis Software: Computa(Func-tional Olio). Other then these, there are also some commercial software packages such as MEDx and AIR (Automated Image Registration). But the interesting thing is that most of these software packages have their own default parameters, and researchers just use them for analyzing their data without actually understanding the importance of these. Most of them expect user to know about the basics of fMRI and statistical analysis in advance, so they are not suited for new researchers or students learning about this domain. Although, we are making use of the SPM package for pre-processing of the data in advance for our client-server application, we are incorporating experts' knowledge in selecting the parameters and will teach our audience about the same in the accompanying tutorial.
Another interactive educational tool that exists for fMRI is Dview, a Matlab program developed by Richard Hoge at the MGH-NMR Center [23]. Dview was used in the MIT Health Sciences and Technology (HST) course "Functional Magnetic Resonance Imaging: Data Acquisition and Analysis," or HST.583, in several of the lab sessions [23]. It provides an image viewing tools that allows students to navigate through brain volumes, and a statistical processing module that allows students to perform some simple analyses. A lab manual with a self-paced tutorial accompanied each lab session in the course, guiding students through using Dview to examine and compare various data sets. The development of our web based client/server application is guided from the ideas of this stand-alone tool.
2.6.2
Courses and workshops
There also exist semester-long courses on fMRI at various universities [8]. Courses specifically covering fMRI at University of Michigan, University of Waterloo, Medi-cal college of Wisconsin, UCLA, and the Harvard-MIT Division of Health Sciences and Technology (HST) [24] include several lectures covering data analysis and the statistics underlying the analyses.
Another source of fMRI education comes through 1 to 5 day long workshops organized by different institutes. Some of them are like the one-day analysis session at the Oxford Centre for Functional Magnetic Resonance Imaging of the Brain (FMRIB)
[25]
to a three day workshop at the Functional Imaging Research Center at the Medical College of Wisconsin [26] with an hour of analysis lecture and a two-hour session usingAFNI. The Athinoula A. Martinos Center for Structural and Functional Biomedical
Imaging at Massachusetts General Hospital (MGH) holds a 4 day-long course offered
3 times per year that includes multiple lectures and hands on experimental design,
data acquisition and analysis (using their own DView Analysis tool) [27]. In addition, conferences sponsored by the Organization Human Brain Mapping (OHBM) [28] and the annual meeting of the International Society for Magnetic Resonance in Medicine
(ISMRM) [29] also feature tutorials in fMRI analysis.
While the educational opportunities for fMRI are growing as the courses and workshops spread throughout the country, they have limits on the number of people that can enroll or sign up, and often are quite expensive. The proposed software application and tutorial, on the other hand, will be provided freely to the public, and does not place a time constraint as the courses and workshops do on the attendees.
Chapter 3
Educational Goals and Challenges
3.1
Introduction
Education in any new emerging area offers a number of challenges to all the
con-stituents of the educational process -students, teachers and researchers. This chapter
talks about some of the educational challenges and goals in teaching fMRI through the lens of the "How People Learn (HPL)" framework. New advances in learning sci-ence and educational use of technology have provided frameworks for reexamination of instructional paradigm in any domain. So the author makes an effort to explicitly present the goals and motives behind the development of this software application and accompanying tutorial. This development effort is one of the many initiatives taken
by the Vanderbilt-Northwestern-Texas-Harvard/MIT Engineering Research Center
(VaNTH/ERC) for Bioengineering Educational Technologies, with grants from the National Science Foundation, aiming at improving the short- and long-term out-comes of bioengineering education. The immediate use of this module and tutorial is a semester long graduate course taught at MIT, named as "HST.583 Functional Magnetic Resonance Imaging: Data Acquisition and Analysis". Also, at the same time the software module will be made available freely to entire biomedical imag-ing community though the support of the BIRN (Biomedical Informatics Research Network [40], www.nbirn.net).
3.2
HPL framework
Recent research in learning sciences and review of pedagogical methods have produced many good frameworks for designing and creating an effective learning environment
[30, 31]. This innovative project is based on principles of learning within the How
People Learn model described in the National Academy of Sciences report "How People Learn: Brain, Mind, Experience, and School" [30]. This framework says that learning can be enhanced if the learning environments are grounded in four basic principles. As described by Harris et al., "the learning environment is [31]:
(a) learner-centered in the sense that it takes into account the knowledge, skills, preconceptions, misconceptions, and learning styles of the students;
(b) knowledge-centered in the sense that it helps students learn with
under-standing by organizing the knowledge around "key concepts" or "big ideas" of the subject domain area, along with understanding the conditions under which different aspects of the knowledge is applicable;
(c) assessment-centered in the sense that it provides numerous opportunities for students to obtain feedback on their understanding so that it can be refined as needed, and numerous opportunities for a professor to obtain information on students' understanding of material so that teaching may be adjusted as needed; and
(d) community-centered in the sense that it fosters norms that encourage both
students and faculty to learn from one another."
Figure 3-1: The How People Learn (HPL) environment; Source [30]
3.3
Enhancements to tutorial motivated by
learn-ing theory
Looking through the lens of HPL framework, we are redefining the accompanying tutorial to make the effective usage of this software application in conveying the fundamental concepts of fMRI data analysis. The use of simulation in educational settings is most effective when students are working towards a clear goal, yet the as-signed tasks are not too narrowly defined [32]. As a consequence, we are reorganizing the tutorial literature used with the software simulator such that we first of all clearly define the major learning objectives. We also describe detailed learning objectives and key concepts of each of these major learning objectives.
To make a student understand concepts thoroughly, we walk them through guided exploration of the software simulation and create situations where key concepts are presented. Students examine the unprocessed image data, learning about the char-acteristics of the fMRI signal and then sequentially move through the pre-processing
and statistical analysis steps that enable further exploration of the image data. This is done for different data sets. Students are directed to make comparisons, with emphasis on how processing choices affect the ultimate interpretation of data.
The four major learning objectives explicitly described in the tutorial for the stand-alone version of the same application by Lai, Gollub et at. [2], are:
" "Understanding temporal and spatial correlation in fMRI data; " Understanding how to construct a statistical model for fMRI data; " Identifying sources of noise and how they affect fMRI signals; and
" Understanding the effects of motion correction and spatial filtering on the
out-come of statistical analysis of fMRI data".
The interactivity of any teaching environment is a very important feature of learn-ing. Interactivity makes it easy for students to revisit specific parts of the environment to explore them more fully and to test ideas, take some decisions and receive feed-back. In this case, students can see how different statistical analysis models have different effects on data. Non-interactive environments are much less effective for creating contexts that students can explore and reexamine, both individually and collaboratively. Most of the stand-alone software being used in pre-processing does not provide immediate feedback, because it takes considerable amount of time to process the data. In this tools environment, the user can go back to change the parameters and immediately see the effects on outcomes.
Chapter 4
Web-based Client-Server
Application
4.1
Background
The standalone prototype of the fMRI data analysis application, which was developed
by Lai, et. al. [2] in fall of 2002, had some limitations which led to the development of
this web based application. The primary goal was to port the tutorial to a platform that would allow the learning tool to be available to the wider scientific community through the World Wide Web. Some of the limitations which became motivations for this development are listed here:
" The standalone demo application required a Matlab license and access to image files
" Since the Matlab based standalone demo uses the image data located in the
Athena locker, it could only be accessed through Athena to users with a valid MIT account
" Interactivity of the demo was limited by the size of the image data and the fact
that many of the processing steps were actually accomplished "on the fly" by the tutorial software analysis capabilities. So, latency in the data retrieval was an issue
With these issues in mind, Lai
[8]
started (under the supervision of Dr. Randy Gollub and Dr. Rick Hoge) developing an initial version of the client/server application which could be made accessible to "everyone from anywhere". The first version of the application used the Matlab scripts and Matlab web server on the server side and Java GUI based client on the front end. But the prototype application didn't really solve the problem of the latency in data communication between front-end and backend. It was later determined that the Matlab web server was not efficient, specifically for this application, in handling multiple client requests and processing the requests on the fly for real-time communication. In addition, issues related to licensing of the Matlab software on the server machine created obstacles to broader access. Limitations of the Matlab web server and additional cost due to licensing of the same, forced the author to look for alternative server technologies and web server which could solve these problems and still achieve the goals of the application. Author explains the modified architecture and selection of particular set of platform technologies in this chapter.4.2
Client/Server Application
4.2.1
Requirements
The client/server solution should be able to address most of the problems and meet several of the requirements. It should be sufficiently interactive such that users do not experience undue delays when examining and exploring the brain data. The graphical user interface (GUI) of the application should be user-friendly and should display the brain slices/data in a manner that is consistent with standards used in the medical imaging community. The client should be able to run on all platforms such as Linux, Windows, Macintosh, and others. Improvements in the data set selection for the tutorial should be such that there is sufficient contrast in the stimulation and noise sources (such as body motion) so that fMRI data analysis concepts could be taught better.
An interactive application with least latency would require pre-processing of the data and carrying out statistical computations in advance on the server side. It should be the goal to shift as much of visualization work to the client as possible for better performance. For example, constructing the image (of brain slices) from raw data and implementing the autocorrelation function can be done at the client. So the work load of image construction on the server could easily be moved to client with the use of Java imaging technologies [33].
The software application should be made available to majority of researchers across the globe who are interested in learning fMRI. To make the application freely available to public, the selection of technologies should be such that it does not require users to buy a license for using it. For this reason only, the distribution of the standalone Matlab based software was not considered as it requires that the user purchase a Matlab license.
4.2.2
Architecture
Various options for selection of architecture were considered before deciding upon a client/server design. One option was to convert the Matlab based prototype to a standalone application which is easy to distribute. Matlab does offer a Runtime Server that allows Matlab programs to be converted to standalone applications [34], but that still does not solve the issue of requiring users to download an enormous quantity of data in the case of standalone prototype. Though, applications developed for use with the Matlab Runtime Server can take advantage of any of the math, language, and visualization features in Matlab and the Matlab toolboxes [34], the solution was not found in consistent with our requirement of not requiring user to buy a license to run the application. Thus it could be desirable to keep data and the
GUI interface on separate computers.
Another choice was to develop a powerful, robust, portable, extensible, and open-source Java (v 1.4) application (applet) comparable to a 3D image visualization ap-plication developed by Chris et al. [35], but for a different scientific need. The convenient way to visualize 4D medical imaging data set is as three 2D slices through
the same voxel location in the volume and a time series showing the intensity value of the selected voxel. In order to provide remote data access with a level of performance comparable to traditional stand alone applications, the issue of file loading ("I/O"), which is significantly slower, needs to be addressed. In practice, the performance of regular Internet connections is unpredictable; moreover, the transfer rate can vary by up to three orders of magnitude (1000x) among different types of network connections
[35]. So, we had two options with respect to how and when to download the 4D image
data:
1. All up-front: all of the data is downloaded and stored in client's memory
before the user can view and interact with any of it. This guarantees the best interactive response of the viewer; however, the user has to wait for all the data to download before the client could work, which can be impractical in low bandwidth situation.
2. On demand: download slice image data only when and if the user wants to view that particular slice. This minimizes the data downloads (and the amount of memory required by the applet/application), but the interactive response time is highly dependent on the server and on the network speed.
Given that we do not expect user to have accessibility to store the huge data-sets required for this application (complete data sets with all pcomputation could re-quire as much as 20- 30 gigabytes),the all up-front option was found to be impractical. Also, as we expect the request/response communication over the network to be light weight (i.e. data transferred per call are small in size) for our application, the second option of on demand supply of data to the client found more viable and attractive.
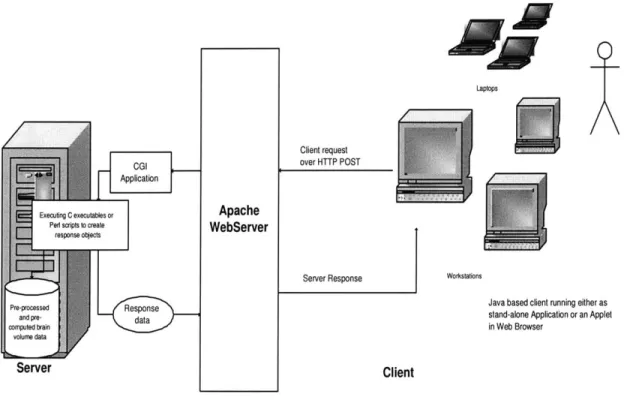
Given that data and interface should be decoupled, a client/server model would serve a reasonably good architecture. So author chose to build an application based on client/server architecture: the data reside on the server machine, and a GUI interface on the client side communicates with the server to retrieve appropriate data (brain slices, time series data etc) for the user. How much of the processing should be done on either side was decided based on several constraints and on the goal of maximizing
Laptops
Client request over HTTP POST
Application
Executng C executables or Apache
Ped s sipts to create WebServer
response oblects
Server Response Workstations
Java based client running either as
ar pred Rstand-alone Application or an Applet
cornputed brain in Web Browser
Server Client
Figure 4-1: Client/Server application architecture
the efficiency of the system. Other reasons which make the Client/Server architecture (as shown in Figure 4-1) appropriate for this application are listed below:
1. As the application requires the user to navigate through multiple data sets (each
one of approximately 30 megabytes in size), it is not reasonable to transfer a complete data set to the client. Rather it was decided to store all these large data sets at one common server which could be used by different and/or multiple clients. Also, in a networked environment, shared data should be stored on the servers, rather than on all computers in the system. This makes it easier and more efficient to manage access.
2. Clients would not be responsible for performing any data processing. Clients can concentrate on requesting input from users, requesting desired data from the server, and then analyzing and presenting this data using the display capabilities of the client workstation or the terminal.
3. Substantial Computational Requirements: Even if the data all reside on the
server, the amount of disk space and memory required for computation may be too large to expect of the client computer. Also, interactivity might not be good if the bandwidth between the server and client is low; transmitting the data from the server to client would take too much time, given that each brain volume data takes 30 megabytes. Hence computation should be done on the server side for whatever possible client requests. So a dedicated server is needed for substantial computing requirement to process client requests.
4. Client can be designed with no dependence on the physical location of the data. If the data is moved or distributed to other database servers (or file servers) the application continues to function with little or no modification.
In the current architecture we expect the server to perform all computations as desired by the user via the client, and that the server transmits to the client the end result of computations. Here also a similar problem could arise that the server sends the client the entire result which could be anywhere in size from a simple line graph to a four-dimensional brain volume data. Assuming that the user could only see part of the data at a time, because of 2-D presentation of the results in GUI, it is sufficient to keep the result on the server side, and for the client to request the portion that user is interested in viewing from the server. So, the objective is to transfer only as much of data as is needed by the client. A similar approach was also adopted in the Dview
[23] (standalone prototype) for displaying its 3- and 4- dimensional brain data, except
instead of having the data transmitted over the network from server to client as in this case, it was transmitted from disk to memory. Dview was not loading the huge data set directly into memory, but rather just the portion displayed to user. Thus, the client/server architecture fits with our requirements for location of computation and location of results to be at server and visualization work at client side.
Web Server Selection
As discussed earlier, because of the problems with the Matlab web server in terms of efficiency and interactivity in the previous version of this application, we evaluated other available web server options. The Apache web server was found to be best suited to our application requirements. However, the Apache configuration was modified to our needs. Apache is considered as one of the most popular web servers since April
1996 [36], as it is robust, could be deployed easily and is available for free.
4.2.3
Platform technologies
Server Side
Many options were considered for the server platform before finally deciding upon one. One option was to keep server as a complete Matlab based solution for both computation and Web-serving. This approach would allow much of the old standalone demo code to be readily used, but would require modification of the output data into a form the client accepts. The major disadvantages of this option include limitations of the Matlab Web Server and dangers of code reuse because of few unknown bugs in the final version. In the environment of Matlab Web Server, input variables are submitted to the server though URL-encoded form data through the HTTP POST request, and the server then computes the output and sends back the output HTML document as the result [37]. This is much the same way any standard web server, such as Apache, handles client requests. An option similar to this one was adopted
by Lai [8] in the prototype version except that some of the data was pre-preprocessed
and pre-computed. Another major issue with this option was getting a license for running Matlab on the server machine.
Another option was to move completely away from Matlab and to use another programming language, both for computation and serving the data to the client. The major advantage of this approach is that code could cleanly be built from scratch and that it provides an opportunity to get rid off some of the bugs in standalone prototype code. The language of choice could be required to have basic toolboxes for
building simple web server or it should be able to provide web serving functionality
by using standard web server, such as Apache, invoking CGI script to execute the
server programs. The major limitation of this option was that common languages such as Java and C do not have Matlab's matrix-manipulation facilities, which would have to be written before server can function, and would take a fair amount time to develop. Also, the standalone version was taking advantage of libraries for reading and processing data files in the common MINC (Medical Image NetCDF, is a file format for medical imaging data) format, which according to MINC documentation does not exist for languages other than Matlab, C, and Fortran [38], and conversion routines would still have to be written to bridge the gap from the MINC library output to a format that a C library would accept.
The third option considered includes complete pre-processing and computation for statistical analysis of the data in advance. To achieve that, Matlab/Perl scripts or al-ready existing software packages could be used. And then, the main effort would con-sist of writing the actual server code in Java or some other language. This approach could preserve the Matlab computational facilities and the advantage of building the server from scratch with no bugs. Depending on the format of output file generated after running Matlab scripts or another fMRI data analysis software package on the data, this option would require additional libraries for reading the pre-computed data for the client request. The one disadvantage of this approach is that it would gen-erate at least an order of magnitude more data than used in standalone prototype where many of the computations were done on request in real-time. Given enough disk space on the server this might not necessarily be a problem. The fact that there were no written libraries in existence for Java to read the pre-computed data, and it was not possible to write these libraries in the given time frame, the choice was made to choose another language to replace Java in this option.
Ultimately, the author chose to use a hybrid of the second and third options. Keeping the interactivity of the client in mind, most of the data for time-consuming processing steps and statistical analysis were pre-computed. The Apache Web Server dispatches CGI/Perl scripts to fetch the pre-computed data by running some of the
conversion routines written in C and Perl, performs any necessary minor computation such as coordinate transformation etc, and returns the output to the client. More detailed design of the server is presented in Chapter 6.
Client Side
Some of the options in selecting client side technologies for the application were
being discussed by Lai in his report
[8].
Author summarizes some of his thoughtsand presents additional ideas for the final selection of Java 2 Platform. Initially, standard HTML forms supplemented with some JavaScripts were considered adequate for the client. It was originally believed by the author that interaction between user and program does not go far beyond viewing static images and plots. However, we subsequently recognized the need for a very interactive client where the user could navigate through time-series brain data with the ability to click on the time-series plot and/or the three ordinal views of the brain (transverse, sagittal, coronal). An intermediate solution of having a Java applet specifically for displaying interactive plots was explored by Ian [8] where the server would transmit the data required for the plot, and the applet would take care of plotting the data on client side. But the communication between the applet and the HTML forms containing the processing steps and brain images was found to be too cumbersome. This is because, at present, Java and HTML can be a difficult combination due to limitations in how Java can interact with the Web browser [39]. Ultimately, it was decided that having entire client written in Java would offer more power, robustness, flexibility, and modularity in development. Finally, the client will be distributed or deployed either as a Java Applet or a regular Java Application. Since the client is expected to be used long term, the latest version of Java platform (Java 2 Platform, standard edition 1.4) was chosen, with the assumption that most Web browsers would support it soon.
Chapter 5
Detailed Client Design
The client of the Web-based application is markedly different from the stand-alone prototype in the user interface and design. This chapter covers details of the user interface of the client, the main data abstractions used, the architecture, and the package structure. The final client architecture and interface has evolved from a prototype version developed by Lai [8] to a fully functional robust application which can be deployed to multiple platforms in heterogeneous, distributed networks.
5.1
Design Goals
The design requirements of the programming language for the client were driven by the nature of the computing environments in which this software application would be deployed. We expect our users to run this application on multiple platforms, so Java was the obvious choice of development language for its reasonable performance and portability for a GUI intensive application like this. Other design goals for the client development were:
" Applications should be designed to offer more interactive and responsive user
interfaces than HTML clients running inside a web browser.
" Developing the application under the umbrella of layered architecture for its
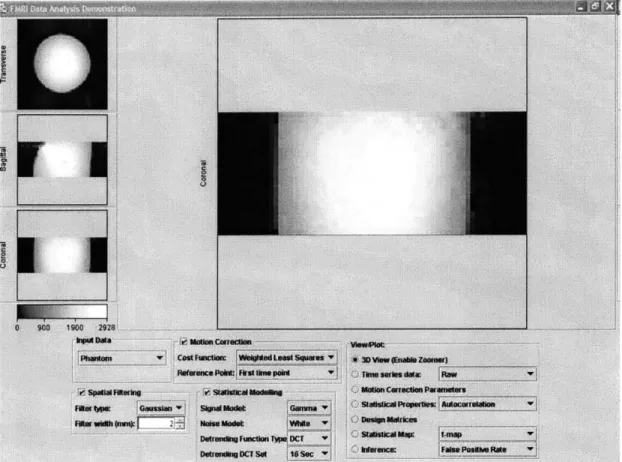
Figure 5-1: Screenshot of Web-based Java Client for fMRI Analysis of Phantom data
(3D View)
5.2
User Interface
The user interface for the Web-based fMRI Data Analysis client is based on that of the standalone prototype, with some important differences. First, the final client integrates the viewer and the panel of processing parameters so that the user does not have to switch his attention between windows. Some of the features in the final GUI of the application are just extension to the basic features implemented in the prototype application developed by Ian [8]. Additional features such as color map legend for images, zoomed and mosaic view of individual cross sectional slices are implemented from scratch in the final client. Screenshots of the integrated interface are shown in Figure 5-1 and Figure 5-2 with different data sets.
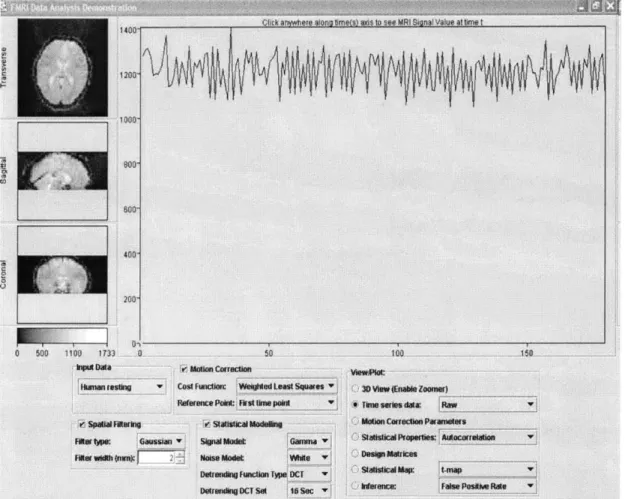
Figure 5-2: Screenshot of Web-based Java Client for fMRI Analysis of human brain data (4D View)
The viewer has a large panel to the right of the transverse, sagittal, and coronal cross-sectional slices, in which it displays either a zoomed slice of the image or the time series values for the selected voxel in 4-dimensional data or the autocorrelation function of a selected voxel. However, in addition to integrating the viewer and the panel, the final client also displays the design matrix and the motion correction parameters in the same window. When the user requests a plot or the design matrix, the image data is replaced by a panel displaying the requested data.
In the standalone prototype, the processing parameters control the computations performed on the data, and the various View and Plot buttons at different stages of processing display the data as processed up to that particular stage [8]. However, since nearly all of the data in the Web-based application is pre-computed, the need for the user to press a button to view the data after changing parameters was found unnecessary, instead the response should be close to immediate. Also, the user should be able to enable or disable a processing step or alter its parameters, and see that the data is changed automatically. Therefore, in the final client, the View and Plot buttons have been removed, and replaced by a list of different views to choose from:
" Time Series Data (raw, fitted, or hemodynamic response)
" Zoom View (Zoomed view of either of the slice in large panel area)
" Motion correction parameters (6 parameters: 3 translational and 3 rotational) " Autocorrelation function (autocorrelation function estimated from the time
se-ries data of a selected voxel)
" Statistical properties (t-value maps or standard deviation map)
" Design matrices (displays design matrix and a stimulus covariance matrix for a
given experiment paradigm)
Since each view may require certain processing steps to be turned on, the view selection defaults to raw data if turning off a processing step causes the view to become unavailable. For instance, if statistical modelling is turned off, the statistical
![Figure 3-1: The How People Learn (HPL) environment; Source [30]](https://thumb-eu.123doks.com/thumbv2/123doknet/14326095.497833/24.918.306.627.138.473/figure-people-learn-hpl-environment-source.webp)