Publisher’s version / Version de l'éditeur:
Vous avez des questions? Nous pouvons vous aider. Pour communiquer directement avec un auteur, consultez la
première page de la revue dans laquelle son article a été publié afin de trouver ses coordonnées. Si vous n’arrivez pas à les repérer, communiquez avec nous à [email protected].
Questions? Contact the NRC Publications Archive team at
[email protected]. If you wish to email the authors directly, please see the first page of the publication for their contact information.
https://publications-cnrc.canada.ca/fra/droits
L’accès à ce site Web et l’utilisation de son contenu sont assujettis aux conditions présentées dans le site LISEZ CES CONDITIONS ATTENTIVEMENT AVANT D’UTILISER CE SITE WEB.
Building Research Note, 1985-06
READ THESE TERMS AND CONDITIONS CAREFULLY BEFORE USING THIS WEBSITE.
https://nrc-publications.canada.ca/eng/copyright
NRC Publications Archive Record / Notice des Archives des publications du CNRC :
https://nrc-publications.canada.ca/eng/view/object/?id=c8a91da2-f1af-417a-be88-add5c4ea2667 https://publications-cnrc.canada.ca/fra/voir/objet/?id=c8a91da2-f1af-417a-be88-add5c4ea2667
NRC Publications Archive
Archives des publications du CNRC
This publication could be one of several versions: author’s original, accepted manuscript or the publisher’s version. / La version de cette publication peut être l’une des suivantes : la version prépublication de l’auteur, la version acceptée du manuscrit ou la version de l’éditeur.
For the publisher’s version, please access the DOI link below./ Pour consulter la version de l’éditeur, utilisez le lien DOI ci-dessous.
https://doi.org/10.4224/40000484
Access and use of this website and the material on it are subject to the Terms and Conditions set forth at
Insertion loss of suspended decorative cylinders
National Research Conseil national
I
*
Council Canada de recherches CanadaDivision
of
Building Research
Building
Research
Note
No.
231
l
nsertion Loss of Suspended Decorative Cylinders
INSERTION LOSS OF SUSPENDED DECORATIVE
CYLINDERSby
J.S.
BradleyNoise and Vibration Section Division of Building Research
BRN 231
June 1985
ISSN
0701-5232ABSTRACT
incidence, and tube spacing for both solid, and expanded metal cylinders. The expanded metal cylinders were found to produce the same visual effects without the large insertion losses that the solid tubes produced.
Des mesures de la perte du son par insertion de rangees de tubes suspendus
ii
kgale distance ont CtB effectuhes. Des valeurs de la perte par insertion ont 6th obtenues pour un nombre vari6 de cylindres en metal solide et dhployd, d'angles d'incidence et d'espacernents entre les tubes. On a observd que les cylindres en metal dkploye' produisaient le mimes effets visuels que les tubes en m6tal solide sans toutefois entrliner d'importantes pertes par insertion.INTRODUCTION
I
Various materials are sometimes suspended from ceilings in large halls and auditoria, as
an architectural feature. In such cases the material is there only for visual reasons and is not intended to affect the acoustical conditions in the hall. One of the simplest of such decorative materials is a regular linear array of equally spaced cylinders. This report summarizes measurements of the insertion loss of linear arrays of suspended cylinders that were part of a larger practical study. Both solid, and open-mesh expanded metal cylinders were tested using varied numbers of cylinders, varied spacing, and varied angle of incidence. Although measurements were limited to arrays of cylinders, they give some idea as to the magnitude and frequency of effects to be expected from other suspended objects.
MEASUREMENT PROCEDURES
I
Two different measurement techniques were used in this study. Initial measurements were made using a 0.38 calibre blank pistol, and recording pulse responses both with and without the teat array in place between the gun and the microphone. Fourier analysis of the gated pulse responses was then used to obtain insertion loss spectra for the test cylinders. Because of the low insertion loss of the expanded metal cylinders and the lack of precise repeatability of this method, these cylinders were also tested in an anechoic room using 200 steady state pure tones logarithmically spaced between 20 and 20,000 Hz, and produced by a loudspeaker.
In both cases the source was two metres in front of the centre of the array, and the receiver was one metre behind the array; the source, receiver, and the centre of the array were on the same staight line for all angles of incidence. Both tests were insertion loss measurements; the response was measured at the receiver both with and without the array of cylinders and the insertion loss spectra were determined from the differences between the two sets of sound levels. In the anechoic room tests, the spectra were obtained directly using varied frequency steady state pure tones, and thus only narrow band spectra were obtained. For the tests using the gun pulses, the gated pulses were Fourier analyzed, and both narrow band and 113 octave spectra were calculated.
The pistol shot responses were processed by computer. Each response was digitized and gated t o remove unwanted reflections from the walls of the laboratory after displaying the full response on a computer graphics terminal. A total of 2048 points were digitized for each pulse a t a sampling rate of 22,627 samples per second. This provided the required minimum of two points per cycle up to the upper corner frequency of the 8000
Hz
octave band. Fourier analysis of these pulses gave narrow band spectra with a spacing between the spectral lines of 11.05 Hz. These narrow band values were converted t o 113 octave band spectra by simply adding, on an energy basis, the spectral lines that fell within each 113 octave band. Although this ignores the effects of realistic 113 octave filter shapes, it is certainly adequate for relative comparisons between the various configurations tested. The process was more limited by the lack of precise repeatability. It was expected that by averaging the results of three repeated pulses, variations between shots could be reducedto satisfactory levels. For both the 113 octave and narrow band spectra, levels differed
from the mean of three shots by no more than f 1.5 dB up to 4000
Hz.
However when oneset of three shots was completely repeated, including repositioning the source and receiver,
the mean levels from each set of three shots differed from the overall mean of several such
sets by up to f 2.5 dB over this same frequency range.
The cylinders tested were all 12.5 cm diameter and 2.44 m in length. Those referred to
as solid were cloth-covered thick-walled cardboard tubes. The others were made of two types of expanded metal mesh. The larger mesh expanded metal had staggered holes
approximately 0.9 by 0.3 cm, while the smaller mesh expanded metal had staggered holes
approximately 0.3 by 0.2
cm.
Viewed from one end, the cylinders showed a large proportionof open area; viewed from a perpendicular direction or from the other end, very little open
area showed.
RESULTS
Solid
Tubes Using Gun SourceThe first tests on the solid tubes were carried out using gated pistol shot responses in a normal room. Figure 1 shows measured 113 octave insertion loss values with two, four, and six of the solid tubes hung with a 12.5 cm spacing between the outer surfaces of the
tubes. For these 90 degree incidence tests, the basic shape of the curve is determined by
the centre two tubes. As other tubes were added on either side of the centre tubes, a peak
developed at 1.0 kHz and the sharp dip at 2.0 kHz was reduced
in
magnitude. Thus eventwo solid tubes could cause up'to a 15 dB reduction at a particular frequency and location behind the tubes.
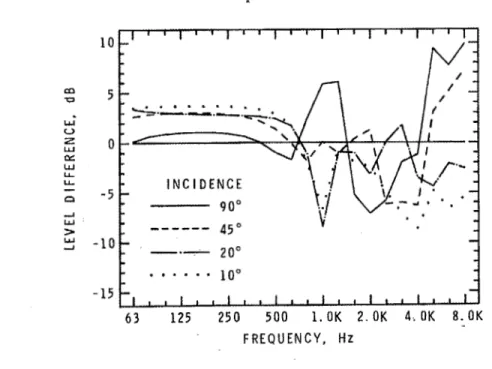
Figure 2 shows the effects of angle of incidence for six of the solid tubes with a 12.5
cm
spacing between the tubes. A t the 90 and 45 degree angles of incidence one could see
through the array of cylinders, but for the 10 and 20 degree angles this was no longer
possible. Although the array forms a more complete visual barrier at these smaller angles,
the magnitude of 1/3 octave insertion loss vaIues was quite similar. There is evidence that
for lower frequencies, up to 500 Hz, the diffracted energy leads to increased sound levels behind the array. At these frequencies the attenuation of the array is minimal, and the path lengths involved are too small for the various diffracted paths to interfere destructively. Thus an increase due to increased diffracted energy occurs, which tends to increase as the angle of incidence decreases. The strengthening of this increase with decreasing angle
of incidence was probably due to the smaller cross section
of
the array as seen from thesource. Thus for the smaller angles of incidence this lower frequency energy was diffracted through smaller angles and travelled over shorter additional path lengths relative to the direct path. The repeatability errors of this procedure would also add some uncertainty to the magnitude of this effect.
Figure 3 shows the results of varied tube spacing for six solid tubes a t 90 degree angle
6 3 125 250 5 0 0 1.OK 2. OK 4 . OK 8. OK
F R E Q U E N C Y , H Z
. ..
Figure 1. One-third octave
band
insertion loss, solid tubes, 90" incidence, 12.5 cm spacing," - 1 0
-
-
. .
20"-
. . .
-
F R E Q U E N C Y , H z
effect because of the larger distances and angles involved for sound diffracted from them to the receiver. This was confirmed by simulation studies discussed below. In Fig. 1, the peak at 1.0 kHz was only evident for more than two tubes. One might therefore expect this peak to be diminished or absent for cases of increased spacing. In addition, because the increased spacing would lead to longer paths from the tubes, one would expect some interference effects to move to lower frequencies. The results in Fig. 3 support this; the peak at 2.0
kHz
is not evident at larger spacings and the major dip at 2.0 kHz moves to1.0 kHz and 800 Hz as the spacing is increased to 25.0 and 37.5 cm.
Figure 4 shows the effect of tube spacing for a 20 degree angle of incidence. The lower frequency increase is least for widest spacing (37.5 cm) in agreement with the argument above, relating this to the cross section of the array as seen from the source. It is difficult to positively identify interference effects that systematically move to lower frequencies in this figure. Perhaps this is because at this angle the cross section of the array as seen from the source is quite small and the results are much more complicated due to the increased importance of the outer tubes.
Anechoic
Room
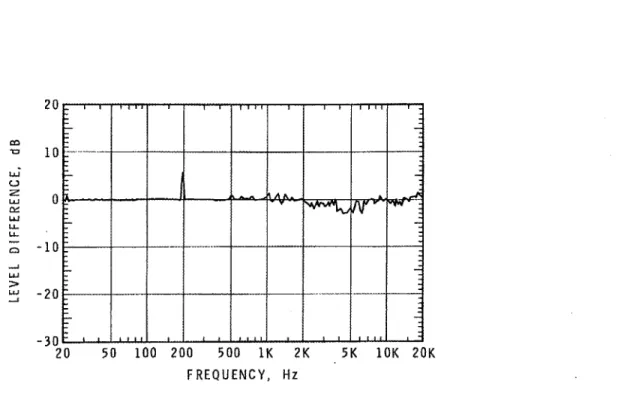
TestsFigures spacing 200
Hz
5 and 6 give the results of anechoic room tests on six solid tubes with 12.5 cm between tubes for 90 and 20 degree angles of incidence. The sharp peak just below was an artifact introduced by the test equipment and should be ignored. Much more detail is evident in these results than in the previous 113 octave results because they are narrow band pure tone measurements. The corresponding 1/3 octave plot from Fig. 1 is included on Fig. 5 for comparison. There is reasonable agreement between the two methods, considering the difference in analysis bandwidths. The increased levels of the 113 octave curve at high frequencies are probably due to the increased energy that would be passed by the quite broad bandwidth higher frequency 113 octave filters. The 1/3 octave result from Fig. 1 (dashed line on Fig. 5), indicates the same major features of
a peak at 1 kHz, with dips in the region of 2.0 kHz.
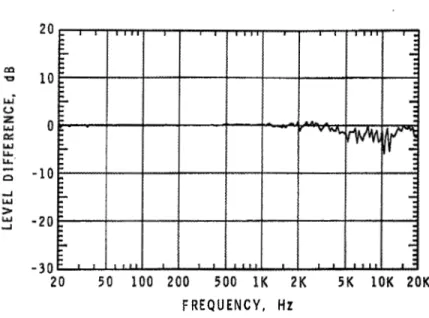
The expanded metal cylinders were first tested using the gated pulse technique, but the resulting insertion losses were much smaller than those obtained for the solid tubes, and close to the repeatability errors in that method. Further tests were carried out using pure tone insertion losses in the anechoic room. Figures 7 and 8 are the results for six large- mesh tubes with a 12.5 cm spacing for 90 and 20 degree angles of incidence. Compared to the results for the solid tubes (Figs. 5 and 6), the insertion losses are very much less for the expanded metal tubes. For the 90 degree incidence (Fig. 7), maximum insertion losses of up to about 3.0
dB
occurred in the 5.0 kHz region. For 20 degrees (Fig. 8), maximum insertion losses were a little larger at very high frequencies above 10.0 kHz.Figures 9 and 10 show the results for increased spacing of the large-mesh tubes at 20 degrees incidence to 25.0 and 37.5 cm. The changed spacing of the cylinders produced some smail changes to the insertion loss values above 5.0 kHz. There were no obvious systematic shifts in peaks or dips with the spacing change. For 90 degrees incidence and
I / - 1 I / I . ' . S P A C I N G , c m
---
\ I
' \ I 12.5 F R E Q U E N C Y , H z . ,. ,Figure 3. One-third octave band insertion loss, 6 solid tubes, 90° incidence
-
n -5-
S P A C I N G , c m---
-.-
. . .
I I I I I I I I I I I I I I I ~ I ~ I I-
6 3 1 2 5 2 5 0 5 0 0 1.OK 2.OK 4.OK 8.OK
F R E Q U E N C Y . H z
Figure 4. One-third octave band insertion loss, 6 solid tubes, 20" incidence
- 3 0
2 0 5 0 1 0 0 200 5 0 0 1K 2K 5 K 10K 20K F R E Q U E N C Y , H Z
Figure 5. Comparison of steady (anechoic), and one-third octave pistol shot insertion loss, 6 solid tubes, 12.5 cm spacing, 90' incidence
F R E Q U E N C Y , H z
Figure 6. Narrow band insertion loss, 6 solid tubes, 20' incidence, 12.5 cm spacing
2 0 5 0 1 0 0 200 5 0 0 1K 2K 5K 10K 20K
F R E Q U E N C Y , H z
---
Figure 7. Narrow band insertion loss, 6 large-mesh tubes, 90" incidence, 12.5 cm spacing
2 0 5 0 1 0 0 200 5 0 0 1K 2K 5K 1OK 20K
F R E Q U E N C Y , H z
Figure 8. Narrow band insertion loss, 6 large-mesh tubes, 20" incidence, 12.5 cm spacing 8
the same large-mesh tubes, the increased spacing further diminished the effects compared
to those observed in Fig. 7, so that at a 37.5 cm spacing the insertion loss was within
f
1.0 dB from 20 to 20,000 Hz.The small-mesh expanded metal tubes were not as extensively tested, but indicated effects similar to those observed for the larger mesh tubes. The results for six small-mesh tubes with a 12.5 cm spacing and 90 degree angle of incidence, were very similar to the results
in Fig. 7, showing a shallow dip around 5.0 kHz. For the same tubes a t a 20 degree angle
of incidence, the results were similar to those of Fig. 8, with the greatest reductions a t the
highest frequencies. In the region above 5.0 kHz the small-mesh tube insertion losses were larger by several decibels.
To attempt to isolate the insertion loss of the expanded metal material from the insertion loss introduced by having a linear array of cylinders, a flat sheet of the large mesh material
was also tested. At a 45 degree angle of incidence, the insertion loss was within
f
0.5 dBup to at least 15.0 kHz. At a 90 degree angle of incidence, some slightly larger dips of up
to about 1.0 dB were observed above 2.0 kHz. The insertion loss values for the flat sheet
showed effects of about the same magnitude as the day-to-day repeatability of the no-tubes
reference curves in these anechoic room tests. Thus one cannot be confident of the exact magnitude of its insertion loss from these measurements. The larger effects observed for both the large- and small-mesh cylinders appear to be due almost entirely to the presence of the array of cylinders, and not simply to the effects of the basic material.
Simulation of Solid Tubes
Although it was beyond the scope of this project to explain the present results in detail, a simple simulation experiment was carried out to confirm the effects of some parameters.
Simulated insertion losses were calculated by treating each cylinder as a secondary source
positioned at the centre of the cylinder. From the geometry of the arrangement of the tubes, source, and receiver in the horizontal plane through them, the arrival times of the direct sound and the pulses from the secondary sources (the diffracted sound) could be readily calculated. The secondary sources were given abitrary attenuations to simulate the losses associated with diffraction and their amplitudes were further reduced according to the distances that were travelled. In this way an ideal impulse response could be calculated starting with the direct pulse and followed by pulses representing the diffracted sound from each tube. By calculating responses both with and without the effect of the tubes, the same program that was used to process the pistol shots could be used to determine insertion loss spectra.
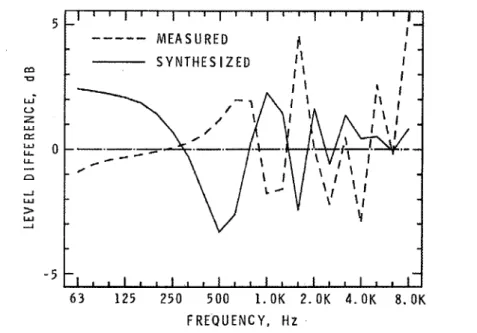
Figure 11 compares measured and synthesized results for two solid tubes separated by
a distance of 1.0 m. Clearly phenomena occur a t similar frequencies for both results.
However, in many cases the direction of the effect is reversed. Up to a frequency of 2.0
kHz,
(where the tubes are approximately one wavelength in diameter), peaks in the measured
results correspond to dips in the synthesized values and vice versa. Above 2.0
kHz
peaks20 50 100 200 500 1K 2 K 5K 10K 20K
F R E Q U E N C Y , Hz
Figure 9. Narrow band insertion loss, 6 large-mesh tubes, 20" incidence, 25 cm spacing
F R E Q U E N C Y , H Z
l x ~ l ~ l l ' r l l l l ~ ~ l ~ l l ~ r l ~
-
-
---..-
M E A S U R E DE
l I-
S Y N T H E S I Z E D 1 1 I-
I l l l , l l l l l l t l l l l l l l I I Itubes appears to determine the frequencies at which interference minima and maxima occur, and this simple model correctly predicts these frequencies. The amplitudes of the insertion loss maxima and minima also show reasonable agreement for this case, where the
strength of the secondary sources was attenuated by a factor of 0.25 in addition to the
effects of distance. It is not known why the peaks and dips are inverted between the two
resrilts below 2.0 kHz,
but
it could be caused by a frequency-dependent phase shift of thediffracted sound.
- 5
6 3 125 2 5 0 5 0 0 1. OK 2 . O K 4 . O K 8. OK
F R E Q U E N C Y . H z
Figure 11. Comparison of measured and synthesized one-third octave spectra, 2 solid
tubes, 1.0 m spacing, 90° incidence
Further experiments with synthesized results qualitatively confirmed the expected effects of the strength of the secondary sources, the tube spacing, and the number of tubes.
When the strength of the secondary sources was less than the 0.25 used in the results of
Fig. 11, the amplitude of the interference effects was diminished, i.e. both peaks and dips were smaller in magnitude, but occurred at the same frequencies. As the spacing of the
two tubes was decreased, the position
of
the first minima moved systematically to higherfrequencies because of the smaller differences between the direct and secondary paths. For smaller spacings similar to those used for the measurements-of the real tubes, increasing the number of tubes produced further irregularities in the insertion loss spectra; these
irregularities appeared at increasingly lower frequencies as more tubes were added. Also
the addition of more tubes increased the low frequency energy buildup that was present for all synthesized results.
CONCLUSIONS
.f
The hanging of slender solid tubes in a concert hall or auditorium might be assumed to have negligible effects on the sound field in the room. This is probably true if reverberation time is considered to be the sole criteria for optimum acoustics. From newer research, we now know that the direct sound, arid particular early reflections, can have a critical influence on the clarity and definition of music and the intelligibility of speech. Thus arrays of solid cylinders similar to those tested here could dramatically interfere with particular sound reflections. Attenuations in excess of 10 dB are possible in certain medium t o higher frequellcy bands; these attenuations would be expected to strongly affect perceived clarity and intelligibility.
No method of eliminating the insertion loss of the solid tubes was discovered. The insertion loss varied with the angle of incidence, the spacing of the tubes and the number of the tubes, but attenuations in cxccss of 5 dB occurred for all configurations a t frequencies as low as 1.0
kHz.
For very large spacings of several metres one would expect diminished insertion losses, but such cases were not tested.The expanded metal tubes, having a quite large percentage of open area, produced much smaller attenuations. The combinations tested here ~ r o d u c e d significant insertion losses only at very high frequencies of 10
kHz
or higher, which are probably subjectively unim- portant. Thus one could suspend such tubes and obtain a desired visual effect without creating significant acoustical problems.L '