HAL Id: hal-02171878
https://hal-amu.archives-ouvertes.fr/hal-02171878
Submitted on 18 May 2020
HAL is a multi-disciplinary open access
archive for the deposit and dissemination of
sci-entific research documents, whether they are
pub-lished or not. The documents may come from
teaching and research institutions in France or
abroad, or from public or private research centers.
L’archive ouverte pluridisciplinaire HAL, est
destinée au dépôt et à la diffusion de documents
scientifiques de niveau recherche, publiés ou non,
émanant des établissements d’enseignement et de
recherche français ou étrangers, des laboratoires
publics ou privés.
Behavioral and electrophysiological investigation of
speech perception deficits in silence, noise and envelope
conditions in developmental dyslexia
Aline Frey, Clément François, Julie Chobert, Mireille Besson, Johannes Ziegler
To cite this version:
Aline Frey, Clément François, Julie Chobert, Mireille Besson, Johannes Ziegler.
Behavioral
and electrophysiological investigation of speech perception deficits in silence, noise and
enve-lope conditions in developmental dyslexia.
Neuropsychologia, Elsevier, 2019, 130, pp.3-12.
Behavioral
and electrophysiological investigation of speech perception
deficits in silence, noise and envelope conditions in developmental dyslexia
Aline
Frey
a,
Clément François
b,c,d,
Julie Chobert
e,
Mireille Besson
e,
Johannes C. Ziegler
f,⁎ a CHArt Laboratory, ESPE of the Créteil Academy, University of East-Paris Créteil Val-de-Marne, Franceb Cognition and Brain Plasticity Group, Bellvitge Biomedical Research Institute (IDIBELL), L’Hospitalet de Llobregat, Barcelona 08097, Spain c Dept. of Cognition, Development and Educational Science, Campus Bellvitge, University of Barcelona, L’Hospitalet de Llobregat, Barcelona 08097, Spain d Institut de Recerca Pediàtrica, Hospital Sant Joan de Déu, Barcelona, Spain
e CNRS and Aix-Marseille Université, LNC, Fédération 3C, Marseille, France f Aix-Marseille Université, CNRS, LPC, Fédération 3C, Marseille, France
Keywords: N1 Speech Noise Envelope Dyslexia ERP A B S T R A C T
The present study investigated whether children with developmental dyslexia showed specific deficits in the perception of three phonetic features (voicing, place, and manner of articulation) in optimal (silence) and de-graded listening conditions (envelope-coded speech versus noise), using both standard behavioral and electro-physiological measures. Performance of children with dyslexia was compared to that of younger typically de-veloping children who were matched in terms of reading age. Results showed no significant group differences in response accuracy except for the reception of place-of-articulation in noise. However, dyslexic children re-sponded more slowly than typically developing children across all conditions with larger deficits in noise than in envelope than in silence. At the neural level, dyslexic children exhibited reduced N1 components in silence and the reduction of N1 amplitude was more pronounced for voicing than for the other phonetic features. In the envelope condition, the N1 was localized over the right hemisphere and it was larger for typically developing readers than for dyslexic children. Finally, in stationary noise, the N1 to place of articulation was clearly delayed in children with dyslexia, which suggests a temporal de-organization in the most adverse listening conditions. The results clearly show abnormal neural processing to speech sounds in all conditions. They are discussed in the context of recent theories on perceptual noise exclusion, neural noise and temporal sampling.
1. Introduction
Developmental dyslexia is a neurodevelopmental disorder that af-fects around 5% of children in primary school (Demonet et al., 2004; Norton et al., 2015; Snowling, 2000). Besides slow and error-prone word recognition and decoding, one of the hallmarks of developmental dyslexia is a deficit in phonological processing, which tends to affect a large majority of dyslexic children (Ramus et al., 2003; Saksida et al., 2016; White et al., 2006) and which is predictive of developmental dyslexia even prior to the onset of reading instruction (Boets et al., 2007; Lyytinen et al., 2015). Apart from deficits in auditory perception (for review see Goswami, 2015), impoverished speech perception has been a key candidate to explain the phonological deficits of children with dyslexia (Bogliotti et al., 2008; Godfrey et al., 1981; Manis et al., 1997; Serniclaes et al., 2001; Serniclaes et al., 2004). In particular, it has been shown that children with dyslexia as well as children with more general language learning difficulties are particularly impaired
with speech perception in noisy conditions (Boets et al., 2007; Ziegler et al., 2009), which is by far the most common listening situation in real life (Bradley and Sato, 2008).
In two comprehensive studies on speech perception in noise (SPN), Ziegler et al., (2005, 2009) investigated the identification of 16 con-sonants embedded in a vowel-consonant-vowel (VCV) syllable (/aba/, / apa/, /ada/…) in silence and in various stationary and fluctuating noise conditions. They found speech perception deficits for children with dyslexia and with language learning impairments in noise but not in silence. Interestingly, information transmission analyses (Miller and Nicely, 1955) showed that children with language learning difficulties had more problems with voicing (/aba/ versus /apa/), while children with dyslexia had more problems with place of articulation (/aba/ versus /ada/).
SPN deficits in dyslexia were observed in dyslexic adults and in at-risk children. For example, Dole et al. (2012) reported a SPN deficit in dyslexic adults especially when the background noise was made of
⁎ Corresponding author.
with dyslexia compared to typically developing children who were matched for reading age. This is important because it is well known that the link between reading ability and speech perception is bidirectional (Dehaene et al., 2015; Dehaene et al., 2010; Ziegler and Ferrand, 1998) and one needs to exclude the possibility that differences in speech perception between typically developing children and children with dyslexia are simply due to differences in reading ability (Goswami, 2003). Thus, if speech-perception deficits were fundamental and not simply the consequence of impoverished reading ability, they should be found even against typically developing children that were matched for reading age, at least in the most adverse conditions or for the phonetic contrasts that are the most affected in noisy conditions, such as place of articulation (Binnie et al., 1974; Miller and Nicely, 1955; Ziegler et al., 2005, 2009). To obtain a complementary measure with regard to the quality of the neural encoding of syllables, we recorded event-related brain potentials (ERPs) in an ABX paradigm (Ziegler et al., 2011). In this paradigm, children heard three syllables and had to decide whether the last syllable X was identical to either A or B. The advantage of this paradigm is that it allows the recording of the “pure” encoding process of a given phonetic contrast (A and B), not contaminated by decision and comparison processes that occur only after X has been presented. We expected to find differences between dyslexic and typically devel-oping children in the early components of the ERPs (e.g., N1, P2 components).
Second, we were interested in further investigating the noise ex-clusion and neural noise hypotheses. In particular, if the main deficits of children with dyslexia were related to perceptual noise exclusion phe-nomena, one should obtain greater impaired cortical processing in noise than in silence. However, if speech perception deficits were due to increased “neural noise”, one should see reduced amplitude and/or delayed latency of early ERP components in children with dyslexia in all conditions. We also added a speech envelope condition, in which the temporal fine structure of the acoustic signal was corrupted without adding noise (Gilbert and Lorenzi, 2006; Shannon et al., 1995; Ziegler et al., 2009). This condition provided yet another way to contrast the noise exclusion versus the neural noise hypothesis because noise ex-clusion would predict no deficit in this condition, whereas neural noise would predict a deficit in this condition.
Finally, we were interested in testing test a key prediction of the temporal sampling theory of dyslexia (Goswami, 2011; Goswami et al., 2014), according to which children with dyslexia show atypical right hemisphere responses to slow temporal modulations (Cutini et al., 2016) and deficits in the neural encoding of the speech envelope (Power et al., 2016). Indeed, if children with dyslexia have specific problems in processing the slow temporal amplitude modulations (e.g., syllable-level information) in the speech signal, they should show def-icits in the neural encoding of the speech envelope. This deficit might be stronger over the right than the left hemisphere because the right auditory cortex preferentially processes low-frequency temporal fea-tures (Belin et al., 1998; Giraud and Poeppel, 2012; Morillon et al., 2012).
2. Methods 2.1. Participants
A total of 36 children participated in the study with 18 typically developing children (12 boys, 16 right-handers) and 18 children with dyslexia (14 boys, 14 right-handers) who were recruited in two schools in Marseille and in Aix-en-Provence. Each school had one specialized dyslexia class, called CLIS in France, which stands for “Classe pour l'inclusion scolaire” (class for inclusive schooling). To be eligible to be transferred to such a specialized class, a dyslexic child had to be for-mally diagnosed with dyslexia by an interdisciplinary team of neu-ropsychologists, speech-and language therapists and neurologists (i.e., reference center). Thus, all children in our study had a formal diagnosis speech rather than stationary noise and when both signals were
pre-sented to the same ear (for a similar finding see Dole et al., 2014). Boets et al. (2007) showed that 5-year-old pre-school children with family risk of dyslexia, who presented literacy difficulties at the end of first grade, did indeed present significant pre-school deficits in phonological awareness, rapid automatized naming and SPN. Although a recent longitudinal study with 87 children at high and low family risk of de-velopmental dyslexia (Vanvooren et al., 2017) failed to find increased auditory and SPN deficits in high-risk children at the age of 5, they nevertheless found a causal link between the performance on these skills in kindergarten and later phonology and literacy. Importantly, SPN was the most contributing factor for later phonological awareness and phonology-mediated reading skills.
At the brain level, the link between reading skills and SPN has been investigated mainly through auditory brainstem recordings (Hornickel et al., 2009; Wible et al., 2002). In typically developing children, the auditory brainstem response reflects acoustic differences between contrastive stop consonants. Hornickel et al. (2009) found that the subcortical differentiation of speech stimuli, such as /ba/, /da/ and /ga/ was positively correlated with phonological awareness, reading, and SPN abilities. In particular, children with greater subcortical dif-ferentiation showed higher levels of phonological awareness and better SPN. Similarly, Chandrasekaran et al., (2009) measured auditory brainstem responses to speech syllables in noise presented in a re-petitive or variable context. They found that children with dyslexia failed to adapt their brainstem responses in a predictable repetitive context and this inability was highly correlated with behavioral indices of SPN. Given that the ability to sharpen the representation of repeating elements is crucial to SPN, it has been suggested that the disruption of this mechanism might be a hallmark symptom in developmental dys-lexia.
There is also evidence for impaired cortical processing of temporal and spectral acoustic cues of harmonic tones in the absence of noise (Hamalainen et al., 2007, 2008). Such deficits may contribute to ab-normal speech perception and poor development of language skills in children at risk for or with dyslexia (Lovio et al., 2010; Nagarajan et al., 1999). Some studies showed an increase in early auditory evoked po-tential (AEP) amplitude to tones varying in rise time in children with (or at risk for) dyslexia compared to typically developing readers (Hamalainen et al., 2007, 2008) and enhanced brain responses to shortened vowels (/ata/ vs /atta/; Lohvansuu et al., 2014). Other stu-dies, however, showed reduced N1 and P2 amplitudes and increased latencies for phonemes presented in noise conditions (Cunningham et al., 2001; Kaplan-Neeman et al., 2006; Martin et al., 1997), specifi-cally when the noise was most similar to the speech sounds (e.g., multi-talker babble, Billings et al., 2011).
The findings summarized above have led to two complementary theoretical proposals. The first proposal is that children with develop-mental dyslexia have specific problems with the exclusion of perceptual noise not only in the auditory domain (Ziegler et al., 2009) but also in the visual or motor domain (Sperling et al., 2005, 2006). The second proposal is that dyslexic children are strongly affected not only by the presence of perceptual (external) noise but also by the presence of neural (internal) noise (Hancock et al., 2017; Ziegler et al., 2009). Neural noise refers to greater variability in the firing rate of neural networks. Noisy networks are less well-tuned to the stimulus in parti-cular with respect to timing and synchronization (Casini et al., 2017; Johnson et al., 2007; Thompson et al., 2016). Neural noise increases the stochastic variability of the neural response during stimulus encoding (Chandrasekaran et al., 2009). One of the strong predictions of the neural noise hypothesis is that neural noise should affect speech per-ception even under ideal listening conditions, that is, in the absence of external noise, and one should be able to detect the consequences of such a deficit if sufficiently sensitive measures were used.
The goals of the present study were threefold. First, we investigated speech perception deficits in silence, envelope and noise in children
of dyslexia based on a variety of standardized tests. The results of these formal tests were not available for each child for different reasons. Thus, we cannot exclude the possibility that some of the children had also broader language impairments. Note that we added several cog-nitive and reading measures in the study to further characterize our sample but not for redoing a formal diagnosis of dyslexia. These mea-sures are presented in Table 1 below.
The children with dyslexia were on average 10.3 years old (SD = 0.96 years). Prior to the experiment, reading age was assessed with the Alouette reading test (Lefavrais, 2005), which is the most commonly used standardized reading test in France and which has also the most reliable norms for calculating reading age (Bertrand et al., 2010). Their reading age was 7.3 years, which corresponds to a reading delay of 3 years. Thus, we can safely assume that the dyslexic children who par-ticipated in the present experiment were still quite severely impaired at the time of the study. Typically developing children were matched for reading age based on the Alouette standardized reading test. Their reading age was 7.8, which was not significantly different from that of dyslexic children (see Table 1). Their chronological age was 8.3 years (SD = 0.87 years).
To further characterize the cognitive profile of our sample and to ensure that children with dyslexia were not significantly different from the typically developing children, we added standard tests of verbal and nonverbal IQ, phonology, memory, and attention. Verbal and Nonverbal IQ and memory (digit span) were assessed with the Wechsler Intelligence Scale for Children (WISC IV, Wechsler, 2003). We further used the Raven's Progressive Matrices (PM47, Raven, 1976) to assess nonverbal cognitive abilities. Phonology tests included Rapid Auto-matized Naming (RAN), Phoneme Awareness and Nonword repetition (ODEDYS, Jacquier-Roux et al., 2002). Because speech perception tasks are attention demanding, we also assessed visual and auditory atten-tion. These tests were taken from the NEPSY battery (NEPSY Korkman et al., 2004). The results of these tests are presented in Table 1. Apart from memory, there were no significant differences between the two groups of children on any of these tests.
All children were native French speakers and had normal or cor-rected-to-normal vision, normal audition and no known neurological deficits as determined from a detailed questionnaire completed by parents prior to the experiment. Children had similar socioeconomic backgrounds (middle-to-low social class) as determined from the par-ents’ professions according to the criteria of the National Institute of
Statistics and Economic Studies.
The study was conducted with the understanding and consent of the participants and their parents. It was approved by the National Ethics Committee for Biomedical Research (RCB: 2011-A00172-39). Children were given a small gift at the end of the experiment to thank them for their participation.
2.2. Speech perception task
Speech perception was assessed using a classic ABX paradigm, which has been previously used with children (Sutcliffe and Bishop, 2005). Children were asked to listen to three syllables (A, B, and X) and to decide whether the last syllable (X) was the same as syllable A or as syllable B. They gave their response by pressing one out of two response keys.
Stimuli were the four VCV syllables previously selected by Ziegler et al. (2011) as reflecting the main phonological contrasts in French: voicing (/aba/ vs. /apa/), place of articulation (/aba/ vs. /ada/) and manner of articulation (/aba/ vs. /ava/). Three exemplars of each VCV syllable were recorded by a female speaker of French. Mean duration of the VCV syllable was 625 ms with consonant onset 200 ms after first vowel onset. The ABX task was performed in three conditions: silence, envelope-coded speech, and noise.
In the envelope-coded condition, the stimuli were processed in order to remove temporal fine structure information and smear spectral cues (for details see Gilbert and Lorenzi, 2006). The envelope was ex-tracted in each frequency band using the Hilbert transform. The filtered envelope was used to amplitude modulate a sine wave with a frequency equal to the center frequency of the band, and with a random starting phase. The 12 amplitude-modulated sine waves were summed over all frequency bands.
In the noise condition, a stationary (i.e., unmodulated) speech-shaped noise masker was added to each syllable at a signal-to-noise ratio of 0 dB. This noise masker resembled a pink noise (or low-pass filtered noise) with the particularity that its specific power spectrum mimicked that of real speech (i.e., the long-term power spectrum of speech-shaped noise was identical to that of running speech). All pro-cessed stimuli were equalized in terms of global root mean squared value.
2.3. Procedure
Children were tested individually, in a quiet classroom of the school. Children were told that they could stop the experiment at any moment if they felt uncomfortable (none did). In the first session that lasted for about one hour, children were presented with standard psy-chometric tests. In the second session that lasted for about one hour and a half, all children were tested for speech perception in different con-ditions while their EEG was recorded. Children sat in a comfortable chair at 1-meter distance from a computer screen. In the ABX paradigm, the three VCV syllables were presented successively through head-phones (Sennheiser HD-565) and overall intensity levels were cali-brated from each combination of parameters to produce an average output level of 70 dB(A) for continuous speech (Ziegler et al., 2011). Children were asked to listen to the three syllables (A, B, and X) and to decide whether the last syllable (X) was the same as syllable A or as syllable B by pressing one out of two response keys (counter-balanced across children). On each trial, the three consecutive syllables (A, B and X) were presented in the same form, either in silence or as envelope-coded speech or in stationary noise. Syllable onset asynchrony was 1000 ms with two seconds to give them enough time to give their re-sponse after X, and two seconds for the inter-trial-interval, allowing time for children to blink. Thus, total trial duration was 6 s.
Each child was presented with all conditions (within-participant design). Three phonological contrasts were tested that always included /aba/ either in first (half of the trials) or in second position (half of the
Domain Measure TD DYS t(34) Sign
Age Chronological Age (month) 99.9 123.7 7.7 p < .001 Readinga Reading Age (month) 93.6 87.8 1.3 ns
Nonverbal IQ Progressive Matrices (/36)b 27.6 28.8 0.81 ns
Symbols (/60)c 17.2 18.9 0.83 ns
Verbal IQ Similarities (/44)c 15.4 16.1 0.41 ns
Attentiond Visual Attention Score (/45) 16.9 17.2 0.21 ns
Auditory Attention (/132) 94.8 90.1 0.55 ns Orientation (/10) 6.8 7.3 0.54 ns Visuo-motor precision (/52) 23.1 25.2 1.0 ns
Arrows (/30) 19.6 21.5 1.1 ns
Memoryc Digit Span (/32) 13.2 11.0 3.2 p = .003
Phonologye RAN (seconds) 26.8 27.9 0.41 ns
Phoneme Deletion(/10) 5.9 5.5 0.36 ns Phoneme Fusion (/10) 6.4 5.3 0.99 ns Nonword repetition (/20) 17.3 16.3 0.85 ns aAlouette Standardized Reading Test.
b Progressive Matrices PM47.
c Wechsler Intelligence Scale for Children WISC IV. d NEPSY.
eODEDYS. Table 1
Results of children with dyslexia (DYS) and typically developing readers (TD) who were matched on reading age on measures of reading, verbal and non-verbal intelligence, visual and auditory attention, memory, and phonology.
trials). Each phonological contrast (/aba/ vs. /apa/, /aba/ vs. /ada/ and /aba/ vs. /ava/) was presented 27 times in each condition (silence, envelope-coded and stationary noise), giving a total of 243 trials (i.e., 27 trials × 3 Phonological contrast × 3 conditions). The experiment was divided into 3 blocks of 27 trials. The number of trials corre-sponding to each condition (silence, envelope, and noise; 9 trials each) as well as the number of responses (X = A or X = B; 13/14 trials each) was balanced within each block. Finally, two lists were built to coun-terbalance the order of trial presentation within each block. A total of 30 practice trials using the same phonological contrasts as in the main experiment were presented in 3 blocks of 10 trials each. Trials corre-sponding to each condition, silence, envelope or noise were randomly presented within a block with an equal number of trials in each con-dition.
2.4. ERP recording and processing
The electroencephalogram (EEG) was continuously recorded at a sampling rate of 512 Hz and filtered off-line with a bandpass of 0.1–30 Hz (12 dB/oct), using Biosemi amplifiers system (Amsterdam, BioSemi Active 2). The EEG was recorded from 32 active Ag-Cl elec-trodes mounted on a child-sized elastic cap (Biosemi Pintype) at stan-dard positions of the International 10/20 System (Jasper, 1958). To detect horizontal eye movements and blinks, the electro-oculogram (EOG) was recorded from Flat-type active electrodes placed 1 cm to the left and right of the external canthi, and from an electrode beneath the right eye. Two additional electrodes were placed on the left and right mastoids. Data were re-referenced off-line to the algebraic average of the left and right mastoids.
The EEG data were analyzed using the Brain Vision Analyser soft-ware (Version 01/04/2002; Brain Products, Gmbh). As we were mainly interested in the brain response to the consonant (i.e., /pa/, /da/ and /va/), recordings were segmented based on consonant onset (-200 be-fore consonant onset until 1000 ms post-consonant onset). Epochs with electric activity exceeding baseline activity by ± 75 µV were con-sidered as artifacts and were automatically rejected from further pro-cessing (around 20% for dyslexic and 15% for typically developing readers).
2.5. Data analysis
Student t-tests were computed to analyze the psychometric and speech assessments. Repeated measures Analyses of Variance (ANOVA) were used to analyze behavioral data in the speech perception task (factors are specified below).
Related to the ERP data, two different analyses were performed on
the N1 to the consonant. First, to analyze the time-course of the effects in the different conditions, we computed the latency of N1 maximum amplitude (peak) at Fz where the effects were largest (Dimitrijevic et al., 2013; Naatanen and Picton, 1987). To select the N1 peak within the 0– 300 ms latency window we used an automatic detection proce-dure on individual averages (maximum amplitude automatically pro-posed by the software). Each value was then validated by one of the authors (AF). We also analyzed the N1 maximum amplitude (peak) in both groups and in the different conditions. Second, to further analyze the amplitude of the effects and their scalp distribution, we computed mean amplitude values of the N1 component in latency windows cen-tered on the average of the automatically-computed N1 peak latency values at Fz (as described above) across children with dyslexia and typically developing children. The duration of the latency window in each condition (Silence, Envelop and Noise) was computed based on the average duration of the between-group differences across the 9 electrodes and the 3 phonological contrasts. These values were entered into repeated-measure ANOVAs that included Group (DYS vs TD) as a between-subject factor and Phonological Contrast (voicing, place, manner) as within-subject factor. Midline analyses included Electrodes (Fz, Cz, and Pz) and lateral analyses included Laterality (left vs right hemisphere) as well as anterior-posterior regions (frontal, central and parietal Regions of Interest, ROI) and Electrodes (3 electrodes for each ROI) as within-subject factors. P-values were corrected using the Greenhouse-Geisser correction for nonsphericity (i.e., to avoid Type I errors; Greenhouse and Geisser, 1959) and Fisher tests were used for post-hoc comparisons. 3. Results
3.1. Speech perception task 3.1.1. Behavior
Mean response accuracy (% errors) and reaction times (RTs) are presented in Fig. 1. The data were submitted to an analysis of variance (ANOVA) with Group (DYS vs TD) as a between-subjects factor and Condition (silence, envelope, noise) and Phonological Contrast (voi-cing, place, manner) as within-subject factors.
The results of the ANOVA on the percentage of errors revealed that the main effect of Group was not significant (F(1,34) = 2.31, p = .14). The main effect of Condition was significant (F(2,68) = 25.66, p < .001) with fewer errors in silence and in envelope than in noise (both ps < 0.001). The main effect of Phonological Contrast (F(2,68) = 1.62, p = .21) failed to reach significance. None of the higher-order interactions involving the Group factor were significant [Group by Phonological Contrast: (F(2,68) = 1.17, p > .32), Group by Condition
Fig. 1. Behavioral data. (A) Percentage of errors as a function of group (DYS and TD), condition (silence, envelope, noise) and phonological contrast (voicing, place, manner). (B) Reaction time data in ms. TD and DYS are depicted in black and gray, respectively. The bars show the standard error of the mean (SEM). ** indicates the significant between-group difference for the place of articulation in noise. In the RT data, all group comparisons are significant for each contrast.
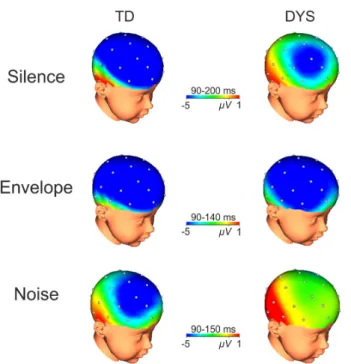
In the Silence condition (90–200 ms latency window), the N1 was
−5.80 µV vs −3.17 µV; F(1,34) = 5.08, p = .03; lateral: −4.97 µV vs −2.96 µV; F(1,34) = 3.92, p = .05; seeFig. 2). Overall, the N1 was also larger at frontal and central sites than at parietal sites (main effect of Anterior/Posterior at midline: F(2,68)= 5.91, p = .006 and at lateral
electrodes: F(2,68) = 29.36, p < .001, seeFig. 3andTable 3). The
main effect of Phonological Contrast was only significant at lateral electrodes (F(2,68) = 4.77, p = .01): the N1 was larger to /pa/ and /da/ than to /va/ (/pa/ (-4.74 µV) vs /va/ (-2.77 µV): p = .005 and /da/ (-4.39 µV) vs /va/ (-2.77 µV): p = .02). Finally, the Group by Phonological Contrast interaction was significant, reflecting that only for /pa/ the N1 was larger for TD than for DYS at midline (TD (-7.23 µV) vs DYS (-2.06 µV), F(2,68) = 4.54, p = .01) and at lateral electrodes (TD (-6.77 µV) vs DYS (-2.72 µV), F(2,68) = 4.62, p = .01). In the envelope condition (90–140 ms latency window), the N1 was larger in TD than in DYS at midline and at lateral electrodes (-6.40 µV vs −3.80 µV; F(1,34) = 4.38, p = .04 and −5.71 µV vs −3.29 µV: F (1,34) = 7.42, p = .01, respectively). Overall, the N1 was also larger at frontal and central sites than at parietal sites (main effect of Anterior/Posterior at midline, midline: F(2,68) = 4.80, p = .02 and lateral: F (2,68) = 13.94, p = .001, see Fig. 3 and Table 3). Moreover, the Group by Laterality interaction was also significant (F(1,34) = 5.56, p = .02) with larger N1 for TD (-6.36 µV) than for DYS (-3.15 µV) over the right hemisphere (see Fig. 4). The main effect of Phonological Contrast was significant at lateral electrodes (F(2,68) = 8.84, p = .001) reflecting that the N1 was significantly larger to /pa/ than to /da/ and to /va/(/ pa/ (-6.86 µV) vs /da/ (-3.97 µV); p = .006 and /pa/ (-6.86 µV) vs /va/ (-2.68 µV), p < .001). The Group by Phonological Contrast in-teraction was not significant (F < 1).
In the Noise condition (90–150 ms latency window), the main effect of Group was not significant neither at midline electrodes (F(1,34) = 2.52, p = .14) nor at lateral electrodes (F(1,34) = 1.88, p = .18). The N1 was larger at frontal and central sites than at parietal sites (main effect of Anterior/Posterior at midline, F(2,68) = 6.83, p = .002 and at lateral electrodes: F(2,68) = 26.74, p < .001, see Table 3). Neither the main effect of Phonological Contrast (midline: p = .13 and lateral: p = .30) nor the Group by Phonological Contrast interaction were sig-nificant (Fs < 1 for both midline and lateral electrodes).
4. Discussion
The present study investigated whether children with dyslexia showed specific deficits in the perception of three phonetic features in silence, envelope and noise using both standard behavioral and elec-trophysiological measures. Performance of children with dyslexia was compared to that of younger typically developing children who were matched in terms of reading age (Goswami, 2003). The main findings can be summarized as follows.
First, in terms of accuracy, there were no significant group differ-ences and no significant interactions with group. This is not totally surprising because auditory or speech perception deficits are not always easy to obtain in a reading age comparison. For example, a recent study by Calcus et al. (2016) found speech-in-noise perception deficits on identification accuracy in the chronological age but not in the reading age comparison. Planned comparisons of the accuracy data in terms of reception of specific phonetic features nevertheless replicated the place-of-articulation deficit in stationary noise previously reported by Ziegler et al. (2009). Note that Calcus et al. (2016) found no specific deficits for place of articulation or voicing, which is at odds with previous studies (Hazan et al., 2013; Lorenzi et al., 2000; Ziegler et al., 2011; Ziegler et al., 2005).
Second, the reaction time data showed that dyslexic children re-sponded more slowly than typically developing children across all conditions (even silence). This is a striking finding because typically-developing children were about two years younger, yet they responded consistently more quickly than the dyslexic children and this despite
Table 2
Results of statistical analyses on N1 latency at Fz electrode. ANOVA included Group (TD versus DYS) as a between-subjects factor as well as Condition (Silence, Envelope and Noise) and Phonological Contrast (/pa/, /da/ and /va/) as within-subject factors.
Effect df F-value p-value
Group (1,34) 9.04 0.005
Condition (2,68) 7.01 0.002
Phonological Contrast (2,68) 1.66 0.20
Group X Condition (2,68) 27.28 < 0.001
Group X Phonological Contrast (2,68) 6.92 0.002 Condition X Phonological Contrast (4,136) 3.00 0.02 Group X Condition X Phonological Contrast (4,136) 12.44 < 0.001
(F < 1) and Group by Condition by Phonological Contrast interactions (F(4136) = 1.04, p > .39)]. Planned comparisons were performed to test whether DYS were specifically impaired in one or several phonetic contrasts. As previously reported by Ziegler et al. (2009), the only significant difference between DYS and TD was found for place of ar-ticulation in noise (p = .002).
Results of the ANOVA on RTs showed that the main effect of Group was significant (F(1,34) = 15.74, p < .001) with faster RTs for TD (845 ms) than for DYS (1197 ms). The main effects of Condition and of Phonological Contrast were not significant (F(2,68) = 1.99, p = .14 and (F(2,68) = 1.05, p = .36, respectively). The Group by Condition was significant (F(2,68)= 3.56, p = .03) with largest between-group differences in noise (450 ms), intermediate differences in envelope (323 ms) and smallest differences in silence (282 ms). Note, however, that the group difference was even significant in silence (F(1, 34) = 11.23, p = .006). The Group by Phonological Contrast and the Group by Condition by Phonological Contrast were not significant (F(2,68) = 1.64, p = .20 and F(4136) = 1.22, p = .31, respectively).
3.2. ERP averages time-locked to consonant onset 3.2.1. Latency and peak value analyses (Fz)
To investigate the time-course of the electrophysiological correlates of the perception of phonetic contrasts in DYS and TD, we computed an ANOVA on N1 peak latency at frontal sites (Fz) where effects were largest (Dimitrijevic et al., 2013; Naatanen and Picton, 1987). The ANOVA included Group (TD versus DYS) as a between-subjects factor and Condition (silence, envelope, and noise) and Phonological Contrast (/pa/, /da/ and /va/) as within-subject factors.
Results showed significant main effects of Group and Condition as well as Group by Condition, Group by Phonological Contrast and Group by Condition by Phonological Contrast interactions (see Table 2). The main finding was that the latency of the N1 to /da/ in noise was sig-nificantly longer in DYS (201 ms) than in TD (59 ms, p < .001), with no such differences found for /pa/ (p > .25) or /va/ (p > .32; Group by Condition by Phonological Contrast: F(4136) = 12.44, p < .001, see Fig. 2).
Results on N1 maximum amplitude (peak) revealed no main effect of Group (F(1,34) = 1.34, p = .26). The Group by Phonological Contrast interaction just failed to reach significance (F(2,68) = 2.91, p = .06). N1 amplitude were larger to /pa/ in TD (-11.60 µV) than in DYS (-8.40 µV). Finally, the Group by Condition interaction was sig-nificant (F(2,68) = 4.61, p = .01) with larger N1 amplitude in silence in TD (-12.17 µV) than in DYS (-7.89 µV; see Fig. 2).
3.2.2. Mean amplitude analyses
To further examine between-group differences in the perception of phonological contrasts as well as the scalp distribution of the effects, we analyzed N1 mean amplitude independently for each condition of presentation, silence, envelope, and noise at all electrodes sites.
the fact that no differences were obtained between the two groups in terms of visual and auditory attention, visuo-motor precision, rapid automatized naming, or nonverbal IQ (see Table 1). To our knowledge, reaction times are rarely considered in the classic speech identification tasks (e.g., perceptual categorization and discrimination), and the re-sults highlight very clear processing costs of dyslexic children in terms of response speed that “survive” the reading age comparison. Thus, it seems as if close-to-normal performance in speech perception accuracy comes at the expense of increased processing time and effort.
Third, when investigating the on-line syllable encoding process by means of ERP measures, we found that dyslexic children exhibited re-duced N1 components in silence and the reduction of N1 amplitude was more pronounced for voicing than for place of articulation and manner of articulation. Thus, there is clear evidence for abnormal neural pro-cessing in the absence of external noise (i.e., silence). We will discuss this finding below with respect to the neural noise hypothesis.
Fourth, there were clear differences on N1 amplitude in the en-velope-coded speech condition that were localized over the right hemisphere (see Fig. 4). The right lateralization of the N1 in the en-velope condition is in line with the fast growing literature on the cou-pling between brain oscillations and speech rhythms in adults and in children showing larger speech-related modulations (delta, theta fre-quency range) in the right than left superior temporal regions (Giraud and Poeppel, 2012; Morillon et al., 2010) and atypical right hemisphere responses in dyslexia to slow temporal modulations (Cutini et al., 2016) and deficits in the neural encoding of the speech envelope (Power et al.,
2016).
Finally, in stationary noise, the N1 was clearly delayed in children with dyslexia, which suggests a temporal de-organization in the most adverse listening conditions. Interestingly, this was most clearly seen for place of articulation in noise, which was the only condition to produce a significant accuracy effect in the behavioral data. In fact, it is well-known that voicing and nasality are less affected by noise than place of articulation, which tends to be severely affected by low-pass and noisy systems (Binnie et al., 1974; Miller and Nicely, 1955). We will now discuss the implications of these findings.
4.1. Neural noise, noise exclusion, perceptual anchoring
The present results can be discussed in the context of the perceptual noise exclusion (Sperling et al., 2005) and the neural noise hypotheses (Hancock et al., 2017). Indeed, the response pattern in the accuracy data and the interaction between group and condition in the RT data can be taken as support of the first hypothesis because the RT differ-ences were larger in noise than in silence and because the only sig-nificant behavioral deficit on accuracy was obtained in noise. These results are in line with stronger speech perception deficits for children with dyslexia in noise than in silence (Vanvooren et al., 2017; Ziegler et al., 2009). Moreover, also in line with the perceptual noise exclusion hypothesis, the electrophysiological responses related to the encoding of the syllables only revealed a temporal “breakdown” of the N1 latency to / da/ in noise but not in any of the other conditions. However, we
Fig. 2. Electrophysiological data. Grand average ERP across participants over Fz electrode for the interaction between the effects of group, condition and phono-logical contrast with typically developing children (TD) in thick lines and dyslexic children (DYS) in dotted lines. The most relevant differences are highlighted in red showing that DYS present an attenuated N1 for voicing in silence as compared to TD, and DYS exhibit a temporal breakdown of the N1 latency for the place of articulation in noise.
also obtained significant RT differences between children with dyslexia and typically developing children in silence, which is in line with the idea that children with dyslexia are also affected by the presence of internal neural noise (Hancock et al., 2017; Ziegler et al., 2009). This claim is supported by a general reduction in N1 amplitude for children with dyslexia compared to typically developing children that was most pronounced in silence. Finding abnormal neural responses in silence was a clear prediction of the neural noise hypothesis. Note that the robust deficit in reaction times found in children with dyslexia can also be explained in terms of deficits in perceptual anchoring (Ahissar, 2007; Ahissar et al., 2006), a theory which tends to make very similar pre-dictions as the neural noise theory (Ziegler, 2008). Indeed, in our ex-periment, /ba/ served as a reference (i.e., an anchor) across all feature conditions (voicing: /ba/ versus /pa/; place: /ba/ versus /da/, manner: /ba/ versus /va/). If participants failed to set /ba/ as a perceptual anchor, this would imply that they would need to re-compute /ba/ on every trial in order to make the required comparisons. This would clearly result in processing costs across all conditions. Such findings are in line with the reports of increased variability in the neural response to repeated presentations of the same stimulus (Chandrasekaran et al., 2009). In any case, given that the reaction time differences were ob-tained in comparison to a group of younger children matched for reading age who were not different in terms of attention, response
Fig. 3. Electrophysiological data. Topographical maps for the interaction be-tween the effects of group and condition. The maps show the scalp distribution of the N1 components for the three conditions (averaged across phonetic con-trasts) and in both groups with typically developing children (TD) on the left and dyslexic children (DYS) on the right. The time-windows used for the maps are reported for each condition.
Table 3
Mean amplitude of the N1 component in the three experimental conditions over Frontal, Central and Parietal sites in the midline and lateral analyses.
Midline Analysis Lateral Analysis
Front. Cent. Par. Front. Cent. Par. Silence − 4.99 − 5.22 − 3.26 − 4.86 − 5.23 − 1.81 Envelope − 5.14 − 6.10 − 4.06 − 5.02 − 5.62 − 2.87 Noise − 4.02 − 3.85 − 1.85 − 2.65 − 3.31 − 0.37
Fig. 4. Electrophysiological data. Grand average ERPs across participants over 6 electrodes for the interaction between the effects of group and laterality in the envelope condition with typically developing children (TD) in thick lines and dyslexic children (DYS) in dotted lines. The most relevant differences are highlighted in red showing the attenuated N1 in DYS compared to TD over the right hemisphere.
execution, rapid automatized naming or phonological awareness, this deficit seems to reflect fundamental differences rather than a simple developmental delay.
4.2. Phonetic feature differences
Another important finding was that speech perception deficits were larger for some phonetic features (place of articulation in noise and voicing in silence) than for others. First of all, this replicates Ziegler et al.’s (2009) finding that children with dyslexia show specific deficits for place of articulation in noise. Second, such specific deficits suggest that the impairment is linked to the nature of the speech signal rather than to limitations of cognitive resources, such as general slowing or lapses of attention (Davis et al., 2001). Yet, it is not fully clear why place of articulation is more affected in dyslexia than voicing while the opposite has been found in children with specific language impairments (Ziegler et al., 2011, 2005). It is well known that listeners with sen-sorineural hearing loss also show larger deficits for the perception of place of articulation than for other phonetic contrasts such as voicing or manner of articulation (Baer et al., 2002; Vickers et al., 2001). How-ever, this explanation is not satisfying because children with dyslexia are very different from children with hearing loss because they do not have low-level peripheral deficits, which is confirmed by the fact they exhibit normal masking release in fluctuating background noise (Calcus et al., 2016; Fullgrabe et al., 2006; Ziegler et al., 2005, 2009). A second explanation is that information transmission of place of articulation is more affected by noise than the other features (Binnie et al., 1974; Miller and Nicely, 1955). This would render this condition particularly
2005), the performance in this task was deceivingly poor even in si-lence. This is somewhat surprising given that the 16-alternative forced-choice procedure by Ziegler et al. (2009), which is much more de-manding, produced better consonant identification in silence than the supposedly simpler ABX paradigm. Thus, the present behavioral data need to be interpreted with caution because of the relatively high error rate. However, this problem does not affect the quality and interpret-ability of the ERP data because we do not analyze ERPs related to the response but the early stages of stimulus encoding, as reflected by the early components of the auditory evoked potentials. In that respect, the ERP data are relatively independent of performance in the ABX task and more comparable to passive listening conditions.
Another limitation is that the present data are purely correlational and do not allow us to make any causal claims. Thus, longitudinal or intervention studies are needed (e.g., Franceschini et al., 2012; Franceschini et al., 2013; Gori et al., 2015a, 2015b; Vanvooren et al., 2017). Several results in the literature point to the positive influence of music training on the encoding of speech in noise in adults and children (Francois et al., 2013, 2015; Parbery-Clark et al., 2009; Parbery-Clark et al., 2012; Slater et al., 2015; Strait et al., 2012; Strait et al., 2013). Thus, it would be of interest to train dyslexic children with music to test for a causal link between speech-in-noise perception, speech envelope processing and dyslexia.
Acknowledgements
This research, carried out within the Labex BLRI (ANR-11-LABX-0036) and the Institute of Convergence ILCB (ANR-16-CONV-0002), has benefited from support from the French government, managed by the French National Agency for Research (ANR) and the Excellence Initiative of Aix-Marseille University (A*MIDEX). This research was further supported by a grant from the ANR-Neuro (#024-01 to MB). At the time the study was conducted, JC and CF were PhD students sup-ported by the ANR-Neuro (#024-01). CF is now a post-doctoral re-searcher supported by a Spanish MINECO grant (PSI2015-69132P) and by the Catalan Government (Generalitat de Catalunya-PERIS 2016–2020). We are thankful to Jean-Luc Velay, Daniele Schön and Michel Habib for their precious help in organizing the procedures, as-pects of data processing and access to the elementary schools. We also thank the directors of the two schools where the children were tested, Mrs Muriel Gaiarsa and Mr Jean-Jacques Gaubert, the teachers of the schools, as well as all the children who participated in this study and their parents.
References
Ahissar, M., 2007. Dyslexia and the anchoring-deficit hypothesis. Trends Cogn. Sci. 11, 458–465.
Ahissar, M., Lubin, Y., Putter-Katz, H., Banai, K., 2006. Dyslexia and the failure to form a perceptual anchor. Nat. Neurosci. 9, 1558–1564.
Anderson, S., White-Schwoch, T., Parbery-Clark, A., Kraus, N., 2013. Reversal of age-related neural timing delays with training. Proc. Natl. Acad. Sci. USA 110, 4357–4362.
Baer, T., Moore, B.C., Kluk, K., 2002. Effects of low pass filtering on the intelligibility of speech in noise for people with and without dead regions at high frequencies. J. Acoust. Soc. Am. 112, 1133–1144.
Belin, P., Zilbovicius, M., Crozier, S., Thivard, L., Fontaine, A., Masure, M.C., Samson, Y., 1998. Lateralization of speech and auditory temporal processing. J. Cogn. Neurosci. 10, 536–540.
Bertrand, D., Fluss, J., Billard, C., Ziegler, J.C., 2010. Efficacité, sensibilité, spécificité: comparaison de différents tests de lecture [Efficiency, sensitivity, specificity: com-parison of different reading tests]. Annee Psychol. 110, 299–320.
Billings, C.J., Bennett, K.O., Molis, M.R., Leek, M.R., 2011. Cortical encoding of signals in noise: effects of stimulus type and recording paradigm. Ear Hear 32, 53–60. Binnie, C.A., Montgomery, A.A., Jackson, P.L., 1974. Auditory and visual contributions to
the perception of consonants. J. Speech Lang. Hear. Res. 17, 619–630. Boets, B., Wouters, J., van Wieringen, A., Ghesquiere, P., 2007. Auditory processing,
speech perception and phonological ability in pre-school children at high-risk for dyslexia: a longitudinal study of the auditory temporal processing theory. Neuropsychologia 45, 1608–1620.
Bogliotti, C., Serniclaes, W., Messaoud-Galusi, S., Sprenger-Charolles, L., 2008.
difficult, which might lead to the temporal “breakdown” of the N1 to / da/ in noise. This is in line with the suggestion that listening to speech in noise increases temporal jitter and produces loss of neural synchrony within the inferior colliculus (Anderson et al., 2013). Indeed, using MEG, Helenius et al. (2002) also showed abnormal timing of the N1m in response to natural bisyllabic pseudowords (/ata/ versus /atta/) but not for non-speech sounds. They concluded that “dyslexia is reflected as abnormal activation of the auditory cortex already 100 msec after speech onset, manifested as abnormal response strengths for natural speech and as delays for speech sounds containing rapid frequency transition” (Helenius et al., 2002). To what extent the specific effects for place of articulation relate to the deficits in processing fast transient components of speech signal remains unclear (Nagarajan et al., 1999).
Place of articulation was not the only phonological contrast that was differently processed by dyslexic children as compared to typically developing readers. Analyses of the maximum and mean amplitude of the N1 component revealed that the N1 to the voicing contrast (/pa/) was smaller in dyslexics than in typical readers in silence (but not in noise or envelope conditions). Larger amplitudes are generally taken to reflect the activation of larger neuronal population, stronger neural connections or higher discharge synchrony of neuronal populations (Tremblay et al., 2001) with recent work possibly favoring the last possibility. Interestingly, Wible et al. (2002) suggested that higher synchrony at the level of the brainstem to encode transient acoustic information is associated with larger amplitude of the cortical AEPs. These authors also reported that this relationship was weaker in some of the children with auditory perception and language difficulties. 4.3. Envelope-coded speech
The envelope condition served two purposes. First, it provided a way to degrade the speech signal without adding noise. Second, it al-lowed to test a key prediction of the temporal sampling theory of dyslexia (Goswami, 2011; Goswami et al., 2014), according to which children with dyslexia show deficits in the neural encoding of the speech envelope (Power et al., 2016). In the accuracy data, no deficit was found in the envelope condition. In the ERP data, while the N1 showed the typical fronto-central scalp distribution in all conditions (Picton et al., 1995), only in the envelope condition was the difference in N1 amplitude between children with dyslexia and typically devel-oping children larger over the right than the left hemisphere. This inter-hemispheric difference was predicted by the temporal sampling theory, following which the left and right auditory cortices are specialized to process acoustic features at different time scales (Belin et al., 1998; Giraud and Poeppel, 2012; Morillon et al., 2012). While the right au-ditory cortex seems to preferentially process low-frequency temporal features (~200 ms; 3–7 Hz; syllables), the left auditory cortex seems to be rather tuned to fast, high-frequency temporal features (~20–50 ms; 20–50 Hz; phonemes). Our ERP results are consistent with the evidence in favor of the hypothesis that the perception of speech rhythm, which is reflected in the slower rates of energy variation (< 10 Hz), is im-paired in developmental dyslexia (for reviews, see Goswami, 2011, 2015). For example, in a recent EEG study, it was found that speech envelopes in a 0 – 2 Hz (delta) band were encoded less accurately by children with dyslexia, even when they were compared to reading-level matched children who were 2 years younger (Power et al., 2016). Si-milarly, Hamalainen et al. (2012) investigated the perception of am-plitude-modulated white noise at slow and fast temporal rates (2 Hz, 4 Hz, 10 Hz, 20 Hz) in English-speaking adult dyslexics and found sig-nificantly reduced phase entrainment in right hemisphere auditory networks, but for the 2 Hz rate only (but see Vanvooren et al., 2014).
4.3.1. Limitations and future directions
Although we used a three-item comparison paradigm (ABX), which has been shown to be better suited in developmental investigations than the classic two-interval, forced-choice procedure (Sutcliffe and Bishop,
sponses to speech in noise in children with learning problems: deficits and strategies for improvement. Clin. Neurophysiol. 112, 758–767.
Cutini, S., Szucs, D., Mead, N., Huss, M., Goswami, U., 2016. Atypical right hemisphere response to slow temporal modulations in children with developmental dyslexia.
Neuroimage 143, 40–49.
Davis, C., Castles, A., McAnally, K., Gray, J., 2001. Lapses of concentration and dyslexic performance on the Ternus task. Cognition 81, B21–B31.
Dehaene, S., Cohen, L., Morais, J., Kolinsky, R., 2015. Illiterate to literate: behavioural and cerebral changes induced by reading acquisition. Nat. Rev. Neurosci. 16, 234–244.
Dehaene, S., Pegado, F., Braga, L.W., Ventura, P., Nunes Filho, G., Jobert, A., Dehaene-Lambertz, G., Kolinsky, R., Morais, J., Cohen, L., 2010. How learning to read changes the cortical networks for vision and language. Science 330, 1359–1364. Demonet, J.F., Taylor, M.J., Chaix, Y., 2004. Developmental dyslexia. Lancet 363,
1451–1460.
Dimitrijevic, A., Pratt, H., Starr, A., 2013. Auditory cortical activity in normal hearing subjects to consonant vowels presented in quiet and in noise. Clin. Neurophysiol. 124, 1204–1215.
Dole, M., Hoen, M., Meunier, F., 2012. Speech-in-noise perception deficit in adults with dyslexia: effects of background type and listening configuration. Neuropsychologia 50, 1543–1552.
Dole, M., Meunier, F., Hoen, M., 2014. Functional correlates of the speech-in-noise per-ception impairment in dyslexia: an MRI study. Neuropsychologia 60, 103–114. Franceschini, S., Gori, S., Ruffino, M., Pedrolli, K., Facoetti, A., 2012. A causal link
be-tween visual spatial attention and reading acquisition. Curr. Biol. 22, 814–819. Franceschini, S., Gori, S., Ruffino, M., Viola, S., Molteni, M., Facoetti, A., 2013. Action
video games make dyslexic children read better. Curr. Biol. 23, 462–466. Francois, C., Chobert, J., Besson, M., Schon, D., 2013. Music training for the development
of speech segmentation. Cereb. Cortex 23, 2038–2043.
Francois, C., Grau-Sanchez, J., Duarte, E., Rodriguez-Fornells, A., 2015. Musical training as an alternative and effective method for neuro-education and neuro-rehabilitation. Front Psychol. 6, 475.
Fullgrabe, C., Berthommier, F., Lorenzi, C., 2006. Masking release for consonant features in temporally fluctuating background noise. Hear. Res. 211, 74–84.
Gilbert, G., Lorenzi, C., 2006. The ability of listeners to use recovered envelope cues from speech fine structure. J. Acoust. Soc. Am. 119, 2438–2444.
Giraud, A.L., Poeppel, D., 2012. Cortical oscillations and speech processing: emerging computational principles and operations. Nat. Neurosci. 15, 511–517.
Godfrey, J.J., Syrdal-Lasky, A.K., Millay, K.K., Knox, C.M., 1981. Performance of dyslexic children on speech perception tests. J. Exp. Child Psychol. 32, 401–424. Gori, S., Seitz, A., Ronconi, L., Franceschini, S., Facoetti, A., 2015a. The causal link
be-tween magnocellular-dorsal pathway functioning and dyslexia. J. Vis. 15, 195. Gori, S., Seitz, A., Ronconi, L., Franceschini, S., Facoetti, A., 2015b. Multiple causal links
Between magnocellular-dorsal pathway deficit and Developmental dyslexia. Cereb. Cortex.
Goswami, U., 2003. Why theories about developmental dyslexia require developmental designs. Trends Cogn. Sci. 7, 534–540.
Goswami, U., 2011. A temporal sampling framework for developmental dyslexia. Trends Cogn. Sci. 15, 3–10.
Goswami, U., 2015. Sensory theories of developmental dyslexia: three challenges for research. Nat. Rev. Neurosci. 16, 43–54.
Goswami, U., Power, A.J., Lallier, M., Facoetti, A., 2014. Oscillatory “temporal sampling” and developmental dyslexia: toward an over-arching theoretical framework. Front Hum. Neurosci. 8, 904.
Greenhouse, S.W., Geisser, S., 1959. On methods in the analysis of profile data. Psychometrika 24 (2), 95–112.
Hamalainen, J.A., Leppanen, P.H., Guttorm, T.K., Lyytinen, H., 2007. N1 and P2 com-ponents of auditory event-related potentials in children with and without reading disabilities. Clin. Neurophysiol. 118, 2263–2275.
Hamalainen, J.A., Leppanen, P.H., Guttorm, T.K., Lyytinen, H., 2008. Event-related po-tentials to pitch and rise time change in children with reading disabilities and typi-cally reading children. Clin. Neurophysiol. 119, 100–115.
Hamalainen, J.A., Rupp, A., Soltesz, F., Szucs, D., Goswami, U., 2012. Reduced phase locking to slow amplitude modulation in adults with dyslexia: an MEG study. Neuroimage 59, 2952–2961.
Hancock, R., Pugh, K.R., Hoeft, F., 2017. Neural noise hypothesis of developmental dyslexia. Trends Cogn. Sci. 21, 434–448.
Hazan, V., Messaoud-Galusi, S., Rosen, S., 2013. The effect of talker and intonation variability on speech perception in noise in children with dyslexia. J. Speech, Lang. Hear. Res. 56, 44–62.
Helenius, P., Salmelin, R., Richardson, U., Leinonen, S., Lyytinen, H., 2002. Abnormal auditory cortical activation in dyslexia 100 msec after speech onset. J. Cogn. Neurosci. 14, 603–617.
Hornickel, J., Skoe, E., Nicol, T., Zecker, S., Kraus, N., 2009. Subcortical differentiation of stop consonants relates to reading and speech-in-noise perception. Proc. Natl. Acad. Sci. USA 106, 13022–13027.
Jacquier-Roux, M., Valdois, S., Zorman, M., 2002. ODEDYS: un outil de dépistage des dyslexies. Laboratoire Cogni-Sciences, IUFM de Grenoble, Grenoble. Jasper, H.H., 1958. The ten-twenty electrode system of the international federation.
Electroenceph. Clin. Neurophysiol. 10, 371–375.
Johnson, K.L., Nicol, T.G., Zecker, S.G., Kraus, N., 2007. Auditory brainstem correlates of perceptual timing deficits. J. Cogn. Neurosci. 19, 376–385.
Kaplan-Neeman, R., Kishon-Rabin, L., Henkin, Y., Muchnik, C., 2006. Identification of syllables in noise: electrophysiological and behavioral correlates. J. Acoust. Soc. Am. 120, 926–933.
Korkman, M., Kemp, S.L., Kirk, U., 2004. NEPSY: bilan neuropsychologique de l'enfant. ECPA (Editions du centre de psychologie appliquée), Paris.
Lefavrais, J., 2005. Test de l’Alouette (revised version). ECPA, Paris.
Lohvansuu, K., Hamalainen, J.A., Tanskanen, A., Ervast, L., Heikkinen, E., Lyytinen, H., Leppanen, P.H., 2014. Enhancement of brain event-related potentials to speech sounds is associated with compensated reading skills in dyslexic children with fa-milial risk for dyslexia. Int. J. Psychophysiol. 94, 298–310.
Lorenzi, C., Dumont, A., Fullgrabe, C., 2000. Use of temporal envelope cues by children with developmental dyslexia. J. Speech, Lang. Hear. Res. 43, 1367–1379. Lovio, R., Naatanen, R., Kujala, T., 2010. Abnormal pattern of cortical speech feature
discrimination in 6-year-old children at risk for dyslexia. Brain Res. 1335, 53–62. Lyytinen, H., Erskine, J., Hamalainen, J., Torppa, M., Ronimus, M., 2015. Dyslexia-early
identification and prevention: highlights from the jyvaskyla longitudinal study of dyslexia. Curr. Dev. Disord. Rep. 2, 330–338.
Manis, F.R., McBride-Chang, C., Seidenberg, M.S., Keating, P., et al., 1997. Are speech perception deficits associated with developmental dyslexia? J. Exp. Child Psychol. 66, 211–235.
Martin, B.A., Sigal, A., Kurtzberg, D., Stapells, D.R., 1997. The effects of decreased au-dibility produced by high-pass noise masking on cortical event-related potentials to speech sounds/ba/and/da. J. Acoust. Soc. Am. 101, 1585–1599.
Miller, G.A., Nicely, P.E., 1955. Analysis of perceptual confusions among some english consonants. J. Acoust. Soc. Am. 27, 338–352.
Morillon, B., Lehongre, K., Frackowiak, R.S., Ducorps, A., Kleinschmidt, A., Poeppel, D., Giraud, A.L., 2010. Neurophysiological origin of human brain asymmetry for speech and language. Proc. Natl. Acad. Sci. USA 107, 18688–18693.
Morillon, B., Liegeois-Chauvel, C., Arnal, L.H., Benar, C.G., Giraud, A.L., 2012. Asymmetric function of theta and gamma activity in syllable processing: an intra-cortical study. Front Psychol. 3, 248.
Naatanen, R., Picton, T., 1987. The N1 wave of the human electric and magnetic response to sound: a review and an analysis of the component structure. Psychophysiology 24, 375–425.
Nagarajan, S., Mahncke, H., Salz, T., Tallal, P., Roberts, T., Merzenich, M.M., 1999. Cortical auditory signal processing in poor readers. Proc. Natl. Acad. Sci. USA 96, 6483–6488.
Norton, E.S., Beach, S.D., Gabrieli, J.D., 2015. Neurobiology of dyslexia. Curr. Opin. Neurobiol. 30, 73–78.
Parbery-Clark, A., Skoe, E., Lam, C., Kraus, N., 2009. Musician enhancement for speech-in-noise. Ear Hear 30, 653–661.
Parbery-Clark, A., Tierney, A., Strait, D.L., Kraus, N., 2012. Musicians have fine-tuned neural distinction of speech syllables. Neuroscience 219, 111–119.
Picton, T., Lins, O., Scherg, M., 1995. The recording and analysis of event-related po-tentials. In: Boller, F., Grafman, J. (Eds.), Handbook of Neuropsychology 10. Elsevier, Amsterdam, pp. 3–73.
Power, A.J., Colling, L.J., Mead, N., Barnes, L., Goswami, U., 2016. Neural encoding of the speech envelope by children with developmental dyslexia. Brain Lang. 160, 1–10. Ramus, F., Rosen, S., Dakin, S.C., Day, B.L., Castellote, J.M., White, S., Frith, U., 2003.
Theories of developmental dyslexia: insights from a multiple case study of dyslexic adults. Brain 126, 841–865.
Raven, J.C., 1976. Standard Progressive Matrices: Sets A, B, C, D & E. Psychologists Press, Oxford.
Saksida, A., Iannuzzi, S., Bogliotti, C., Chaix, Y., Demonet, J.F., Bricout, L., Billard, C., Nguyen-Morel, M.A., Le Heuzey, M.F., Soares-Boucaud, I., George, F., Ziegler, J.C., Ramus, F., 2016. Phonological skills, visual attention span, and visual stress in de-velopmental dyslexia. Dev. Psychol. 52, 1503–1516.
Serniclaes, W., Sprenger-Charolles, L., Carre, R., Demonet, J.-F., 2001. Perceptual dis-crimination of speech sounds in developmental dyslexia. J. Speech Lang. Hear. Res. 44, 384–399.
Serniclaes, W., Van Heghe, S., Mousty, P., Carre, R., Sprenger-Charolles, L., 2004. Allophonic mode of speech perception in dyslexia. J. Exp. Child Psychol. 87, 336–361.
Shannon, R.V., Zeng, F.G., Kamath, V., Wygonski, J., Ekelid, M., 1995. Speech recognition with primarily temporal cues. Science 270, 303–304.
Slater, J., Skoe, E., Strait, D.L., O'Connell, S., Thompson, E., Kraus, N., 2015. Music training improves speech-in-noise perception: longitudinal evidence from a com-munity-based music program. Behav. Brain Res. 291, 244–252.
Snowling, M.J., 2000. Dyslexia. Blackwell, Oxford.
Sperling, A.J., Lu, Z.L., Manis, F.R., Seidenberg, M.S., 2005. Deficits in perceptual noise exclusion in developmental dyslexia. Nat. Neurosci. 8, 862–863.
Sperling, A.J., Lu, Z.L., Manis, F.R., Seidenberg, M.S., 2006. Motion-perception deficits and reading impairment: it's the noise, not the motion. Psychol. Sci. 17, 1047–1053. Strait, D.L., Parbery-Clark, A., Hittner, E., Kraus, N., 2012. Musical training during early
childhood enhances the neural encoding of speech in noise. Brain Lang. 123, 191– 201.
Strait, D.L., Parbery-Clark, A., O'Connell, S., Kraus, N., 2013. Biological impact of Discrimination of speech sounds by children with dyslexia: comparisons with
chronological age and reading level controls. J. Exp. Child Psychol. 101, 137–155. Bradley, J.S., Sato, H., 2008. The intelligibility of speech in elementary school classrooms.
J. Acoust. Soc. Am. 123, 2078–2086.
Calcus, A., Lorenzi, C., Collet, G., Colin, C., Kolinsky, R., 2016. Is there a relationship between speech identification in noise and categorical perception in children with dyslexia? J. Speech Lang. Hear Res 59, 835–852.
Casini, L., Pech-Georgel, C., Ziegler, J.C., 2017. It's about time: revisiting temporal pro-cessing deficits in dyslexia. Dev. Sci. 21 (2), e12530.
Chandrasekaran, B., Hornickel, J., Skoe, E., Nicol, T., Kraus, N., 2009. Context-dependent encoding in the human auditory brainstem relates to hearing speech in noise: im-plications for developmental dyslexia. Neuron 64, 311–319.
re-Hemispheric asymmetry in auditory processing of speech envelope modulations in prereading children. J. Neurosci. 34, 1523–1529.
Vickers, D.A., Moore, B.C., Baer, T., 2001. Effects of low-pass filtering on the intelligibility of speech in quiet for people with and without dead regions at high frequencies. J. Acoust. Soc. Am. 110, 1164–1175.
Wechsler, D., 2003. Wechsler Intelligence Scale for Children - fourth edition.
Psychological Corporation, San Antonio, TX.
White, S., Milne, E., Rosen, S., Hansen, P., Swettenham, J., Frith, U., Ramus, F., 2006. The role of sensorimotor impairments in dyslexia: a multiple case study of dyslexic children. Dev. Sci. 9, 237–255.
Wible, B., Nicol, T., Kraus, N., 2002. Abnormal neural encoding of repeated speech sti-muli in noise in children with learning problems. Clin. Neurophysiolology 113, 485–494.
Ziegler, J.C., 2008. Better to lose the anchor than the whole ship. Trends Cogn. Sci. 12, 244–245.
Ziegler, J.C., Ferrand, L., 1998. Orthography shapes the perception of speech: the con-sistency effect in auditory word recognition. Psychon. Bull. Rev. 5, 683–689. Ziegler, J.C., George, F., Pech-Georgel, C., Lorenzi, C., 2011. Noise on, voicing off: speech
perception deficits in children with SLI. J. Exp. Child Psychol. 110, 362–372. Ziegler, J.C., Pech-Georgel, C., George, F., Alario, F.X., Lorenzi, C., 2005. Deficits in
speech perception predict language learning impairment. Proc. Natl. Acad. Sci. USA 102, 14110–14115.
Ziegler, J.C., Pech-Georgel, C., George, F., Lorenzi, C., 2009. Speech-perception-in-noise deficits in dyslexia. Dev. Sci. 12, 732–745.
preschool music classes on processing speech in noise. Dev. Cogn. Neurosci. 6, 51–60. Sutcliffe, P., Bishop, D., 2005. Psychophysical design influences frequency discrimination
performance in young children. J. Exp. Child Psychol. 91, 249–270.
Thompson, E.C., Woodruff Carr, K., White-Schwoch, T., Tierney, A., Nicol, T., Kraus, N., 2016. Hemispheric asymmetry of endogenous neural oscillations in young children: implications for hearing speech in noise. Sci. Rep. 6, 19737.
Tremblay, K., Kraus, N., McGee, T., Ponton, C., Otis, B., 2001. Central auditory plasticity: changes in the N1-P2 complex after speech-sound training. Ear Hear 22, 79–90. Vanvooren, S., Poelmans, H., De Vos, A., Ghesquière, P., Wouters, J., 2017. Do prereaders'
auditory processing and speech perception predict later literacy? Res Dev. Disabil. 70, 138–151.