HAL Id: hal-01076864
https://hal.archives-ouvertes.fr/hal-01076864
Submitted on 23 Oct 2014
HAL is a multi-disciplinary open access archive for the deposit and dissemination of sci-entific research documents, whether they are pub-lished or not. The documents may come from teaching and research institutions in France or abroad, or from public or private research centers.
L’archive ouverte pluridisciplinaire HAL, est destinée au dépôt et à la diffusion de documents scientifiques de niveau recherche, publiés ou non, émanant des établissements d’enseignement et de recherche français ou étrangers, des laboratoires publics ou privés.
From Integrative Taxonomy to Species Description: one
Step Beyond
Eric Pante, Charlotte Schoelinck, Nicolas Puillandre
To cite this version:
Eric Pante, Charlotte Schoelinck, Nicolas Puillandre. From Integrative Taxonomy to Species Descrip-tion: one Step Beyond: Species delimitation and description. Systematic Biology, Oxford University Press (OUP), 2015, 64 (1), pp.152-160. �10.1093/sysbio/syu083�. �hal-01076864�
SPECIES DELIMITATION AND DESCRIPTION 1
2
From Integrative Taxonomy to Species Description: one Step Beyond
3 4
Pante E.1*, Schoelinck C.2*, Puillandre N.3 5
6
1
Littoral, Environnement et Sociétés (LIENSs) UMR 7266 CNRS, Université de La Rochelle,
7
La Rochelle, France. [email protected]
8
2
Fisheries and Oceans Canada, Aquatic animal health, 343, University Avenue E1C 9B6
9
Moncton N.B., Canada. [email protected]
10
3
Muséum National d’Histoire Naturelle, Département Systématique et Evolution, ISyEB
11
(UMR 7205 CNRS/UPMC/MNHN/EPHE), 43, Rue Cuvier, 75231 Paris, France.
12
13 14
Corresponding author: Nicolas Puillandre, Muséum National d’Histoire Naturelle,
15
Département Systématique et Evolution, ISyEB (UMR 7205 CNRS/UPMC/MNHN/EPHE), 43,
16
Rue Cuvier, 75231 Paris, France. [email protected]. Tel: +33 1 40 79 31 73. Fax: +33 1
17
40 79 38 44
18 19
* Both authors contributed equally to this work
20 21
Keywords
22
Cryptic species, grey zone, impact factor, literature review, species complex, species 23
delimitation, species hypotheses, taxonomic impediment. 24
The first part of knowledge is getting the names right
25
Chinese proverb 26
27
Integrative taxonomy was formally introduced in 2005 as a comprehensive framework 28
to delimit and describe taxa by integrating information from different types of data and 29
methodologies (Dayrat 2005; Will et al. 2005). Even if debate remains about the hierarchy of 30
the types of characters and criteria to use for species delimitation (Schlick-Steiner et al., 2009; 31
Padial et al., 2010; Yeates et al., 2011), most, if not all taxonomists agree that objectively 32
evaluating several lines of evidence within a formalized framework is the most efficient and 33
theoretically-grounded approach to defining robust species hypotheses (Samadi and 34
Barberousse 2006; de Queiroz 2007).The last ten years have seen a renewal of taxonomy, 35
illustrated by the increasing number of published articles related to species concepts, species 36
delimitation methodology and its application. 37
In the early 90s, many systematists began to suspect that the majority of species would 38
remain undescribed (Costello et al. 2013a; Erwin 1982; Mora et al. 2011 – but see Costello et 39
al. 2013b) and that some of them will probably go extinct before we have a chance to describe 40
them (Barnosky et al., 2011; Leakey and Lewin, 1995; Pimm et al., 2006). The use of 41
molecular data, and in particular molecular barcoding (Hebert et al., 2003), was presented as 42
one answer to this “taxonomic impediment” (as defined in Rodman and Cody, 2003), and 43
welcomed as such by taxonomists. It thus adds to the toolkit of taxonomy, which continues its 44
development as a synergic discipline involving morphological taxonomists, field ecologists, 45
naturalists, and statisticians (Knapp 2008). Integrative taxonomy, used for many decades by 46
taxonomists but only recently formalized concomitantly with the molecular revolution, is 47
organised following a three-step workflow (see also Evenhuis 2007): first, we need to 48
accumulate data on numerous specimens (from various types of data: DNA, morphology, 49
ecology…); second, we need to circumscribe groups of organisms using concepts that ensure 50
that these groups correspond to species (this second step may be coupled with the first, as 51
biological data are continuously accumulated and species hypotheses re-discussed); and third, 52
we need to provide a species description, i.e. a diagnosis and a name for the species 53
recognized as new. 54
Naming new species is a fundamental step when describing biodiversity and is the 55
only way to ensure that scientists are talking about the same entity, and that all the data linked 56
to conspecific specimens but produced by different researchers (or amateurs) can be 57
associated in a comparative analysis (Patterson et al., 2010; Satler et al., 2013; Schlick-Steiner 58
et al., 2007). Not linking biological data (should they be molecular, morphological, or 59
ecological) to a formal species name will result in these data losing tremendous value 60
(Goldstein and DeSalle 2011). Indeed, when authors publish data on entities that are not 61
defined within the framework of a referencing system (e.g. solely identified by an 62
alphanumeric label), they make it very difficult for other authors to build on these data. The 63
best example is the need for taxa to be named to have a chance to be listed in an endangered 64
species list and to benefit from a conservation program: no name, no surviving (Mace 2004). 65
Beyond the need for communication among scientists, names are also key to communicating 66
with non-scientist audiences. 67
While it is now widely recognized that integrating several lines of evidence is the most 68
efficient and theoretically grounded way to delimit new species (e.g. de Queiroz, 2007; 69
Schlick-Steiner et al., 2009; Yeates et al., 2011), the formal naming of new entities may have 70
become decoupled from species delimitation. Indeed, we noted that in several cases new 71
delimited species were not accompanied by formal species description (see also Goldstein and 72
DeSalle 2011). The aim of this article is therefore to test the hypothesis that integrative 73
taxonomy, as defined in 2005 (Dayrat 2005; Will et al. 2005), and in particular the use of 74
molecular data, helped to alleviate the taxonomic impediment by delimiting and describing 75
new species. We reviewed part of the “integrative taxonomy” literature of the last eight years 76
(2006-2013) and tested if authors that delimit new species also name them. We also looked at 77
how the number and type of characters used, across different taxa, varies across articles. 78
79
MATERIALS AND METHODS 80
81
We performed a literature survey using the Web of Science research tool, limited to 82
the scientific articles published between 2006 and 2013, and using the following keywords: 83
“Integrative Taxonom*” in TITLE OR TOPIC OR “Species boundar*” in TITLE OR 84
“Integrative delineation” in TITLE OR “Integrative delimitation” in TITLE OR “Species 85
delineation” in TITLE OR “Species delimitation” in TITLE. This timespan (2006-2013) was 86
chosen because it follows the formal introduction of modern integrative taxonomy. We 87
acknowledge that older articles also include integrative taxonomic approaches (e.g. Hogan et 88
al., 1993, and see Turrill, 1938), but the lower limit for the literature survey would have been 89
chosen arbitrarily. The keywords helped limit the size of our survey while focusing on 90
integrative taxonomy papers, as other keywords (e.g. “new species”) or options (e.g.” species 91
delineation” in TOPIC and not only in TITLE) led to a much higher number of articles 92
(several thousands). 93
From the resulting list of 666 articles, we removed 172 articles that did not fit the 94
context of this review (i.e. methodological and theoretical articles, review studies that did not 95
perform any species delimitation, studies that re-analyzed published data, and studies that 96
focused on supra- or infra-species levels only). For the 494 remaining articles, we extracted 97
data on the number of delimited species, the number of new species delimited, the number of 98
new species described (and, when given, the reason(s) why new species were not described), 99
and the studied taxon. We did not attempt to interpret published results ourselves, but 100
recorded the number of species (delimited, new and described) as reported by the authors of 101
each paper. We also recorded the type of data and methods used to delimit species: molecular 102
data, morphology (including anatomy, cytology…), ecology (including phenology, niche 103
modelling…), cross tests, behavior (e.g. call songs) and other miscellaneous methods (e.g. 104
caryology, chemical data, presence of endosymbionts, etc…). We considered the geographical 105
distribution to be implicitly used in all articles. The resulting table is presented in Online 106
Appendix 1. Contingency tables were analysed using Fisher’s Exact Test, given the relatively 107
small number of observations. 108
We investigated journal editorial policies on including formal taxonomic descriptions 109
into articles. As a proxy for editorial policies, we recorded whether journals that published 110
articles in which new animals species were delimited also published formal descriptions, 111
within three time periods (1864-2004, 2005-2010, 2011-2013), using the “Systematics 112
Controlled Terms” feature in the Zoological Records database (Online Appendix 2). We 113
recorded the impact factor of these journals between 2005 and 2010 to investigate whether 114
there is a link between the inclusion of formal descriptions in papers and impact factor 115
(Online Appendix 2). Indeed, there is a strong incentive for researchers to publish in high-116
impact journals (e.g. Casadevall and Fang, 2014, and see Werner, 2006); if these journals do 117
not welcome descriptions, authors may be tempted to submit their contributions without 118
descriptions to high-impact journals rather than submitting their integrative work, including 119
descriptions, to lower-impact journals. We chose these time periods as a trade-off between the 120
number of articles published within time groups for each journal and the variance of the 121
impact factor (the longer the time period, the larger the variance in impact factor). Also, we 122
noted from personal experience that narrow time periods would be preferred as editorial 123
policies may change relatively rapidly. We used a one-tail Wilcoxon test to evaluate the null 124
hypothesis that journals including formal species descriptions do not have lower impact 125
factors than journals that do not. All statistical tests were performed in R (R Core Team 126 2014). 127 128 RESULTS 129 130
The 494 articles were published in 150 different journals, over half of which 131
published a single article from our list, and 4 of which (Molecular Phylogenetics and 132
Evolution, Zootaxa, PLOS ONE and the Zoological Journal of the Linnean Society) published 133
over 20 articles. The number of articles published each year steadily increased from 2006 (20 134
articles) to 2013 (118 articles) (Fig. 1). Most major lineages of organisms are represented, but 135
the number of articles varies greatly among groups (Fig. 2a). Among hexapods, 136
hymenopterans, lepidopterans, coleopterans and dipterans were the taxon of interest for 19-26 137
articles each (Fig. 2b); among vertebrates, amphibians (43 articles) and lepidosaurians (43) 138
are the most studied taxa, followed by actinopterygians (22), mammals (19), birds (10), 139
chondrichtyans (4), and crocodilians and turtles (1 each) (Fig. 2c). In all taxonomic groups 140
represented by more than five articles, molecular data were analyzed in 100% of the articles, 141
except for embryophytes (71.6%), vertebrates (88.8%), chelicerates (94.7%), hexapods 142
(92.6%) and annelids (90%). One possible explanation for the lower prevalence of molecular 143
data in these taxonomic groups is that morphological characters may generally be more easily 144
formalized, and congruent with molecular data (compared to other groups in which there 145
might be fewer -or more plastic- types of characters available to taxonomists, such as some 146
cnidarians, e.g. McFadden et al., 2010). 147
Almost half (47.2%) of the studies based their species delimitation on two types of 148
characters (DNA and morphology in 89.7% of them), 15.2% three types of characters and 149
only 2.2% four types of characters. More surprisingly, 35.4% of the studies used only one 150
type of character (molecular data for 74.9% of them). This reflects a bias in our survey (the 151
keywords we choose also targeted non-integrative taxonomy), but also an inappropriate use of 152
the “integrative taxonomy” terminology by some authors. Indeed, the “integrative” aspect of 153
the approach is restricted in these articles to the use of different methods and/or criteria of 154
species delimitation, and not to the use of different types of characters. The number of types 155
of characters used varied significantly according to the year of publication when all studies 156
were considered, and non-significantly when only studies with new species delimitations were 157
considered, suggesting a weak tendency toward more integrated species delimitation over the 158
years (Fisher’s Exact Test: p=0.019 and p=0.16, respectively; Table 1). A trend toward using 159
preferentially two types of characters in 2012-2013 was detected among papers describing at 160
least one new species (Fisher’s Exact Test: p=0.0002; Table 1). A concurrent decline in the 161
number of studies using a single type of character was detected, the prevalence of such studies 162
falling from 44.7% between 2006 and 2010 to 29.3% between 2011 and 2013 (Fisher’s Exact 163
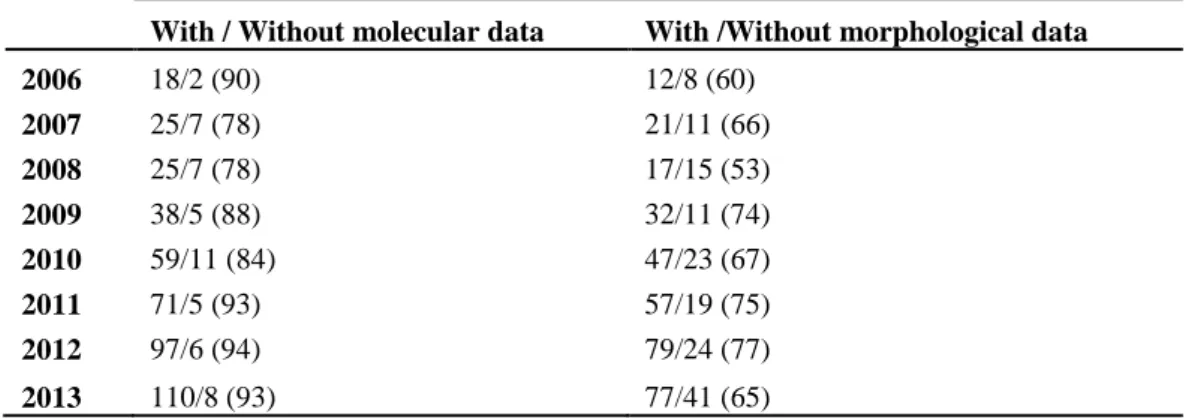
Test: p=0.0005). Finally, the proportion of articles using molecular data and/or morphological 164
data did not vary significantly from 2006 to 2013 (Fisher’s Exact Test: p=0.99; Table 2). 165
We then focused on comparing studies that did not delimit any new species, studies 166
that delimited new species without describing all of them, and studies that delimited new 167
species and described at least one of them. We decided to compare the number of studies in 168
these categories, rather than the number of delimited and described species, because the 169
number of species delimitation and description per study was highly variable. Indeed, among 170
the 139 studies that described at least one species, 135 described fewer than ten species, 3 171
described between 10 and 16 species, and one described 101 species (Riedel et al., 2013). 172
A total of 240 studies did not delimit any new species, but confirmed the current alpha 173
taxonomy or extracted previously described species from synonymy (on the contrary, new 174
species for which names were available in the literature but never considered as a valid, such 175
as forms, varieties or subspecies, were counted as new). In the remaining studies, 1346 new 176
species were delimited (for studies providing a range of putatively new species, we used the 177
lower number reported by the authors), representing 18.7% of the total number of delimited 178
species in the 494 studies (7205). Among the studies that delimited new species, 125 179
delimited but did not describe at least one new species and 139 described at least one new 180
species (in 10 studies some new species were described and others not). The ratio of 181
Described over Undescribed Species (hereon called the “DUS” ratio, more specifically 182
calculated as the number of studies that delimited new species and described at least one new 183
species divided by the number of studies that delimited new species and did not describe at 184
least one new species) was approximately of 1.11 for the whole dataset and did not change 185
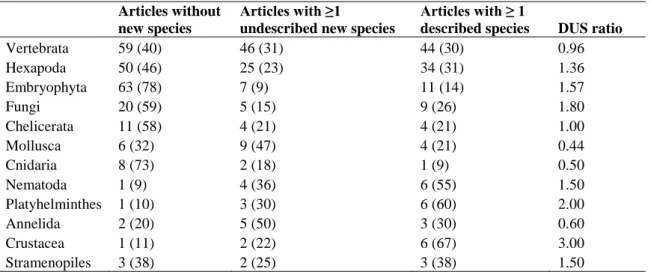
significantly from 2006 to 2013 (Fisher’s Exact Test: p=0.91). The DUS ratio varies non 186
significantly among taxa: when considering only the taxa represented by more than five 187
studies, the ratio varied from 0.44 for molluscs to 4 for platyhelminthes (these differences are 188
largely driven by small sample sizes; Fisher’s Exact Test: p=0.67 Table 3). Finally, the DUS 189
ratio also varies with the number and the type of characters analyzed. The ratio is 0.29 when 190
only one type of character is analyzed, 1.54 with two types of characters and 1.70 with three 191
types of characters (only four studies found new species with four different types of 192
characters; DUS = 1.33). Studies describing new species were more likely to use two types of 193
characters or more, compared to studies that delimited new species without describing all of 194
them (Fisher’s Exact Test: p<0.001), confirming that taxonomists prefer to have multiple 195
sources of information to describe species. The DUS ratio is 1.05 when molecular data (alone 196
or among other types of data) are analysed, 1.87 when morphological data are analysed, and 197
1.22 when other types of characters are analysed, and these differences were statistically 198
significant (Fisher’s Exact Test: p=0.009). 199
Among the 150 journals of our sample, 84 delineated new species. Our Impact Factor 200
analysis, using Zoological Record, focused on 73 zoological journals. Among these journals, 201
90.4% published descriptions from 1864 to 2013, 9.6% never published descriptions within 202
that period, and 16.4% stopped publishing descriptions within that period (either from 2005 203
onward, or from 2011 onward). The average impact factor of journals with species 204
delimitation but without descriptions was significantly higher than that of journals publishing 205
formal descriptions during the 2005-2013 periods (one-tail Wilcoxon: n=50, W = 72, p = 206 0.038). 207 208 DISCUSSION 209 210
As reported previously (Gaston and May 1992), taxonomy studies are strongly biased 211
towards vertebrates (here, they accounted for 29% of the articles we reviewed), even though 212
this taxon accounts for only ~3% of the described diversity on earth (Chapman 2009; Zhang 213
2011) and probably has the highest ratio of described over undescribedspecies. Most of the 214
studies on vertebrates actually focus on groups that still encompass high levels of unknown 215
species, such as amphibians or lepidosaurians. Integrative taxonomy and molecular taxonomy 216
are linked in 90% of the studies, confirming that the formal definition of integrative taxonomy 217
in 2005 is probably linked to the concomitant molecular revolution (as explained in the 218
introduction). In the literature, both have often been associated with an inflation in the number 219
of new species, artificial or not (Isaac et al. 2004; Knapp et al. 2005; Sangster 2009). Our 220
results suggest that this is not always true: 48.7% of studies did not detect new species, and 221
some authors actually proposed to reduce the number of valid species in their taxon of 222
interest. 223
When new species are discovered, however, they are not systematically described (in 224
46.1% of the articles), thus leaving the new species unnamed. In these cases, several 225
justifications for not describing have been put forth by the authors, and we propose a few 226
more. The first reason is the lack of support for the species hypotheses (given in 72.2% of the 227
articles that do provide a justification). In taxa for which the proportion of unknown species is 228
greater than the number of described species, difficulties are linked to the fact that nobody has 229
ever proposed species hypotheses. Exploratory methods are therefore needed, either based on 230
traditional morphological characters or on molecular markers (several DNA-based methods 231
are now available: e.g. (Kekkonen and Hebert, 2014; Pons et al., 2006; Puillandre et al., 2012; 232
Ratnasingham and Hebert, 2013; Zhang et al., 2013). This exploratory step is generally 233
efficient to detect highly divergent lineages that most probably correspond to different 234
species. However, it is more difficult to estimate the number of species in clades with many 235
closely-related species because many might be in “grey zones” (i.e. parts of the tree of life 236
where the speciation process is ongoing and where different types of characters and criteria 237
will not provide the same answer, as defined in de Queiroz, 2007). This situation is 238
encountered in well-studied groups (e.g. some vertebrates and flowering plants), for which 239
what was easy to recognize as species has been described, and challenging species complexes 240
remain to be disentangled (e.g. in orchids, Pessoa et al., 2012). Several multi-locus and 241
coalescent-based methods now exist to help delimit species in the grey zone (reviewed in 242
Camargo and Sites 2013; Carstens et al. 2013; Fujita et al. 2012, and see Leaché et al., 2014). 243
In any case, species are and remain, by definition (de Queiroz 2007; Samadi and Barberousse 244
2006), only hypotheses, and these hypotheses can be more or less supported. In an integrative 245
context, the number of arguments, data and criteria (including the need for additional 246
specimens) needed for defining new species and their hierarchy can vary depending on the 247
taxon considered or the approach applied, and turning species hypotheses into a formally 248
described species remains a taxonomist-dependent decision, sometimes difficult to make. It 249
should also be noted that, even if test cross experiments are generally considered as the most 250
robust criteria of species delimitation (following the conceptual framework established by de 251
Queiroz 2007), it is rarely used (16 studies only), probably because of the difficulty to set up 252
such tests for most non-model organisms. 253
However, in other cases, the species hypothesis is highly supported by numerous lines 254
of evidence, but remains undescribed. Consequently, other reasons should be invoked. For 255
example, it could be the choice of the author to not describe the species in the article where it 256
has been delimitated, but in a forthcoming article (reason given in 24.1% of the studies 257
providing a justification for not describing). This can be motivated by the fact that the authors 258
wish to present additional data that are beyond the scope of the present article (e.g. Pante et 259
al., 2014). It can also be explained by the pressure of publishing more papers, driving many 260
authors to publish in several articles what could be published in one (i.e. submitting their 261
work as “least publishable units”). Then, taxonomists might refrain from describing a species 262
if no morphological differences were found with its sister-species, although there is no reason 263
to think that all “good” species will exhibit morphological differences (Fujita and Leaché 264
2011). Diagnosing a new species using only DNA characters is possible, but not yet 265
widespread (Cook et al. 2010), especially in animals, although molecular data are increasingly 266
included in species descriptions (Goldstein and DeSalle 2011). Actually, a substantial part 267
(35.4%) of the articles we reviewed delimited species with only one type of character. 268
However, even if only one type of character is used, it generally remains associated with the 269
use of different loci, or different methods, or different criteria (phenetic – genetic distances, 270
phylogenetic – reciprocal monophyly, reproductive isolation – independent molecular 271
markers). 272
Another reason for not naming new species is the unwillingness of some scientists 273
(e.g. molecular systematists) to describe species (Satler et al., 2013). A formal description 274
should follow strict nomenclatural rules dictated by the codes of nomenclature, and writing a 275
species description is in itself an exercise that necessitates training that is rarely proposed in 276
modern biological classes (Pearson et al. 2011). Fonseca et al. (2008) and Leliaert et al. 277
(2009) also highlighted the need of sequencing type-specimens to correctly attribute available 278
species names or name new species (Puillandre et al 2011). Furthermore, proposing a new 279
name necessitates, at the very least, a literature review of all the species-level names available 280
(Bertrand et al. 2006; Jansen et al. 2011; Minelli 2003), including names proposed in an old 281
and antiquated literature, sometimes not written in English (Balakrishnan 2005; Godfray 282
2002). Naming new species also necessitates comparison with existing type material, often 283
requiring visits to museums. Non-taxonomists are often frustrated by the over-abundance of 284
redundant species names (i.e. species that have multiple synonymous names) as well as 285
doubtful names (Dayrat, 2005), which makes the assignation of species names to well-286
delineated entities even more difficult. Once again, this exercise requires excellent knowledge 287
of the group, contrary to a genetic approach which is basically the same in mammals and in 288
plants, and can be time consuming (Miller 2007). Other systems have been proposed, some 289
designed to replace the Linnean System (Dayrat et al. 2008; Vences et al. 2013), others only 290
proposing interim systems before full description following the Linnean System 291
(Ratnasingham and Hebert 2013; Schindel and Miller 2010), to, at least partly, solve the 292
difficulties linked to describing new species and to reduce “shelf-time” (Fontaine et al. 2012). 293
However, none of these alternate referencing systems have been as widely accepted and 294
applied as the Linnean system. 295
Finally, publishing species descriptions in high impact factor journals is in general 296
more difficult, because editors may be reluctant to publish species descriptions, especially 297
when they are numerous and long (the number of pages is generally very limited in these 298
journals). In this study, we showed that among the 23 journals that included at least one study 299
in which new species were delimited but not described, 6 of them have never published 300
species descriptions, based on Zoological Records, and 6 did not publish species descriptions 301
after 2004; on average, journals including descriptions had a lower impact factor than the 302
journals that do not. Because of the publication pressure, authors will almost automatically 303
prefer to publish in high impact factor journals, even at the price of removing the species 304
descriptions (Agnarsson and Kuntner, 2007; Costello 2009). Scientists all know the 305
importance in the current system to have articles in journals with high-impact factors, and 306
thus most of them do not spend their time in writing articles that will not be rewarded (Minelli 307 2003). 308 309 CONCLUSION 310 311
The increase in the number of articles recorded between 2006 and 2013, and the large 312
range of journals represented in our review reflects the high dynamism of the taxonomic 313
community. In addition, the increase in the proportion of papers using multiple lines of 314
evidence underlines the success of the modern integrative taxonomy approach, as defined in 315
2005. The positive relationship between the number of different types of characters used for 316
delimitation, which can be seen as a proxy of the degree of integration, and the DUS ratio also 317
supports the idea that integrative taxonomy contributes to a better understanding of 318
biodiversity. However, the 446 species described in the reviewed articles are only a drop in 319
the ocean of new species described in the same period (85,000, if considering a mean of 320
17,000 new species described each year – http://www.esf.edu/species/SOS.htm). 321
Nevertheless, this sample reflects the fact that modern integrative taxonomy as formalized in 322
2005 (thus not considering the pre-2005 articles that delimited and described species using an 323
integrative taxonomy-like approach), is, at least for the moment, not a very efficient solution 324
to the taxonomic impediment. Most new species seem to be described without applying an 325
integrative taxonomy approach, and most new species are still described without the help of 326
molecular data: a screening of 200 articles published in 2013, obtained with the keywords 327
“Taxonomy” in TOPIC AND “sp nov” in SYSTEMATICS in Zoological Records revealed 328
that only 18 of them mentioned the use of molecular data in the abstract. This would suggest 329
that most species are thus still described using morphological characters only. The “molecular 330
revolution” that was announced after the renewal of the taxonomy in the early 2000s, largely 331
associated with the emergence of the integrative taxonomy approach, has apparently not 332
happened yet. We are convinced that integrative taxonomy, when associated with formal 333
species description, is a good way to improve the quality of species hypotheses and associated 334
descriptions, and should therefore be encouraged. However, and contrary to a barcoding 335
approach that can perhaps accelerate the rate of species discovery (but not improve the quality 336
of the species hypotheses nor the rate of species description; e.g.Will et al., 2005), integrative 337
taxonomy did not accelerate the rate of species description between 2006 and 2013. Efforts 338
must be made by authors to seek training or new collaborations to formalize their species 339
delimitation, and to avoid delaying new species descriptions for reasons associated with 340
impact factors. Editors may help the naming of newly delimited species by encouraging the 341
publication of species descriptions. Editorial policies could, for instance, impose that new 342
delimitation be either accompanied by formal descriptions or a strong justification for not 343
describing. Research institutions and funding agencies may encourage the naming of newly 344
delimited species by recognizing taxonomic work as a foundation of biological research, and 345
refrain from putting too much emphasis on impact factors when evaluating scientists. 346
FUNDING 348
349
This work was partly supported by the project CONOTAX, funded by the French “Agence 350
Nationale de la Recherche” (grant number ANR-13-JSV7-0013-01). Salary for E.P. was 351
covered by a grant to the Poitou-Charentes region (Contrat de Projet-État-Région 2007–2013) 352
and by a grant from the Fond Européen de Développement Régional. 353
354
ACKNOWLEDGMENTS 355
356
The authors thank Jean-François Flot, organizer of the Species Delimitation 357
Symposium, and the Society of Systematic Biologists, which funded the participation of NP 358
to the 2013 Evolution meeting. This work beneficiated from the project CONOTAX, funded 359
by the French ANR (ANR-13-JSV7-0013-01). Amélia Viricel, Philippe Bouchet and Sarah 360
Samadi are also thanked for their helpful comments. 361
362
REFERENCES 363
Agnarsson, I., Kuntner, M., 2007. Taxonomy in a changing world: seeking solutions for a 364
science in crisis. Syst. Biol. 56, 531–539. 365
Balakrishnan, R., 2005. Species concepts, species boundaries and species identification: a 366
view from the Tropics. Syst. Biol. 54, 689–693. 367
Barnosky, A.D., Matzke, N., Tomiya, S., Wogan, G.O.U., Swartz, B., Quental, T.B., 368
Marshall, C., McGuire, J.L., Lindsey, E.L., Maguire, K.C., Mersey, B., Ferrer, E.A., 369
2011. Has the Earth’s sixth mass extinction already arrived? Nature 471, 51–57. 370
Bertrand, Y., Pleijel, F., Rouse, G.W., 2006. Taxonomic surrogacy in biodiversity 371
assessments, and the meaning of Linnaean ranks. Syst. Biodivers. 4, 149–159. 372
Camargo, A., Sites, J.J., 2013. Species delimitation: a decade after the renaissance, in: ISBN: 373
978-953-51-0957-0, InTech, D. 10. 5772/5266. (Ed.), The Species Problem - Ongoing 374
Issues, Book Edited by Igor Ya. Pavlinov, ISBN 978-953-51-0957-0, Published: 375
February 6, 2013 under CC BY 3.0 License. Pavlinov, I. Y. 376
Carstens, B.C., Pelletier, T.A., Reid, N.M., Satler, J.D., 2013. How to fail at species 377
delimitation. Mol. Ecol. 22, 4369–4383. 378
Casadevall, A., Fang, F.C., 2014. Causes for the Persistence of Impact Factor Mania. mBio 5, 379
e00064–14. 380
Chapman, A.D., 2009. Numbers of Living Species in Australia and the World, 2nd Edition., 381
Australian Government, Department of the Environment, Water, Heritage, and the Arts. 382
ed. Canberra. 383
Cook, L.G., Edwards, R.D., Crisp, M.D., Hardy, N.B., 2010. Need morphology always be 384
required for new species descriptions? Invertebr. Syst. 24, 322–326. 385
Costello, M.J., 2009. Motivating online publication of data. BioScience 59, 418–427. 386
Costello, M.J., May, R.M., Stork, N.E., 2013a. Can we name Earth’s species before they go 387
extinct? Science 339, 413–416. 388
Costello, M.J., Wilson, S., Houlding, B., 2013b. More taxonomists describing significantly 389
fewer species per unit effort may indicate that most species have been discovered. Syst. 390
Biol. 62, 616–624. 391
Dayrat, B., 2005. Towards integrative taxonomy. Biol. J. Linn. Soc. 85, 407–415. 392
Dayrat, B., Cantino, P.D., Clarke, J.A., de Queiroz, K., 2008. Species names in the 393
PhyloCode: the approach adopted by the international society for phylogenetic 394
nomenclature. Syst. Biol. 57, 507–514. 395
de Queiroz, K., 2007. Species concepts and species delimitation. Syst. Biol. 56, 879–886. 396
Erwin, T.L., 1982. Tropical forests: their richness in Coleoptera and other arthropod species. 397
Coleopt. Bull. 36, 74–75. 398
Evenhuis, N.L., 2007. Helping solve the “other” taxonomic impediment: completing the eight 399
steps to total enlightenment and taxonomic Nirvana. Zootaxa 1407, 3–12. 400
Fonseca, G., Derycke, S., Moens, T., 2008. Integrative taxonomy in two free-living nematode 401
species complexes. Biol. J. Linn. Soc. 94, 737–753. 402
Fontaine, B., Perrard, A., Bouchet, P., 2012. 21 years of shelf life between discovery and 403
description of new species. Curr. Biol. 22, R943–R944. 404
Fujita, M.K., Leaché, A.D., 2011. A coalescent perspective on delimiting and naming species: 405
a reply to Bauer et al. Proc. R. Soc. B 22, 490–492. 406
Fujita, M.K., Leaché, A.D., Burbrink, F.T., McGuire, J.A., Moritz, C., 2012. Coalescent-407
based species delimitation in an integrative taxonomy. Trends Ecol. Evol. 27, 480–488. 408
Gaston, K.J., May, R.M., 1992. Taxonomy of taxonomists. Nature 356, 281–282. 409
Godfray, H.C.J., 2002. Challenges for taxonomy. Nature 417, 17–19. 410
Goldstein, P.Z., DeSalle, R., 2011. Integrating DNA barcode data and taxonomic practice: 411
Determination, discovery, and description. Bioessays 33, 135–147. 412
Hebert, P.D.N., Cywinska, A., Ball, S.L., deWaard, J.R., 2003. Biological identifications 413
through DNA Barcodes. Proc. R. Soc. B 270, 313–321. 414
Hogan, K.M., Hedin, M.C., Koh, H.S., Davis, S.K., Greenbaum, I.F., 1993. Systematic and 415
Taxonomic Implications of Karyotypic, Electrophoretic, and Mitochondrial-DNA 416
Variation in Peromyscus from the Pacific Northwest. J. Mammal. 74, 819–831. 417
Isaac, N.J.B., Mallet, J., Mace, G.M., 2004. Taxonomic inflation: its influence on 418
macroecology and conservation. Trends Ecol. Evol. 19, 464–469. 419
Jansen, M., Bloch, R., Schulze, A., Pfenninger, M., 2011. Integrative inventory of Bolivia’s 420
lowland anurans reveals hidden diversity. Zool. Scr. 40, 567–583. 421
Kekkonen, M., Hebert, P.D.N., 2014. DNA barcode-based delineation of putative species: 422
efficient start for taxonomic workflows. Mol. Ecol. Resour.14, 706-715. 423
Knapp, S., 2008. Taxonomy as a team sport, in: Wheeler, Q.D. (Ed.), The New Taxonomy. 424
pp. 33–53. 425
Knapp, S., Lughadha, E.N., Paton, A., 2005. Taxonomic inflation, species concepts and 426
global species lists. Trends Ecol. Evol. 20, 7–8. 427
Leaché, A.D., Fujita, M.K., Minin, V., Bouckaert, R., 2014. Species delimitation using 428
genome-wide SNP data. Syst. Biol. 63, 534–542. 429
Leakey, R.E., Lewin, R., 1995. The sixth extinction: Patterns of life and the future of 430
humankind, Doubleday. ed. New-York. 431
Leliaert, F., Verbruggen, H., Wysor, B., Clerck, O.D., 2009. DNA taxonomy in 432
morphologically plastic taxa: Algorithmic species delimitation in the Boodlea complex 433
(Chlorophyta: Cladophorales). Mol. Phylogenet. Evol. 53, 122–133. 434
Mace, G.M., 2004. The role of taxonomy in species conservation. Philos. Trans. R. Soc. B 435
359, 711–719. 436
McFadden, C.S., Sanchez, J.A., France, S.C., 2010. Molecular phylogenetic insights into the 437
evolution of Octocorallia: A review. Integr. Comp. Biol. 50, 389–410. 438
Miller, S.E., 2007. DNA barcoding and the renaissance of taxonomy. Proc. Natl. Acad. Sci. 439
104, 4775–4776. 440
Minelli, A., 2003. The status of taxonomic literature. Trends Ecol. Evol. 18, 75–76. 441
Mora, C., Tittensor, D.P., Adl, S., Simpson, A.G.B., Worm, B., 2011. How many species are 442
there on Earth and in the ocean? PLoS Biol. 9, e1001127. 443
Padial, J.M., Miralles, A., De la Riva, I., Vences, M., 2010. The integrative future of 444
taxonomy. Front. Zool. 7, 16. 445
Pante, E., Abdelkrim, J., Viricel, A., Gey, D., France, S., Boisselier, M.C., Samadi, S., 2014. 446
Use of RAD sequencing for delimiting species. Heredity in press. 447
Patterson, D.J., Cooper, J., Kirk, P.M., Pyle, R.L., Remsen, D.P., 2010. Names are key to the 448
big new biology. Trends Ecol. Evol. 25, 686–691. 449
Pearson, D.L., Hamilton, A.L., Erwin, T.L., 2011. Recovery plan for the endangered 450
taxonomy profession. BioScience 61, 58–63. 451
Pessoa, E.M., Alves, M., Alves-Araújo, A., Palma-Silva, C., Pinheiro, F., 2012. Integrating 452
different tools to disentangle species complexes: A case study in Epidendrum 453
(Orchidaceae). Taxon 61, 721–734. 454
Pimm, S., Raven, P., Peterson, A., Sekercioglu, C.H., Ehrlich, P.R., 2006. Human impacts on 455
the rates of recent, present, and future bird extinctions. Proc. Natl. Acad. Sci. 103, 456
10941–10946. 457
Pons, J., Barraclough, T.G., Gomez-Zurita, J., Cardoso, A., Duran, D.P., Hazell, S., Kamoun, 458
S., Sumlin, W.D., Vogler, A.P., 2006. Sequence-based species delimitation for the DNA 459
taxonomy of undescribed insects. Syst. Biol. 55, 595–609. 460
Puillandre, N., Lambert, A., Brouillet, S., Achaz, G., 2012. ABGD, Automatic Barcode Gap 461
Discovery for primary species delimitation. Mol. Ecol. 21, 1864–1877. 462
Puillandre, N., Macpherson, E., Lambourdière, J., Cruaud, C., Boisselier-Dubayle, M.-C. and 463
Samadi, S., 2011. “Barcoding type specimens helps to identify synonyms and an 464
unnamed new species in Eumunida Smith, 1883 (Decapoda : Eumunididae).” Inv. Syst. 465
25, 322–33. 466
R Core Team, 2014. R: A language and environment for statistical computing. R Foundation 467
for Statistical Computing, Vienna, Austria. 468
Ratnasingham, S., Hebert, P.D.N., 2013. A DNA-based registry for all animal species: the 469
Barcode Index Number (BIN) system. PLoS ONE 8, e66213. 470
Riedel, A., Sagata, K., Surbatki, S., Tänzler, R., Balke, M., 2013. One hundred and one new 471
species of Trigonopterus weevils from New Guinea. Zookeys 280, 1–150. 472
Rodman, J.E., Cody, J.H., 2003. The Taxonomic Impediment Overcome: NSF’s Partnerships 473
for Enhancing Expertise in Taxonomy (PEET) as a Model. Syst. Biol. 52, 428–435. 474
Samadi, S., Barberousse, A., 2006. The tree, the network, and the species. Biol. J. Linn. Soc. 475
89, 509–521. 476
Sangster, G., 2009. Increasing numbers of bird species result from taxonomic progress, not 477
taxonomic inflation. Proc. R. Soc. B 276, 3185–3191. 478
Satler, J.D., Carstens, B.C., Hedin, M., 2013. Multilocus species delimitation in a complex of 479
morphologically conserved trapdoor spiders (Mygalomorphae, Antrodiaetidae, 480
Aliatypus). Syst. Biol. 62, 805-823.
481
Schindel, D.E., Miller, S.E., 2010. Provisional nomenclature: the on-ramp to taxonomic 482
names, in: Polaszek, A. (Ed.), Systema Naturae 250 – The Linnaean Ark. London, UK, 483
pp. 109–115. 484
Schlick-Steiner, B.C., Seifert, B., Stauffer, C., Christian, E., Crozier, R.H., Steiner, F.M., 485
2007. Without morphology, cryptic species stay in taxonomic crypsis following 486
discovery. Trends Ecol. Evol. 22, 391–392. 487
Schlick-Steiner, B.C., Steiner, F.M., Seifert, B., Stauffer, C., Christian, E., Crozier, R.H., 488
2009. Integrative taxonomy: a multisource approach to exploring biodiversity. Annu. 489
Rev. Entomol. 55, 421–438. 490
Turrill, W.B., 1938. The expansion of taxonomy with special reference to Spermatophyta. 491
Biol. Rev. 13, 342–373. 492
Vences, M., Guayasamin, J.M., Miralles, A., De La Riva, I., 2013. To name or not to name: 493
Criteria to promote economy of change in Linnaean classification schemes. Zootaxa 494
3636, 201–244. 495
Werner, Y.L., 2006. The case of impact factor versus taxonomy: a proposal. J. Nat. Hist. 40, 496
1285–1286. 497
Will, K.P., Mishler, B.D., Wheeler, Q.D., 2005. The perils of DNA Barcoding and the need 498
for integrative taxonomy. Syst. Biol. 54, 844–851. 499
Yeates, D., Seago, A., Nelson, L., Cameon, S.L., Joseph, L., Trueman, J.W.H., 2011. 500
Integrative taxonomy, or iterative taxonomy? Syst. Entomol. 36, 209–217. 501
Zhang, J., Kapli, R., Pavlidis, P., Stamatakis, A., 2013. A general species delimitation method 502
with applications to phylogenetic placments. Bioinformatics. 29, 2869-2876. 503
Zhang, Z.Q., 2011. Animal biodiversity: an introduction to higher-level classification and 504
taxonomic richness. Zootaxa 3148, 7-12. 505
Online Appendix 1: List of the 494 articles reviewed and data extracted. 507
Online Appendix 2: List of the journals in which new species were delineated. Editorial 508
policies on including formal taxonomic descriptions to articles and impact factors were 509
investigated before 2005, between 2005-2010, and 2011-2014. Y=Yes, N=No, NA=Not 510
Available and IF=Impact Factor. 511
Table 1: Number of studies (% of total, per year) analysing 1, 2, 3 or 4 types of characters for 512 delimiting species. 513 514 All articles Nb of characters 1 2 3 4 Total 2006 9 (45) 10 (50) 1 (5) 0 (0) 20 2007 14 (44) 10 (31) 8 (25) 0 (0) 32 2008 19 (59) 9 (28) 4 (13) 0 (0) 32 2009 15 (35) 20 (47) 6 (14) 2 (5) 43 2010 31 (44) 25 (36) 13 (19) 1 (1) 70 2011 18 (24) 42 (55) 14 (18) 2 (3) 76 2012 28 (27) 53 (51) 17 (17) 5 (5) 103 2013 41 (35) 64 (54) 12 (10) 1 (1) 118
Articles with new species
Nb of characters 1 2 3 4 Total 2006 1 (17) 5 (83) 0 (0) 0 (0) 6 2007 3 (38) 3 (38) 2 (25) 0 (0) 8 2008 4 (40) 3 (30) 3 (30) 0 (0) 10 2009 4 (19) 13 (62) 3 (14) 1 (5) 21 2010 12 (35) 10 (29) 11 (32) 1 (3) 34 2011 8 (22) 20 (54) 8 (22) 1 (3) 37 2012 11 (17) 38 (59) 12 (19) 3 (5) 64 2013 15 (20) 49 (66) 9 (12) 1 (1) 74
Articles with described species
Nb of characters 1 2 3 4 Total 2006 1 (50) 1 (50) 0 (0) 0 (0) 2 2007 1 (33) 1 (33) 1 (33) 0 (0) 3 2008 0 (0) 3 (60) 2 (40) 0 (0) 5 2009 2 (17) 6 (50) 3 (25) 1 (8) 12 2010 7 (35) 4 (20) 8 (40) 1 (5) 20 2011 1 (5) 13 (65) 6 (30) 0 (0) 20 2012 0 (0) 29 (76) 7 (18) 2 (5) 38 2013 1 (3) 31 (79) 7 (18) 0 (0) 39
Table 2: Number of studies (% of total, per year) that included molecular data or 515
morphological data for each year (2006-2013). 516
517
With / Without molecular data With /Without morphological data
2006 18/2 (90) 12/8 (60) 2007 25/7 (78) 21/11 (66) 2008 25/7 (78) 17/15 (53) 2009 38/5 (88) 32/11 (74) 2010 59/11 (84) 47/23 (67) 2011 71/5 (93) 57/19 (75) 2012 97/6 (94) 79/24 (77) 2013 110/8 (93) 77/41 (65)
Table 3: Number of studies (% of total, per taxon) without new species, with at least one 518
delimited but undescribed new species, and with at least one described species in each taxon 519
considered. The DUS ratio corresponds to the ratio of columns 3 and 2. 520 521 Articles without new species Articles with ≥1
undescribed new species
Articles with ≥ 1
described species DUS ratio
Vertebrata 59 (40) 46 (31) 44 (30) 0.96 Hexapoda 50 (46) 25 (23) 34 (31) 1.36 Embryophyta 63 (78) 7 (9) 11 (14) 1.57 Fungi 20 (59) 5 (15) 9 (26) 1.80 Chelicerata 11 (58) 4 (21) 4 (21) 1.00 Mollusca 6 (32) 9 (47) 4 (21) 0.44 Cnidaria 8 (73) 2 (18) 1 (9) 0.50 Nematoda 1 (9) 4 (36) 6 (55) 1.50 Platyhelminthes 1 (10) 3 (30) 6 (60) 2.00 Annelida 2 (20) 5 (50) 3 (30) 0.60 Crustacea 1 (11) 2 (22) 6 (67) 3.00 Stramenopiles 3 (38) 2 (25) 3 (38) 1.50
Figure captions:
522 523
Figure 1: Number articles (2006-2013) that did not delimit new species (dark grey), delimited 524
new species without formally describing them (medium grey), and described newly-delimited 525
species (light grey). 526
527
Figure 2: Number of articles per taxa (a), with emphasis on hexapods (b) and vertebrates (c). 528
“Other taxa:” taxa for which fewer than five articles were analysed. 529