Controlling Morphology of Multi-Component Block Copolymer
Based Materials
by
Rafal Adam Mickiewicz
B.A.Sc., Engineering Science
University of Toronto (1998)
S.M., Materials Science and Engineering
Massachusetts Institute of Technology (2001)
SUBMITTED TO THE DEPARTMENT OF MATERIALS SCIENCE AND ENGINEERING IN PARTIAL FULFILLMENT OF THE REQUIREMENTS FOR THE
DEGREE OF
DOCTOR OF PHILOSOPHY IN POLYMERS AT THE
MASSACHUSETTS INSTITUTE OF TECHNOLOGY FEBRUARY 2009
©2009 Massachusetts Institute of Technology All rights reserved
Signature of Author: ______________________________________________________ Department of Materials Science and Engineering
January 16th, 2009 Certified by: _____________________________________________________________
Edwin L. Thomas Morris Cohen Professor of Materials Science and Engineering Thesis Supervisor Accepted by: ____________________________________________________________
Christine Ortiz Associate Professor of Materials Science and Engineering
Controlling Morphology of Multi-Component
Block Copolymer Based Materials
by
Rafal Adam Mickiewicz
Submitted to the Department of Materials Science and Engineering on 16 January 2009 in partial fulfillment of the requirements for the degree of
Doctor of Philosophy in Polymers
Abstract
The ability of block copolymers to self-assemble into ordered microstructures has attracted much interest both from a pure scientific perspective and for their potential in numerous industrial applications. The microphase separation of block copolymers has been successfully exploited in a wide range of applications, such as templating and lithography, enhancement of mechanical properties, and nanoreactor schemes.
This thesis focuses on the characterization of the morphology in composite systems where one or more of the components is a block copolymer. In the first part of this thesis, binary blends of very high molecular weight diblock copolymers with a low molecular weight triblock copolymer are investigated. The high molecular weight diblock copolymers are very strongly segregating, with interaction parameter values, χN, in the range 470 – 1410. The phase diagram revealed a large miscibility gap for the blends, with macrophase separation into two distinct types of microphase separated domains and implied virtually no solubility of the much higher molecular weight diblocks in the triblock. For certain blend compositions, morphological transitions from the lamellar to cylindrical and bicontinuous structures were also observed, even though the overall composition in the blend would be expected to favor the lamellar microstructure. This was found to result from the compositional asymmetry of the triblock copolymer influencing the curvature of the inter-material dividing surface (IMDS). Finally, a strong segregation theory model was used to interpret the observed results.
In the second part of this thesis the microstructure formation in nanocomposites based on a liquid crystalline side chain block copolymer (LCBCP) and gold nanoparticles was investigated. The location of the nanoparticles was found to not only depend on the surface chemistry of the gold nanoparticles, but also on the self-organization within the liquid crystalline domain of the LCBCP. The nanoparticles were excluded from the liquid crystalline domains due to the high free energy penalty of disrupting the smectic layering. The final location of the nanoparticles within the composite was determined by the nature of the stabilizing surface coating.
The work presented in this thesis revealed a number of interesting tools which are useful for obtaining a wide range of morphologies in multi-component block copolymer systems.
Table of Contents
Table of Contents ... 3 Table of Figures... 5 Table of Tables ... 12 Acknowledgements ... 14 Chapter 1 Introduction... 15 1.1 Scope of Work ... 15 1.2 Block Copolymers ... 161.3 Binary Blends of Block Copolymers ... 17
1.4 Nanocomposites ... 20
1.5 Block Copolymer Nanocomposites ... 23
1.5.1 Theoretical Work ... 23
1.5.2 Experimental Work... 26
1.6 References... 32
Chapter 2 Materials and Experimental Methods ... 38
2.1 Polymers ... 38
2.1.1 Styrene-Isoprene Block Copolymers ... 38
2.1.2 Liquid Crystalline Side Chain Block Copolymer ... 40
2.2 Block Copolymer Blends Preparation ... 42
2.3 Nanoparticle Synthesis... 42
2.4 Liquid Crystalline Side Chain Block Copolymer Composites ... 43
2.5 Transmission Electron Microscopy ... 44
2.6 Ultra-Small-Angle X-ray Scattering (USAXS) ... 44
2.7 References... 45
Chapter 3 Binary Blends of Diblock Copolymers with a Triblock Copolymer .. 46
3.1 Results and Discussion ... 47
3.2 Conclusion ... 66
3.3 References... 68
Chapter 4 Influence of Short Block Copolymers on the Morphology of Binary Block Copolymer Blends: A Modeling Study... 70
4.1 Results and Discussion ... 70
4.2 Conclusion ... 81
Chapter 5 Liquid Crystalline Side Chain Block Copolymer Nanocomposites.... 85
5.1 Results and Discussion ... 87
5.2 Conclusion ... 106
5.3 References... 107
Chapter 6 Directions for Future Study ... 109
6.1 Block Copolymer Blends in Confined Geometry... 110
6.2 Block Copolymer Gel and Nanoparticle Composites ... 116
6.2.1 Block Copolymer Gel and TMV Composites... 117
6.2.2 Block Copolymer Gel and Gold Nanoparticle Composites... 123
6.3 Conclusion ... 127
6.4 References... 129
Chapter 7 Appendix... 133
7.1 Group Contribution Calculation ... 133
7.2 BZL Strong Segregation Theory Model ... 134
7.3 Self Consistent Field Theory ... 137
7.4 List of Abbreviations ... 138
Table of Figures
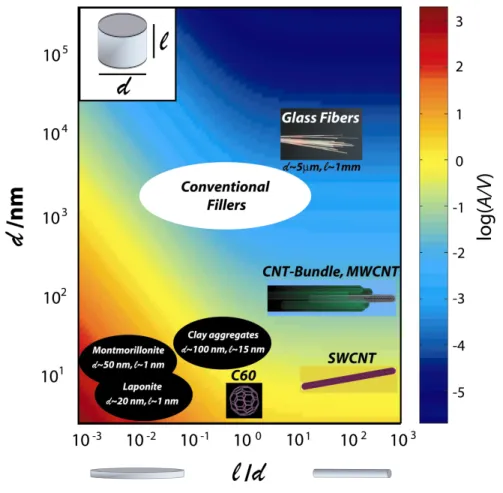
Figure 1.1. Schematic of diblock copolymer morphology. The numbers percentages indicate the volume fraction of the component shown in dark in the figure. The morphologies are symmetric beyond 50% volume percent, with the dark domains becoming the light domains. ... 17 Figure 1.2. Schematic showing how a block copolymer acts to stabilize an immiscible blend of two homopolymers. The size of the blue micelles is on the order of 1 µm... 18 Figure 1.3. Calculated interfacial area per volume of particles (in nm-1) assuming a right circular cylindrical particle shape for different particle diameter d and aspect ratio l/d. Exfoliated clay (laponite or montmorillonite) particles, spherical nanoparticles, and single wall carbon nanotubes generate up to four orders of magnitude more interfacial area as compared to conventional filler materials, like glass fibers, of equal volume filling fraction. Reproduced from reference 44. ... 23 Figure 1.4. Schematic of important parameters for BCP/nanoparticle composites. The core size, dcore, is the diameter of the rigid particle. The corona is the shell occupied by
the stabilizing surface ligands, and its thickness is tcorona. The effective size of the
nanoparticle is then dcore+2tcorona. The IMDS, or inter-material dividing surface, is the
interface between the A and B type domains. The characteristic domain spacing is given by L=lA+lB, where lA and lB are the size of the A and B domains, respectively. ... 24
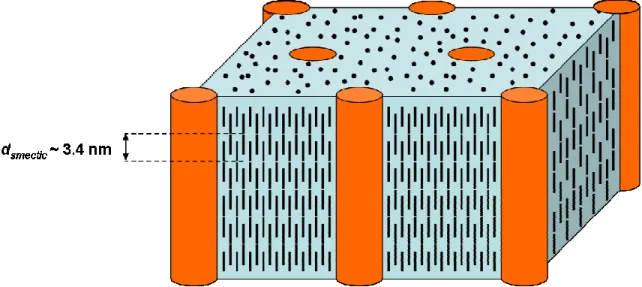
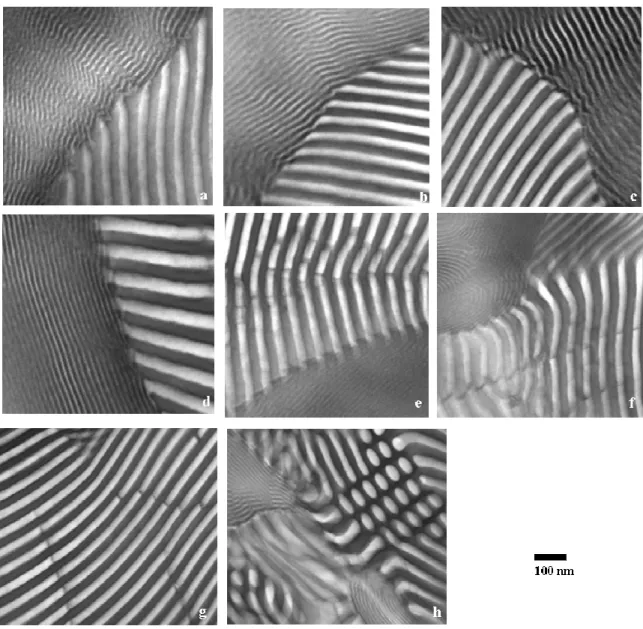
Figure 2.1. Chemical structure of the poly(styrene-b-isoprene) diblock copolymer. ... 39 Figure 2.2. Chemical structure of the PS-PVMS block copolymer and liquid crystalline mesogen. The polymer used is 100% functionalized, giving z = 0. Although there is a small amount of dimethyl siloxane present, x << y, and the polymer is essentially a diblock copolymer.5... 41 Figure 2.3. Schematic representation of the LCBCP morphology in an aligned and oriented fiber. The LC mesogen aligns into interdigitated smectic layers, with the layer normal parallel to the PS cylinder axis, and a d-spacing of 3.4 nm as determined by SAXS.4, 5... 41 Figure 3.1. Bright field TEM micrographs of thin OsO4 stained sections of the neat
diblock copolymers, showing all with lamellar morphologies: a) SI450, b) SI700, c) SI1000, d) SI1500. ... 48 Figure 3.2. Bright field TEM micrographs of thin OsO4 stained sections of blends of
SI450 with SIS, with compositions in weight percent (SI450/SIS): a) 5/95, b) 10/90, c) 25/75, d) 50/50, e) 75/25, f) 90/10, g) 95/5, h) the exceptional SI700 5/95 blend exhibits some cylindrical domains in the minority SI700 phase in addition to thick and thin lamellar regions. Note that the micrographs were taken from areas containing both the
phases, and are not representative of the actual volume percent of each type of domain, which varies strongly with blend composition. ... 49 Figure 3.3. Bright field TEM micrographs of thin OsO4 stained sections of blends of
SI1000 with SIS, with compositions in weight percent (SI1000/SIS): a) 5/95, b) 10/90, c) 25/75, d) 50/50, e) 75/25, f) 90/10, g) 95/5. The 10/90 and 50/50 blends exhibit a disordered morphology with IMDS curvature towards the PS domains, whereas the 25/75 and 75/25 blends reveal a PS cylindrical morphology. According to the scattering data, the 10/90 blend appears to be disordered cylinders, whereas the 50/50 blend could be double gyroid, but it is not entirely clear. Nonetheless, micrographs for the latter blend suggest a bicontinuous morphology... 50 Figure 3.4. Bright field TEM micrographs of thin OsO4 stained sections of blends of SI1500 with SIS, with compositions in weight percent (SI1500/SIS): a) 5/95, b) 10/90, c) 25/75, d) 50/50, e) 75/25, f) 90/10, g) 95/5. The 5/95, 10/90, and 25/75 blends exhibit a disordered morphology, which once again appears from the scattering data to be cylinders. The 75/25 blend appears to exhibit a poorly ordered double-gyroid structure, and a detail of the structure, showing characteristic serpentine features, is shown in the inset of (e). Note that while the effective volume fraction of the blends remains in the lamellar region of the phase diagram (0.41<ΦeffPS <0.44), the IMDS is non-flat, with
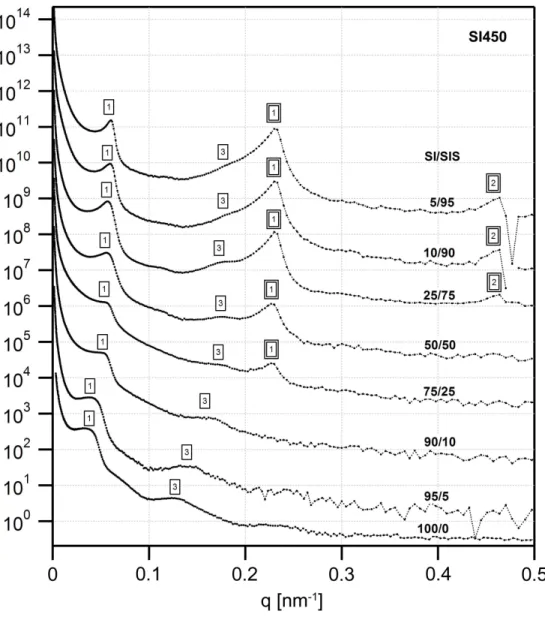
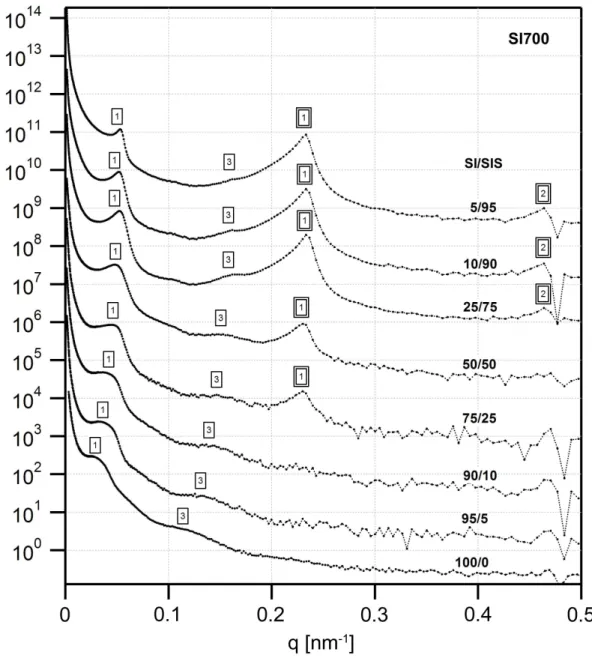
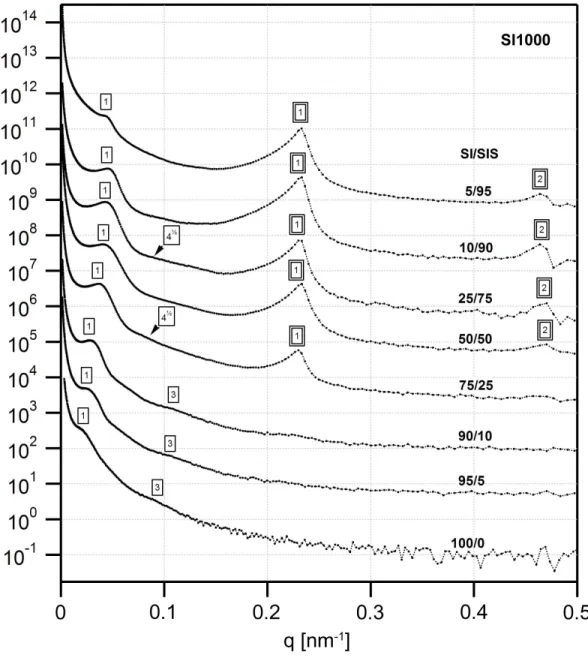
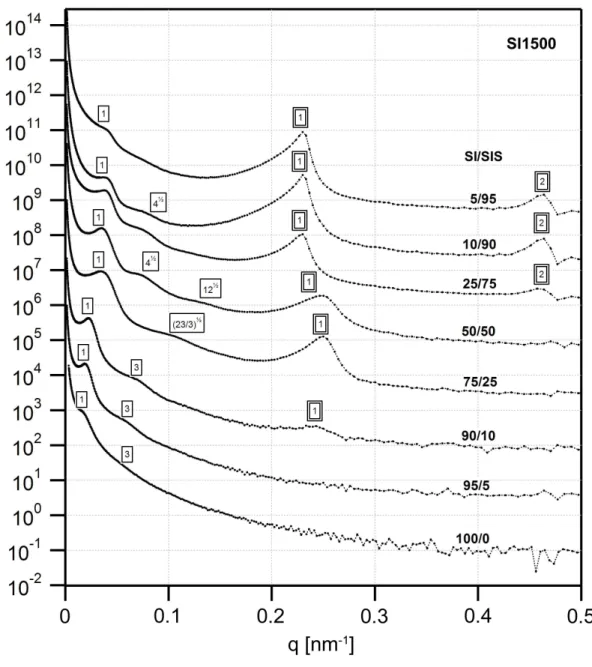
curvature towards the PS domains... 51 Figure 3.5. USAXS profiles for the SI450 series of blends. The lamellar reflections from the two different phases are clearly evident, with the intensities of the SIS triblock reflections increasing with the weight fraction of the triblock in the blend. A single box outline indicates reflections from the diblock domains and a double box those of the triblock domains... 53 Figure 3.6. USAXS profiles for the SI700 series of blends, which are qualitatively similar to those of the SI450 blends. A single box outline indicates reflections from the diblock domains and a double box those of the triblock domains... 54 Figure 3.7. USAXS profiles for the SI1000 series of blends. The higher order peaks of the large diblock are weak or absent, indicating poor long range order. A single box outline indicates reflections from the diblock domains and a double box those of the triblock domains. ... 55 Figure 3.8. USAXS profiles for the SI1500 series of blends. The change in the scattering profile going from 25% SIS to 50% SIS is clearly evident, indicating a change in the morphology from double gyroid-like to cylinders. A single box outline indicates reflections from the diblock domains and a double box those of the triblock domains. .. 56 Figure 3.9. Domain spacing (d=2π q1) as a function of the triblock content for the (a)
SI450 and SI700 blend series, and (b) for the SI1000 and SI1500 blend series, obtained by tracking the position of the first order reflection in the USAXS data. The domain spacing decreases with increased triblock content and levels off after around 25% by
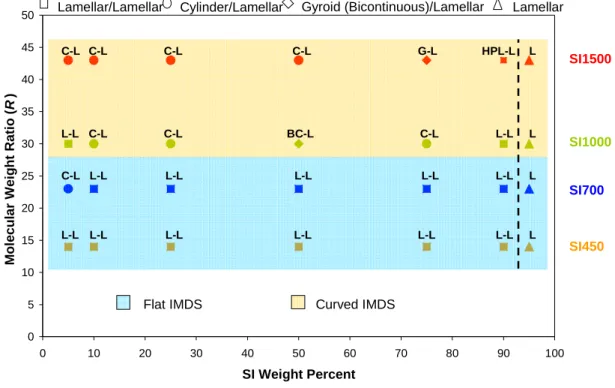
order scattering peak, and reflects the higher uncertainty at larger spacing (lower q), due to the inverse relation between d and q. For the SI1000 and SI1500 blends with cylindrical morphology, the cylinder radius is directly proportional to the domain spacing, d, by the relation RCYL =d 2 f 3π , where f is the 2-D area (“volume”) fraction, based on hexagonal packing. ... 57 Figure 3.10. Morphological phase diagram of the binary blends in the parameter space of molecular weight ratio, triblock
n diblock n M M R 2 1
= , and blend composition, in weight percent SI (to facilitate comparison with previous studies). The data points for each blend series are depicted in a unique color. The blue shaded area represents the region where the blends exhibit lamellar (flat IMDS) morphologies (with one exception at 5% of the SI700 blend). In the yellow shaded area, morphological phase transitions are observed, from lamellar arrangement to structures with IMDS curvature – cylinders and double gyroid-like, identified by different data point shapes on the graph. The dotted line indicates where the blends macrophase separate: to the right of the line, the blends are miscible and exhibit a single microphase separated morphology, whereas to the left the blends are macrophase separated, with two coexisting microphase separated morphologies. ... 58 Figure 3.11. Low magnification wide area TEM image of the SI1500 75/25 blend showing large areas of a distorted gyroid-like structure. ... 61 Figure 3.12. Schematic representation of chain packing of diblock copolymers with an asymmetric composition. The schematic illustrates the spontaneous curvature implied by the underlying asymmetry. In the neat block copolymer, this curvature is not expressed, while the addition of a larger block copolymer of appropriate size (to fill the extra volume) is capable of stabilizing the curved IMDS morphology. ... 63 Figure 4.1. Schematic representation of a binary mixture of two block copolymers of different lengths for (a) lamellar morphology, and (b) cylinder morphology. It is important to note that one triblock copolymer chain has been modeled as two diblock copolymer chains of half the degree of polymerization of the triblock. For the cylinder morphology (b), the radius of the cylinder is given by rcyl = HAs + HAl. ... 71
Figure 4.2. Reduced free energy plots for the diblock/triblock (SI/SIS) blends investigated in Chapter 3: (a) SI450 blends, and (b) SI700 blends. The two lines, blue and red, correspond to the free energy of the lamellar morphology and cylinder morphology, respectively. ... 75 Figure 4.3. Reduced free energy plots for the diblock/triblock (SI/SIS) blends investigated in Chapter 3: (a) SI1000 blends, and (b) SI1500 blends. The two lines, blue and red, correspond to the free energy of the lamellar morphology and cylinder morphology, respectively... 76 Figure 4.4. Free energy difference between cylinder and lamellar morphology. ... 77 Figure 5.1. Schematic demonstrating the hypothesis of using a liquid crystal phase
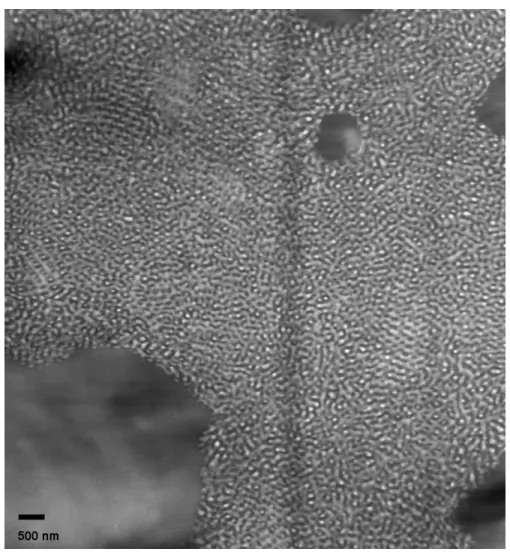
Figure 5.2. Bright field TEM micrograph of the neat, as cast LCBCP showing a poorly hexagonally packed, worm-like cylindrical morphology of PS cylinders (light domains) in a PVMS matrix (dark domains). The image is unstained, with the contrast arising from the more electron dense siloxane groups in the PVMS. ... 87 Figure 5.3. Chemical structures of the stabilizing ligands used to synthesize the gold nanoparticles. ... 88 Figure 5.4. ButSH stabilized gold nanoparticles: TEM micrograph and size distribution histogram... 88 Figure 5.5. HexSH stabilized gold nanoparticles: TEM micrograph and size distribution histogram... 88 Figure 5.6. DodSH stabilized gold nanoparticles: TEM micrograph and size distribution histogram... 89 Figure 5.7. MPS stabilized gold nanoparticles: TEM micrograph and size distribution histogram... 89 Figure 5.8. Bright field TEM micrographs of LCBCP composites as cast from toluene with 15% wt MPS-functionalized gold nanoparticles. The nanoparticles have aggregated, creating a poorly dispersed composite. The two images are of the same sample at different magnifications. ... 91 Figure 5.9. Bright field TEM micrographs of annealed and slow cooled LCBCP composites cast from toluene with 15% wt DodSH-functionalized gold nanoparticles. The nanoparticles are again aggregated, creating a poorly dispersed composite. The two images are of the same sample at different magnifications. ... 92 Figure 5.10. Bright field TEM micrographs of LCBCP composites as cast from chloroform with 5% wt HexSH-functionalized gold nanoparticles. The nanoparticles are mainly aggregated, but the higher magnification image on the right appears to show that the nanoparticles tend to reside near the interfaces of the two domains. The two images are of the same sample at different magnifications. ... 93 Figure 5.11. Bright field TEM micrographs of annealed and quenched LCBCP composites with 5% wt ButSH-functionalized gold nanoparticles. In these films, the nanoparticles are found to be well dispersed in the PS domain: (a) cast from toluene, (b) cast from THF. ... 94 Figure 5.12. Bright field TEM micrographs of the LCBCP composites containing 5% wt gold nanoparticles initially cast from toluene: (a) as cast film, (b) annealed and quenched film, (c) annealed and slow cooled film. All films show the nanoparticles preferentially sequestered in the PS (light) domains. The two annealed films, (b) and (c), appear to show coarsening of the gold nanoparticles. ... 95
Figure 5.13. Nanoparticle size distribution comparison for LCBCP nanocomposites originally cast from THF and containing 5% ButSH functionalized gold nanoparticles: (a) comparison of the as cast composite with the annealed and quenched composite, (b) comparison of the as cast composite with the annealed and slow cooled composite. The nanoparticle size distributions were determined from TEM micrographs using the ImageJ image analysis software with a grayscale threshold level of 100-125. As mentioned in the text, nanoparticles with diameters less than 2 nm could not be resolved in the TEM images, and as a result the histogram is truncated at this level. Even so, “false particles” are evidently counted even in the 2.5 nm bin. Nevertheless, an increase in particle size is clear from the histogram, and reflected in the calculated average nanoparticle diameter (Table 5.2)... 96 Figure 5.14. Schematic showing the chemical architecture of the PS-PVMS LCBCP, indicating that the PVMS polymer backbone is "screened" by the LC side chains. The ligands on the nanoparticles interact with the alkane terminus of the LC side chain. ... 97 Figure 5.15. Bright field TEM micrograph of a SI450 composite as cast from toluene with 5% wt ButSH-stabilized gold nanoparticles. The nanoparticles are seen to be preferentially dispersed in the PI domains (dark) in this OsO4-stained image. The light PS
domains are free of nanoparticles. ... 99 Figure 5.16. Solubility parameter values for the LCBCP and solvents used in composite preparation. ... 101 Figure 5.17. Bright field TEM micrographs of LCBCP composites as cast with 5% wt ButSH-functionalized gold nanoparticles. In these films, the nanoparticles are again found to be well dispersed in the PS (light) domains: (a) cast from chloroform, (b) cast from dichloromethane. ... 102 Figure 5.18. Schematic showing the disruption of the LC side chain smectic layering as a result of introducing a nanoparticle of comparable size into the ordered domains. ... 103 Figure 6.1. Density distribution plots for the SI450 blends simulation – dbk refers to the density of the diblock and tbk refers to the density of the triblock. “A” refers to the density distribution of the A block of the block copolymer, which in these simulations corresponds to the PS domains. ... 112 Figure 6.2. Density distribution plots for the SI700 blend simulation – dbk refers to the density of the diblock and tbk refers to the density of the triblock. “A” refers to the density distribution of the A block of the block copolymer, which in these simulations corresponds to the PS domains. ... 112 Figure 6.3. Density distribution plots for the SI1000 blends simulation – dbk refers to the density of the diblock and tbk refers to the density of the triblock. “A” refers to the density distribution of the A block of the block copolymer, which in these simulations corresponds to the PS domains. ... 113
Figure 6.4. Density distribution plots for the SI1500 blend simulation – dbk refers to the density of the diblock and tbk refers to the density of the triblock. “A” refers to the density distribution of the A block of the block copolymer, which in these simulations corresponds to the PS domains. ... 113 Figure 6.5. Density distribution plot with line profiles for the SI450 blends simulation. The image at top displays the density distribution profile of the diblock and the lines indicate the profile locations. The line profiles indicate that the triblock preferentially segregates to the IMDS and that the large “pool” of triblock is not microphase separated. ... 114 Figure 6.6. Tobacco mosaic virus: (a) TEM micrograph of a single virus particle, reproduced from reference 32, (b) schematic of TMV structure reproduced from reference 31... 117 Figure 6.7. Liquid crystalline arrangement of TMV on a carbon coated grid. The TMV was cast onto the grid from a 10% wt aqueous suspension and allowed to dry. The image is unstained... 118 Figure 6.8. TMV decorated with nickel nanoparticles. The nanoparticles were deposited on the surface of the TMV using a simple reduction reaction of a nickel salt described in reference 36... 119 Figure 6.9. Chemical structure of PS-P2VP block copolymer. ... 120 Figure 6.10. Quaternization of the P2VP block using bromoethane vapor. ... 120 Figure 6.11. TEM micrograph of TMV particles in a dried PS-P2VP block copolymer. The TMV particles are preferentially localized in the P2VP domains, which appear slightly darker due to staining with iodine vapor... 121 Figure 6.12. Modes of infiltration of TMV into swollen P2VP domains. In (a) the TMV axis is oriented perpendicular to the film edge, allowing the virus to penetrate the “forest” of P2VP chains. In (b) the TMV axis is oriented parallel to the film edge, and the virus would be “caught” by the chains thus not allowing for its penetration into the film. .... 121 Figure 6.13. Schematic of a suggested implementation of a “tunable plasmonic gel”. Gold nanoparticles are preferentially localized in the swellable domain of a block copolymer gel. The swelling of the domain leads to a change in the average spacing between nanoparticles and possibly a shift in the plasmon resonance... 123 Figure 6.14. Characteristics of P2VP-stabilized gold nanoparticles: (a) UV-Vis absorbance spectrum in THF, (b) TEM micrograph... 124 Figure 6.15. UV-Vis absorbance spectrum of the PS-P2VP block copolymer gel with 15% wt gold nanoparticles... 126
Figure 6.16. TEM micrograph of a PS-P2VP block copolymer containing 15% wt gold nanoparticles. The slightly darker regions are P2VP domains preferentially stained with iodine vapor. The nanoparticles are found to localize at the interface between the PS and P2VP domains... 126 Figure 7.1. Schematic showing the organization of polymer chains in a cylindrical domain of a binary blend of diblock copolymers. ... 136
Table of Tables
Table 2.1. Molecular characteristics of the block copolymers: The molecular weights are in [g/mol]. a MO in toluene at 35οC. b Calculations are based on the equation:
n w M
M
PDI= . c SEC in THF at 35οC. d 1H-NMR in CDCl3. The volume fraction is
calculated based on the 1H-NMR values using the equation:
(
wt PS PI)
[
wt PS PI(
wt PS)
PS]
PS
vol%( )= %( )ρ %( )ρ + 100− %( ) ρ (
ρ
PS = 1.06 g/ml,
ρ
PI = 0.911 g/ml). eThe total molecular weights for the samples SI1000 and SI1500 were calculated in combination with SEC/MO (calculating PS) and 1H-NMR (calculating volume fraction of PS). f The segregation strength was computed based on the equation χ = 33/T - 0.0228 from reference 3. g Only the molecular weight profile of the purchased triblock was detemined using SEC. The volume fraction of PS is based on the manufacturer’s reported weight fraction and the PDI is that for the entire triblock copolymer. h R is the molecular weight ratio for each series of blends containing the respective high molecular weight diblock, i.e. triblock
n diblock n M M R 2 1 = . ... 40 Table 2.2. Molecular characteristics of the LCBCP. wPS is the weight fraction of
poly(styrene) in the block copolymer and Tiso is the smectic-to-isotropic transition
temperature of the LC side chains in the PVMS domain. a The PDI of the LCBCP was not measured using SEC. The PDI listed is that of the underlying PS-b-PVMS diblock copolymer, prior to functionalization with the LC mesogen. The molecular weight and composition, however reflect the entire LCBCP polymer, assuming complete functionalization of the side chains with the LC mesogen. ... 42 Table 4.1. Polymer characteristics used in the model calculations... 73 Table 4.2. Composition ranges for the stability of the cylinder morphology in the blends.
nCYL is the number fraction of the large diblock in the blends (nCYL =2n(1+n)), and wCYL is
the corresponding weight fraction, based on the molecular parameters of the experimental diblock/triblock blends... 77 Table 5.1. Size characteristics of the nanoparticles. a dcore is the average value of more
than 200 measured nanoparticles and the error is the standard deviation. b tcorona is the
value reported for the ligand length drawn in the Chem3D Pro software from CambridgeSoft. c deffective = dcore + 2tcorona. ... 89
Table 5.2. Average nanoparticle diameter comparison between the three differently processed LCBCP nanocomposites originally cast from THF with 5% ButSH stabilized gold nanoparticles. The p value was determined from a student t test on the distributions. ... 97 Table 6.1. Modeling parameters used in the SCFT simulation, describing the characteristics of the polymers. The values were chosen to be comparable to the molecular characteristics of the polymers used in the blend experiments described in
Table 6.2. Molecular characteristics of the block polymer used to make the PS-P2VP/TMV composites. ... 120 Table 6.3. Molecular characteristics of the polymer used to make the P2VP/Au nanoparticle composites... 124
Acknowledgements
First and foremost, I wish to thank my thesis advisor, Professor Edwin L. Thomas, for his committed and constant support throughout my time at MIT, and teaching me that good research is rarely easy but ultimately rewarding. His dedication, enthusiasm, and insistence on pursuing pioneering and novel research directions will be a continuing source of inspiration.
I am grateful to my thesis committee, Professor Alfredo Alexander-Katz, Professor Caroline Ross, and Professor Francesco Stellacci, for their guidance and advice on improving the thesis work presented here.
I am also thankful for all my fellow labmates: Joe Walish, Nick Tsui, Taras Gorishnyy, Chaitanya Ullal, Martin Maldovan, Jongseung Yoon, Ji-Hyun Jang, Taeyi Choi, Neal Vachani, Rachel Pytel, Henry Koh, Vahik Krikorian, Brian Pate, Naan Wanakomol, Wonmok Lee, and Youngjong Kang. They have been a pleasure to work with over the years, always ready to help or offer advice, and a great bunch of people to relax with outside of work.
I am deeply indebted to my family for their unfailing love and support, which was a tremendous source of strength through the highs and lows of my doctoral journey. To my parents for always believing that it was achievable and motivating me to constantly try harder and do better. To Lulu for her love, encouragement, patience, and desire to see me succeed. This work would not have been possible without them.
A heartfelt “thank-you” to all my friends whose companionship defined my life outside of the lab. They have enriched my MIT experience beyond measure and have continuously been a source of energy for me to renew and refresh my spirit.
This work made extensive use of the various research facilities at MIT, in particular, the Center for Materials Science and Engineering Electron Microscopy Shared Experimental Facility and the Institute for Soldier Nanotechnologies. Special thanks to Dr. Jan Ilavsky of the Advanced Photon Source at Argonne National Laboratory for his invaluable assistance with the USAXS measurements.
Financial support for this work was provided by grants from the Air Force Office of Scientific Research (AFOSR) and the National Science Foundation (NSF).
Chapter 1
Introduction
1.1
Scope of Work
The main thrust of this thesis is to investigate the morphology and microstructure formation in multi-component systems containing block copolymers. The aim is to determine the key parameters that influence the morphology in order to be able to design functional materials with precisely selected properties. This thesis is divided into six chapters. The current chapter introduces the reader to the concepts and materials that will be used in the experimental work described in this thesis. It also provides a survey of the relevant literature that serves as a backdrop to the work reported here. Chapter 2 details the materials and experimental methods used during the course of the studies. Chapter 3 reports on the morphological behavior of binary blends of block copolymers. The systems are comprised of a series of four high molecular weight diblock copolymers blended with a low molecular weight triblock copolymer. In Chapter 4 a theoretical model based on the strong segregation limit in block copolymers is used to analyze the results obtained in Chapter 3, in order to more clearly understand the observed morphologies. Chapter 5 is focused on the microstructure formation in composites of a liquid crystalline side chain block copolymer with gold nanoparticles. The main interest is in exploring the effects that the ordering of the liquid crystalline domains has on the morphological behavior of the nanocomposite. Chapter 6 details a number of suggestions for future work that build upon the lessons learned from the work described in this thesis.
1.2
Block Copolymers
The simplest block polymers are linear diblock copolymers comprised of two distinct polymer chains (e.g. A and B) covalently connected at their endpoints to form one chain. Since block polymers are single-component systems, they cannot macrophase separate in the melt like a pair of linear homopolymers. Nevertheless, most diblock copolymers are comprised of incompatible polymer species and as a result, the simplest AB diblock copolymers segregate on a local scale to form periodic lamellar, cylindrical, cubic spherical or interconnected network morphologies.1, 2 This microphase separation arises from the need to balance the two competing requirements of (1) minimizing the interfacial free energy while at the same time (2) lowering the entropic penalty of stretching the polymer chains. The specific morphology of a given diblock copolymer is determined by its composition, i.e. the volume fraction of one of the components, Φ, and the parameter χN, where χ is the Flory-Huggins interaction parameter and N is the degree of polymerization of the diblock.3 For example, at the critical value of χN = 10.5, a lamellar morphology is formed for a symmetric diblock copolymer with Φ = 0.5.4 On either side of the lamellar range, in specific composition windows, the diblock copolymer assumes the remaining periodic morphologies, as depicted schematically in Figure 1.1.
In addition to the morphologies obtained from simple diblock copolymers, more complicated domain structures can be formed by preparing block polymers that have multiple blocks of varying chemistry, as well non-linear backbone architectures, such as star block copolymers. In the former case, as a next level of complexity, linear triblock terpolymers with three chemically distinct domains (e.g. ABC type) have been show to microphase separate into a wealth of novel structures beyond those of the standard
diblock copolymer phase diagram.5-9 Multiple arm star block copolymers, have also been investigated and have been shown to form original microdomain morphologies which are dependent on the chain composition and connectivity.10-13 The wealth of morphologies that can be achieved by block polymer microphase separation makes them appealing for the preparation of structured materials for a wide range of applications.
Figure 1.1. Schematic of diblock copolymer morphology. The numbers percentages indicate the volume fraction of the component shown in dark in the figure. The morphologies are symmetric beyond 50% volume percent, with the dark domains becoming the light domains.
1.3
Binary Blends of Block Copolymers
Commercial polymer based materials are frequently comprised of different polymeric species blended together. Blending allows not only for a reduction in costs, but serves also as an inexpensive and facile method to tune and manipulate the properties of the polymer system for a given application. As a result of their inherent ability to form microstructured phases, using block copolymers as one of the components in a blend gives rise to a whole range of possible material properties beyond simple miscibility or enhancement of a particular physical property. Nonetheless, since most pairs of homopolymers are immiscible, block copolymers are very often used in blend systems as compatibilizers.14 That is, an AB-type block copolymer can be used as a surfactant to emulsify a mixture of A and B polymers. The block copolymer migrates to the interface
between the A and B polymer phases, stabilizing the micelles, as shown schematically in Figure 1.2.
Figure 1.2. Schematic showing how a block copolymer acts to stabilize an immiscible blend of two homopolymers. The size of the blue micelles is on the order of 1 µm.
Numerous studies have been undertaken on blends of block copolymers with homopolymers as well as block copolymers with other block copolymers.15 In the latter category, the bulk of the work has been on blends of two diblock copolymers of moderate molecular weight (predominantly ~ 1 x 10⁵ g/mol). A series of publications by Hashimoto et al. examined the morphology and microphase separation behavior of blends of two A-B type diblock copolymers identical in chemical composition but varying in degree of polymerization and volume fraction of the respective blocks.16-24 The blends displayed a rich variety of single microphase or macrophase separated morphologies, depending on blend composition (volume fraction of the respective diblocks), individual copolymer composition (volume fraction of the constituent blocks), and molecular weight ratio (R, defined as the ratio of the degree of polymerization of the larger diblock copolymer to the smaller copolymer).
lamellar morphology. First, the blends displayed complete miscibility (i.e. a single microphase separated lamellar morphology) when R < 5. For higher ratios of molecular weights, the blends were found to macrophase separate into nearly pure lamellar microdomains with different domain spacings, corresponding to the larger and smaller diblocks. Second, a miscibility gap opened up when the weight fraction of the larger diblock was less than 0.7 for R > 7 (in the range 5 < R < 7, the miscibility gap was smaller). That is, at higher loadings of the smaller diblock, the blends showed two distinct microphase separated phases. Third, morphological transitions to an unexpected
cylindrical morphology were seen upon blending at a particular composition and R
value.23
Hashimoto et al. also studied blends in which the constituent diblocks were not symmetric, and a range of morphologies was observed that depended on the overall volume fraction of the A and B blocks in the blend.18 The observation of complete miscibility for R < 5 was also still valid, unless the composition of each of the two block copolymers was highly asymmetric. For example, in the case where one polymer forms A-type spheres and the other forms B-type spheres, the overall morphology was that of a large grain mixture of the two types of individual morphologies. In addition, lamellar structures were observed, at certain intermediate compositions, in blends of complementary cylinder-forming block copolymers, chosen is such a way that the overall volume fraction in the blend was near 0.5.
Several theoretical studies have looked at the behavior of binary diblock copolymer blends in an effort to map out a phase diagram of these systems. Lyatskaya et
free energy for the cylindrical morphology in a narrow composition window with wlarge ≤
0.4 for two lamellar forming diblock copolymers.31 The self-consistent field theory (SCFT) study by Matsen32 focused on selected values of χN and R, and demonstrated the macrophase separation into two coexisting lamellar phases for R > 5. Shi and Noolandi utilized the SCFT to map out a phase diagram (“phase cube”) for a pair of diblocks of equal length (i.e. R = 1) and found interesting changes in the phase diagram, but their work did not predict phase transitions to curved interface structures, such as cylinders, when the effective volume fraction of the blends was near 0.5, unless one of the diblocks was highly asymmetric (i.e. nearly a homopolymer).33 In another study, Shi and Noolandi investigated the effects of short diblocks (effectively non-ordering surfactants, since χN < 10.5) on the phase behavior of strongly segregated long diblocks (R = 10).34 They determined that when their composition was near 0.5, a sizeable proportion (~ 20%) of the short diblock chains tended to segregate to the interface between the large diblock domains. They also found that the chain end distribution of the long diblock was found to deviate from the analytical SSL theory of Semenov,35 with the chain end density increasing gradually from the interface to the center of the domain. This hints at the possibility of chain end effects playing a role in determining the microstructure. In the case of the SSL theory of Lyatskaya et al., the chains are presumed to be highly stretched and the long diblock chain ends are explicitly excluded from folding back and mixing with the short diblock segments near the interface.31
1.4
Nanocomposites
Composite materials that consist of a matrix (metal, polymer, ceramic) with embedded reinforcement (filaments, whiskers, particulate) comprise many of today’s
high performance engineering materials.36, 37 Currently, one of the fastest growing areas of materials research is in composite systems where the characteristic length scales of the filler material are in the nanometer range, i.e. nanocomposites. Research in polymer nanocomposites has expanded beyond simple polymer-nanocrystal dispersions for refractive index tuning, or clay-filled homopolymers primarily pursued for mechanical reinforcement, barrier properties, and flame retardancy, to include high performance systems containing a wide range of variable aspect ratio nanoscale fillers (e.g. carbon nanotubes (CNTs)) for diverse applications such as EMI-shielding, conductive coatings, self-passivation, sensors, catalysis, and photonics.38, 39 In many of these applications the control of the composite architecture, i.e. location and orientation of the nanoscale inclusions, is a prerequisite to enable maximum performance and function of the material. Key challenges are thus to provide both synthetic and processing strategies towards ordered heterogeneous materials and then to study the basic structure-property relationships in nanocomposites, enabling the rational design of the next generation of these materials.
Nanometer-sized filler materials are particularly interesting, since their inherently large surface area-to-volume ratio, allows less of the additive to be used in order to achieve a desired property or level of property enhancement. Moreover, due to the small size of the filler, certain properties may be modified while unaffecting others, e.g. mechanical enhancement while maintaining optical transparency. The exploitation of nanometer-size specific properties of matter, e.g. luminescence of semiconductor nanocrystals, due to quantum confinement,40-42 also offers access to a host of new types of functional composites. Beyond enhancement of static properties, there is a wealth of
opportunities for future applications that arise from the dynamic response of nanocomposite materials to external stimuli. For example, in composite materials for actuation processes, since switching speed is primarily diffusion limited and scales as the square of the feature size, it could be significantly reduced when nanoscopic diameter fibers are used.43
In order to understand the extraordinary properties of nanocomposite materials, it is instructive to consider the characteristic differences of nanometer-sized and traditional filler composites. Six characteristic features may be associated with nanocomposite materials: (1) particle-particle correlation arising at low concentrations (< 0.1 vol%), (2) ultra low percolation thresholds (~ 1 vol%), (3) large particle number densities up to ~ 1020 /cm3, (4) extensive interfacial area per volume of particles (~107 cm2/cm3), (5) small particle-particle distances, and (6) comparable length scales between the particle size, the distance between particles, and the typical relaxation volume of a polymer chain (~ Rg3,
where Rg is the polymer radius of gyration, and Rg ~ 10 nm for typical polymer molecular
weights). The interfacial area per particle volume increases by several orders of magnitude as the filler size shrinks to the nanometer length scale. This is demonstrated in Figure 1.3, where the interfacial area per particle volume, A/V ~ 1/d + 1/l, is shown as a function of the particle radius, d, and aspect ratio, l/d (with l the particle length). Since the static and dynamic characteristics of a polymer chain in the vicinity of a surface are influenced by the surface, the properties of polymer chains less than a few Rg away from
the particle surface differ from those of the bulk polymer material. The response of nanocomposite materials to mechanical forces will therefore be determined by the collective properties of a “communicating” network of nanoscopic inclusions, rather than
an effective property of discrete inclusions embedded within a bulk matrix material as found in “classical” composite materials.44
Figure 1.3. Calculated interfacial area per volume of particles (in nm-1) assuming a right circular cylindrical particle shape for different particle diameter d and aspect ratio l/d. Exfoliated clay (laponite or montmorillonite) particles, spherical nanoparticles, and single wall carbon nanotubes generate up to four orders of magnitude more interfacial area as compared to conventional filler materials, like glass fibers, of equal volume filling fraction. Reproduced from reference 44.
1.5
Block Copolymer Nanocomposites
1.5.1 Theoretical Work
microstructure formation, have spurred recent empirical studies in the field. The detailed behavior of the particles in a BCP matrix of a specific morphology and dimension depends on many factors, such as particle core size, size and chemistry of the stabilizing surface ligands, size of the corona region, and interaction (χ) with the polymer host. The chemistry of the block copolymers themselves can also be varied to include domains with diverse properties (glassy, rubbery, crystalline, liquid crystalline) and a range of processing methods can be used to influence the morphology of the composites. Some of the key parameters mentioned above are depicted schematically in Figure 1.4.
Figure 1.4. Schematic of important parameters for BCP/nanoparticle composites. The core size, dcore, is the diameter of the rigid particle. The corona is the shell occupied by the stabilizing surface ligands, and its thickness is tcorona. The effective size of the nanoparticle is then dcore+2tcorona. The IMDS, or inter-material dividing surface, is the interface between the A and B type domains. The characteristic domain spacing is given by L=lA+lB, where lA and lB are the size of the A and B domains, respectively.
Much of the oft-cited theoretical modeling of BCP/nanoparticle composite behavior has been done by the Balazs group, using a combined density functional (DFT) and self-consistent field theoretical (SCFT) approach, though some recent simulation work on these systems by Fredrickson et al., has questioned the applicability of this combined methodology.45 Nevertheless, important insights can be gained from this work, and Huh et al. and Thompson et al. were the first to study by computer simulation the
structure formation process in BCP-particle blends.46, 47 In these studies, the effect of the corona regions, comprised of the surface grafted ligands, was ignored and replaced by an effective interaction parameter. The chemical affinity of a particle P to a polymer domain
X was expressed by the Flory-Huggins interaction parameter
χ
PX, that quantifies theenthalpic interactions between the particle and the respective monomeric units of block
X. In their studies, Thompson et al. assumed a neutral interaction of the particles with
respect to one of the blocks, i.e.
χ
PA = 0 andχ
PB > 0. For a 2-D system, representing amixture of spherical nanoparticles within a lamellar BCP in the intermediate segregation regime, they showed that interfacial segregation of particles (i.e. at the boundary between domains of blocks A and B) is expected to occur in the limit of small particle sizes (d/L = 0.2, where L = lA + lB is the lamellar spacing, d the particle diameter, and hi the thickness
of polymer domain i). Concentration of the particles at the center of a particular domain was predicted for somewhat larger particle diameters (d/L = 0.3). The results were interpreted as a compromise between (a) the penalty in conformational entropy of the polymer, which has to deform in order to accommodate particles in its vicinity, and (b) the gain in translational entropy of the particles for free dispersion throughout the domain.
Further theoretical studies by Lee et al. and Buxton et al., using the same hybrid SCFT/DFT approach, suggest that by tuning the particle/polymer interaction (i.e.
χ
PX),the distribution of particles in the matrix can be varied and a phase transition to a new microdomain geometry within the microphase separated structure can be induced, by effectively changing the volume fraction of the minority block. This suggests an even wider parameter space in the morphology of BCP/nanoparticle composites, depending on
the particle size and volume filling fraction.48, 49 Recently, Thompson et al. extended the SCFT/DFT approach to study the influence of particle sequestration on the mechanical properties of BCP/nanoparticle composites, however, their simulations were restricted to the melt state.50
When applying the results of the numerical studies mentioned above to the interpretation of experiments, it should be noted that neglecting the particles’ corona region on the miscibility and rigidity of the sequestered particles, will render the model less applicable in situations where high molecular weight polymers are grafted to a particle’s surface (i.e. dcore/tcorona < 1, see Figure 1.4). In fact, the behavior of polymer
chains grafted to a curved surface, in which the radius of curvature is on the order of Rg
of the host block, is just beginning to be explored.51
1.5.2 Experimental Work
The experimental work on BCP/nanoparticle composites has followed two major approaches for the preparation of BCP/nanoparticle composite materials, distinguished by the sequence of microstructure formation and particle synthesis; (1) the in-situ synthesis of inorganic particles within a BCP domain that has been preloaded with a precursor, and (2) co-assembly, where ex-situ synthesized nanoparticles, surface-tailored in order to allow preferential sequestration within a target domain, are blended with the BCP matrix (usually in the presence of a volatile solvent, e.g. by means of solution casting).
The first experiments on nanoparticle formation within BCP microdomains followed the former method, with the synthesis of gold or silver nanocrystals in lamellar, cylindrical, and spherical domains of a phosphine-functionalized BCP, in which the monomers were preloaded with metal salt.52, 53 A similar approach was used for the
synthesis of semiconductor particles within the domains of a norbornene-derived BCP that was preloaded with lead salt.52-54 While this work provided an early proof of concept, the complex synthesis of suitable BCP compositions resulted in a shift towards the ‘nanoreactor scheme’. Here, amphiphilic BCPs that contain polar groups (usually derived from poly(ethylene oxide), poly(acrylate), or poly(vinyl pyridine)), are first microphase separated and subsequently immersed in a salt solution. Due to its chemical affinity, the salt selectively infiltrates the hydrophilic copolymer domain. The nanocrystals then form selectively upon reduction of the precursor within the pre-loaded domains.55-58 Following this approach, monolayer thin films with 2-D hexagonal patterns of metal particles in a BCP matrix were produced by Bootongkong et al., by infiltrating the polar hydrophilic domains of a spherical-microstructure-forming poly(styrene-b-acrylic acid) copolymer with a silver salt that is reduced in a subsequent reaction step. The authors demonstrated that the BCP nanoreactor scheme might be applied to a wide variety of metal (e.g. Pd, Cu, Au, Ag) as well as semiconductor (e.g. PbS) nanocrystals.59 Nevertheless, the relatively poor control of the particle size, as well as the limited possibilities to control the surface chemistry and architecture of the embedded nanocrystals, are major drawbacks of the in-situ approach for applications that rely on specific electronic, optical, or magnetic properties of individual nanocrystals, which are intimately related to particle size, shape, and architecture.60, 61,62
The ex-situ approach allows precise control of the structural characteristics of the sequestered component, since it moves the particle synthesis step from inside the BCP matrix to a well controlled chemical reaction environment. The strategy is to synthesize nanocrystals of desired size, shape, or core-shell architecture, and to tailor the particles’
surface chemistry, such that chemical affinity to one of the blocks of the copolymer will drive the particles into the respective target polymer domain during the self-organization process. Selective chemical compatiblization of the nanoparticles into an AB-type BCP is typically achieved by attaching an oligomer or polymer to the particle surface that will favorably interact with the target copolymer domain (say domain A). Depending on the chemistry of the core materials and the type of corona, grafting-to, grafting-from, as well as micelle-based nanoreactor schemes have been developed for grafting compatiblizing agents to a particle’s surface.63-65
The first mention of the ex-situ approach was made by Hamdoun et al., who synthesized iron oxide nanocrystals with surface grafted poly(styrene) (PS), that were subsequently solublized in the PS domain of a lamellar poly(styrene-b-butyl methacrylate) diblock copolymer.66 Although the periodicity of the lamellar microstructure was too small (L ~ 32 nm) to clearly resolve the particles within the domain microstructure, the samples were studied by small angle neutron scattering and it was suggested that smaller particle sizes (d = 4 nm) tended to localize close to the interface, whereas larger particles (d = 6 nm) tended to locate at the center of the BCP domain.67
Bockstaller et al. demonstrated that the preferential sequestration of PS-coated gold nanocrystals within a high molecular weight (Mw ~ 800 kg/mol), lamellar-forming
poly(styrene-b-ethylene propylene) (PS-PEP) block copolymer facilitates the preparation of metallodielectric Bragg-reflector-type structures, that exhibit significantly enhanced reflectivity as compared to the neat BCP material.68 The PS coated nanocrystals (d = 3 nm) were found to preferentially and uniformly sequester within the PS domains of the
copolymer. The enhanced reflective properties could be attributed to the increase in the effective dielectric contrast between the alternating particle-loaded PS domains and the particle-free PEP domains. This interpretation was supported by Buxton et al., in their studies based on finite difference time domain (FDTD) modeling of the optical properties of BCP/nanoparticle composite materials.49
In recent studies, Wei et al. succeeded in preferentially sequestering surface modified TiO2 and CdS nanoparticles within lamellar poly(styrene-b-methyl
methacrylate) and poly(styrene-b-ethylene oxide) copolymers.69, 70 These studies demonstrate the feasibility to pattern a wide range of dielectric, semiconducting, and metallic materials on the nanometer length scale by simultaneous self-organization of BCPs in the presence of ex-situ synthesized particles. The experimental evidence also supports the theoretical conclusion that entropic effects, related to the characteristic length scales of the materials, are relevant parameters that determine the location of the nanoscale particles within the domain microstructure. Bockstaller et al. prepared a series of samples by blending aliphatic-modified gold (d = 3 nm) and silica (d = 22 nm) nanoparticles with a lamellar PS-PEP BCP.71 Since the PEP domains are essentially aliphatic, a chemical affinity of the nanoparticles towards the PEP domain was expected in both cases. Gold nanocrystals were found to segregate to the inter-material dividing surface (IMDS) that separates the PS and PEP domains, whereas the larger silica nanocrystals were preferentially located at the center regions of the PEP domains. Interestingly, the morphological characteristics of the two different binary BCP/nanoparticle mixtures are retained in the ternary (particle 1)-(particle 2)-BCP mixture, and result in autonomous particle separation and organization into a stack-like
structure comprising alternating sheets of silica and gold nanocrystals. It should also be noted, that particle sizes larger than d/L ~ 0.3 could not be homogeneously mixed with the BCP but rather were found to aggregate and macrophase separate. This presumably arises as a consequence of the increasing energy penalty, due to increased chain deformation, curvature, and elastic bending deformations of the layered structure as larger particle sizes are included within lamellae. Since the energy of an inclusion is proportional to the square of the local surface curvature, macrophase separation of the additives will eventually occur.
Besides the particle core diameter, the grafting density, as well as the molecular weight of the surface grafted ligands, were shown to affect the particle distribution in BCP matrices. Blending experiments on PS-functionalized fullerenes (C60) with a
lamellar poly(styrene-b-isoprene) block copolymer demonstrate that with increasing molecular weight and increasing number density of the surface bound PS, the particles tend to localize at the center of the PS domains of the BCP, as opposed to a more homogeneous distribution in the case of a less dense, low molecular weight functionalization. This indicates that a dense packing of a high molecular weight surface bound polymer acts to increase the effective size of the particle, similar to an increase of the particle core diameter.72 Kim et al. also showed that grafting density plays a determining role in the partitioning of the nanoparticles in a block copolymer matrix. Using PS-coated nanoparticles dispersed in a poly(styrene-b-2-vinylpyridine) (PS-P2VP) copolymer matrix, the nanoparticles tended to segregate near the interface when the grafting density was low (less than 1.3 chains/nm2). This was an indication that part of the gold surface was being exposed, and the affinity of the bare gold nanoparticle surface
to the pyridine groups in the P2VP domain was responsible for the distribution of the nanoparticles at the IMDS.73 Using the same polymer system (PS-P2VP), the researchers also tested the effect of the size of the stabilizing ligand (i.e. its molecular weight) on the behavior of the composites. They found that there is an interplay between ligand size and areal chain density on the nanoparticle surface. A critical chain density for nanoparticle segregation to the IMDS was found that decreased with increasing ligand molecular weight, and was described by a simple scaling relationship which took into account the curvature of the nanoparticle.74 In addition, the researchers also looked at mixed ligand gold nanoparticles, containing both PS and P2VP oligomers. The behavior of the mixed ligand nanoparticles indicated that the stabilizing ligands were mobile on the gold surface and tended to phase separate to form a “Janus” particle, with one side covered in PS ligands and the other with P2VP ligands. As a result, segregation of the nanoparticles to the interface between the PS and P2VP domains was found in a very broad range of composition (10% - 90% mol PS).75
As a final note, when blending polymer-coated nanoparticles with block copolymers, the addition of the particles acts to increase the effective volume fraction of the surface-grafted polymer species in the blend. This induces a phase transition of the equilibrium microdomain structure if the amount of particles exceeds a threshold value, according to the phase diagram of the block copolymer. In line with previous theoretical studies,48 this effect has been demonstrated empirically by Kim et al., who reported a lamellar-to-cylindrical phase transition upon blending PS-coated gold nanocrystals with a PS-P2VP BCP, when a critical particle filling fraction was exceeded.76
1.6
References
[1] F. S. Bates, G. H. Fredrickson. "Block Copolymer Thermodynamics - Theory and Experiment." Annual Review of Physical Chemistry, 41, 525-557 (1990).
[2] F. S. Bates. "Polymer-Polymer Phase-Behavior." Science, 251(4996), 898-905 (1991).
[3] P. J. Flory. Principles of Polymer Chemistry (Cornell University Press, Ithaca, 1953).
[4] L. Leibler. "Theory of Microphase Separation in Block Co-Polymers."
Macromolecules, 13(6), 1602-1617 (1980).
[5] U. Krappe, R. Stadler, I. Voight-Martin. "Chiral Assembly in Amorphous ABC Triblock Copolymers - Formation of a Helical Morphology in Polystyrene-Block-Polybutadiene-Block-Poly(Methyl Methacrylate) Block-Copolymers."
Macromolecules, 28(13), 4558-4561 (1995).
[6] R. Stadler, C. Auschra, J. Beckmann, U. Krappe, I. Voight-Martin, L. Leibler. "Morphology and Thermodynamics of Symmetrical Poly(A-Block-B-Block-C) Triblock Copolymers." Macromolecules, 28(9), 3080-3097 (1995).
[7] W. Zheng, Z.-G. Wang. "Morphology of ABC Triblock Copolymers."
Macromolecules, 28(21), 7215-7223 (1995).
[8] J. Bang, S. H. Kim, E. Drockenmuller, M. J. Misner, T. P. Russell, C. J. Hawker. "Defect-free nanoporous thin films from ABC triblock copolymers." Journal of
the American Chemical Society, 128(23), 7622-7629 (2006).
[9] T. S. Bailey, H. D. Pham, F. S. Bates. "Morphological behavior bridging the symmetric AB and ABC states in the poly(styrene-b-isoprene-b-ethylene oxide) triblock copolymer system." Macromolecules, 34(20), 6994-7008 (2001).
[10] S. Sioula, N. Hadjichristidis, E. L. Thomas. "Direct evidence for confinement of junctions to lines in an 3 miktoarm star terpolymer microdomain structure."
Macromolecules, 31(23), 8429-8432 (1998).
[11] S. Sioula, N. Hadjichristidis, E. L. Thomas. "Novel 2-dimensionally periodic non-constant mean curvature morphologies of 3-miktoarm star terpolymers of styrene, isoprene, and methyl methacrylate." Macromolecules, 31(16), 5272-5277 (1998). [12] N. Hadjichristidis. "Synthesis of miktoarm star (mu-star) polymers." Journal of
Polymer Science Part a-Polymer Chemistry, 37(7), 857-871 (1999).
[13] N. Hadjichristidis, S. Pispas, M. Pitsikalis, H. Iatrou, C. Vlahos. "Asymmetric Star Polymers: Synthesis and Properties," in Branched Polymers I, (1999), pp. 71-127.
[14] A. V. Ruzette, L. Leibler. "Block copolymers in tomorrow's plastics." Nature
[15] I. W. Hamley. "Chapter 6: Blends of Block Copolymers," in The Physics of Block
Copolymers (Oxford University Press, New York, 1998), pp. 331-412.
[16] T. Hashimoto, K. Yamasaki, S. Koizumi, H. Hasegawa. "Ordered Structure in Blends of Block Copolymers .1. Miscibility Criterion for Lamellar Block Copolymers." Macromolecules, 26(11), 2895-2904 (1993).
[17] T. Hashimoto, S. Koizumi, H. Hasegawa. "Ordered Structure in Blends of Block-Copolymers .2. Self-Assembly for Immiscible Lamella-Forming Block-Copolymers."
Macromolecules, 27(6), 1562-1570 (1994).
[18] S. Koizumi, H. Hasegawa, T. Hashimoto. "Ordered Structure in Blends of Block-Copolymers .3. Self-Assembly in Blends of Sphere-Forming or Cylinder-Forming Copolymers." Macromolecules, 27(15), 4371-4381 (1994).
[19] D. Yamaguchi, J. Bodycomb, S. Koizumi, T. Hashimoto. "Ordered structure in blends of block copolymers. 4. Location of the short diblock." Macromolecules,
32(18), 5884-5894 (1999).
[20] D. Yamaguchi, S. Shiratake, T. Hashimoto. "Ordered structure in blends of block copolymers. 5. Blends of lamella-forming block copolymers showing both microphase separation involving unique morphological transitions and macrophase separation." Macromolecules, 33(22), 8258-8268 (2000).
[21] F. Court, T. Hashimoto. "Morphological studies of binary mixtures of block copolymers. 1. Cosurfactant effects and composition dependence of morphology."
Macromolecules, 34(8), 2536-2545 (2001).
[22] F. Court, T. Hashimoto. "Morphological studies of binary mixtures of block copolymers. 2. Chain organization of long and short blocks in lamellar microdomains and its effect on domain size and stability." Macromolecules,
35(7), 2566-2575 (2002).
[23] D. Yamaguchi, T. Hashimoto. "A phase diagram for the binary blends of nearly symmetric diblock copolymers. 1. Parameter space of molecular weight ratio and blend composition." Macromolecules, 34(18), 6495-6505 (2001).
[24] D. Yamaguchi, H. Hasegawa, T. Hashimoto. "A phase diagram for the binary blends of nearly symmetric diblock copolymers. 2. Parameter space of temperature and blend composition." Macromolecules, 34(18), 6506-6518 (2001). [25] G. Hadziioannou, A. Skoulios. "Structural Study of Mixtures of Styrene Isoprene
2-Block and 3-Block Copolymers." Macromolecules, 15(2), 267-271 (1982). [26] C. M. Papadakis, K. Mortensen, D. Posselt. "Phase behavior of binary blends of
symmetric polystyrene-polybutadiene diblock copolymers studied using SANS."
European Physical Journal B, 4(3), 325-332 (1998).
[27] L. Kane, M. M. Satkowski, S. D. Smith, R. J. Spontak. "Phase behavior and morphological characteristics of compositionally symmetric diblock copolymer blends." Macromolecules, 29(27), 8862-8870 (1996).
[28] E. K. Lin, A. P. Gast, A. C. Shi, J. Noolandi, S. D. Smith. "Effect of short diblock copolymers at internal interfaces of large diblock copolymer mesophases."
Macromolecules, 29(18), 5920-5925 (1996).
[29] G. Floudas, D. Vlassopoulos, M. Pitsikalis, N. Hadjichristidis, M. Stamm. "Order-disorder transition and ordering kinetics in binary diblock copolymer mixtures of styrene and isoprene." Journal of Chemical Physics, 104(5), 2083-2088 (1996). [30] K. Almdal, J. H. Rosedale, F. S. Bates. "Order-Disorder Transition in
Binary-Mixtures of Nearly Symmetrical Diblock Copolymers." Macromolecules, 23(19), 4336-4338 (1990).
[31] J. V. Lyatskaya, E. B. Zhulina, T. M. Birshtein. "Theory of Supermolecular Structures in Polydisperse Block Copolymers .4. Cylindrical Domains in Binary-Mixtures of Diblock Copolymers and Cylinder Lamellae Transition." Polymer,
33(2), 343-351 (1992).
[32] M. W. Matsen. "Immiscibility of Large and Small Symmetrical Diblock Copolymers." Journal of Chemical Physics, 103(8), 3268-3271 (1995).
[33] A. C. Shi, J. Noolandi. "Binary-Mixtures of Diblock Copolymers - Phase-Diagrams with a New Twist." Macromolecules, 28(9), 3103-3109 (1995).
[34] A. C. Shi, J. Noolandi. "Effects of Short Diblocks at Interfaces of Strongly Segregated Long Diblocks." Macromolecules, 27(11), 2936-2944 (1994).
[35] A. N. Semenov. "Contribution to the Theory of Microphase Layering in Block-Copolymer Melts." Soviet Physics JETP, 88(4), 1242-1256 (1985).
[36] D. Hull, T. W. Clyne. An Introduction to Composite Materials, 2nd ed., Cambridge Solid State Science Series (Cambridge University Press, Cambridge, UK, 1996).
[37] J. C. Williams. "High performance materials development in the 21(st) century: Trends and directions," in Designing, Processing and Properties of Advanced
Engineering Materials, Pts 1 and 2, S.-G. Kang, T. Kobayashi, eds. (Trans Tech
Publications Inc., Enfield, NH, USA, 2004), pp. 7-12.
[38] R. Shenhar, T. B. Norsten, V. M. Rotello. "Polymer-mediated nanoparticle assembly: Structural control and applications." Advanced Materials, 17(6), 657-669 (2005).
[39] M. R. Bockstaller, R. A. Mickiewicz, E. L. Thomas. "Block copolymer nanocomposites: Perspectives for tailored functional materials." Advanced
Materials, 17(11), 1331-1349 (2005).
[40] C. B. Murray, D. J. Norris, M. G. Bawendi. "Synthesis and Characterization of Nearly Monodisperse Cde (E = S, Se, Te) Semiconductor Nanocrystallites."
Journal of the American Chemical Society, 115(19), 8706-8715 (1993).
[41] D. J. Norris, A. Sacra, C. B. Murray, M. G. Bawendi. "Measurement of the Size-Dependent Hole Spectrum in Cdse Quantum Dots." Physical Review Letters,