Customized Data Visualization Using
Structured Video
by Kathleen Lee Evanco
Bachelor of Science, Computer Science and Engineering Massachusetts Institute of Technology
May 1993
Submitted to the Program in Media Arts and Sciences, School of Architecture and Planning,
in partial fulfillment of the requirements for the degree of Master of Science in Media Arts and Sciences at the Massachusetts Institute of Technology
February 1996
@ Massachusetts Institute of Technology, 1995 All Rights Reserved
:.:A2ssACausrrsT 7NSmUTE
OF TECHNOLOGY
FEB 211996
Author:
Program in Media Arts and Sciences November 10, 1995
Certified by: V. Michael Bove, Jr.
Associate Professor of Media Technology Program in Media Arts and Sciences Thesis Supervisor
Accepted by: Stephen A. Benton
Chairperson, Departmental Committee on Graduate Students Program in Media Arts and Sciences
Customized Data Visualization Using
Structured Video
by Kathleen Lee Evanco
Submitted to the Program in Media Arts and Sciences, School of Architecture and Planning,
on November 10, 1995
in partial fulfillment of the requirements for the degree of Master of Science in Media Arts and Sciences
Abstract
Structured video describes a video sequence in terms of its compo-nent structural parts and a set of instructions describing how to recombine them. Structured video research has primarily focused on entertainment applications such as creating and displaying mov-ies. In contrast, the thesis presented in this paper emphasizes the advantages of structured video as a tool for visual communication of information. This thesis expands the current field of structured video research by using structured video as a data visualization technique in a weather information system. Using a structured video approach to data visualization allows users to customize the format of the visual presentation of information. Issues addressed include collection and parsing of information, automatic composi-tion of video sequences, and forms of customizacomposi-tion and interaccomposi-tion with the resulting video sequence.
Thesis Supervisor: V. Michael Bove, Jr.
Title: Associate Professor of Media Technology
Customized Data Visualization Using
Structured Video
by Kathleen Lee Evanco
The following people served as readers for this thesis:
Reader: Walter Bender
Associate Director for Information Technology MIT Media Laboratory
Reader:
Glorianna Davenport
Associate Professor of Media Technology Program in Media Arts and Sciences
Acknowledgments
This probably looks like a thesis to you, but when I look at it, I see much more. I see two years of my life spent in a haze of not under-standing who I am or what makes me tick. This paper is proof to myself that I have emerged from that haze with a new life, a grounded sense of identity, and the knowledge that I can do any-thing I set my mind to. Of course, I didn't find my way alone, and I would like to thank the people who made all of this -the thesis and the deeper achievements it represents -possible:
Brian -thank you for always being there. You gave me strength when I had none, you gave me motivation when I ran out, and you gave me patience when I lost my own. You are probably the only reason that I managed to find my way at all -thank you for wanting this for me as much as (if not more than) I wanted it for myself.
My advisor, Mike Bove -thank you for showing confidence in me even when I did not deserve it. Thank you for being human, and for realizing that I am only human.
Readers of this thesis, Glorianna and Walter -thank you both for your patience and your help, even though I waited till the last minute to ask.
My dear friends, Beth, Nancy, Lisa, Kacey, Jim and Roger -thank you for just being there -always. I absolutely could not have done this without your constant reassurance.
My co-worker, Stefan -for providing endless support for my work, and for making my thesis a reality.
Jon Orwant and Dan Gruhl for helping me learn to write perl scripts even though half of what you said sounded like it was in another language.
The gardeners, JSheena, Araz, Karrie, Jill, Shawn, Michelle and Chris and previous gardeners, Brett, Mark, and Cris -Thanks for being there during the long days and even longer nights. Thank you
for being a part of my life. You've all given me more than you will ever know.
My family, Mom, Dad, Nicky, Chris, Colleen, Lance, Brennan,
Katelyn, Mom and Dad Brown and Paul -Thank you for your sup-port and confidence. I know that lately it seemed like I dropped off the face of the earth. I just wanted to let you know I'm back.
1 Introduction
.
... .
1.1 Data Visualization ... 1.2 Structured Video ... ... 1.3 A New Direction for Structured Video 1.4 W hy W eather? . . . . ..1.5 Thesis Overview ...
2 A Structured Video Decoder
2.1 The Cheops Imaging System ... 2.2 The Isis Scripting Language ...
3 Implementation .
.. ..3.1 Collecting Weather Data ... 3.1.1 Data Set ... 3.1.1.1 Surface Observations 3.1.1.2 Nested Grid Model . .
3.1.1.3 Climatological Report 3.1.2 Data Retrieval ... 3.2 Requesting Information ... 3.2.1 Request Files ...
3.2.2 Region Request Files .... 3.3 Parsing the Weather Data ....
3.4 Creating the Isis Scripts ... 3.4.1 City Isis Files ... 3.4.2 Data Isis Files ... 3.4.3 Map Isis Files ... 3.4.4 Main Isis Files ...
3.5 Using the Weather System ....
3.5.1 Makeweather
3.5.2 Weather: A Graphical Interface .
3.5.3 Executing the Programs and Isis 3.6 Extending the System ...
Scripts
Table of Contents
13
. 13 . 15 . 17 . 17 . 19 . 21 . 2327
. 27 . 28 . 29 . 29 . 30 . 31 . 34 . 34 . 35 . 37 . 38 . 38 . 39 . 40 . 40 . 41 . 42 . 43 . 45 . 47 . . . . . . . . . . .. . .. . .. .Table of Contents
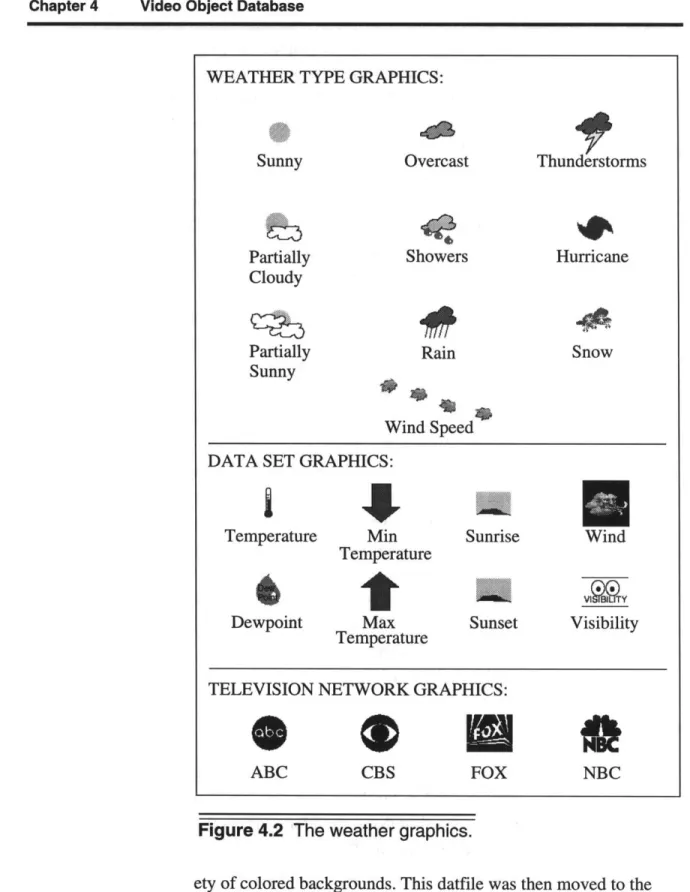
4 Video Object Database
4.1 4.2 4.3 Maps ... Graphics ... Text ...
5 Conclusions
.
5.1 Evaluation ... 5.2 If I Had More Time 5.3 Future Work ...A
lsisFiles
A.1 The Request File
A.2 The Main Isis File
A.3 The Data Isis File
A.4 The Map Isis File
A.5
A
City
Isis
File ...
Bibliography
..
. . .49
. . . . 4 9 . . . . 5 1 . . . . 5 3 N EU U U 0 U HUa0E U N S U 517 ... .... .... 57 ...5 7 . . . . 6 0 . . . . 6 1 . . . 63. . . .
6 3
. . . .
6 3
. . . .
6 8
. . . .
6 9
. . . .
7 2
. . . S81
List of Figures
2.1 Processing pipeline of a generic structured video
decoder
...
22
3.1 An example surface observation data file ... 29
3.2 An example nested grid model data file ... 30
3.3 An example climatological data file ... 32
3.4 Diagram of Data directory tree structure ... 33
3.5 An example request file
...
35
3.6 The name Mass is expanded to be the list of cities
included in the region request file
Data/Mass/request
...
36
3.7 Lines of Isis code required to implement a script for
all of New England ... 41
3.8 The graphical interface to the weather system ... 43
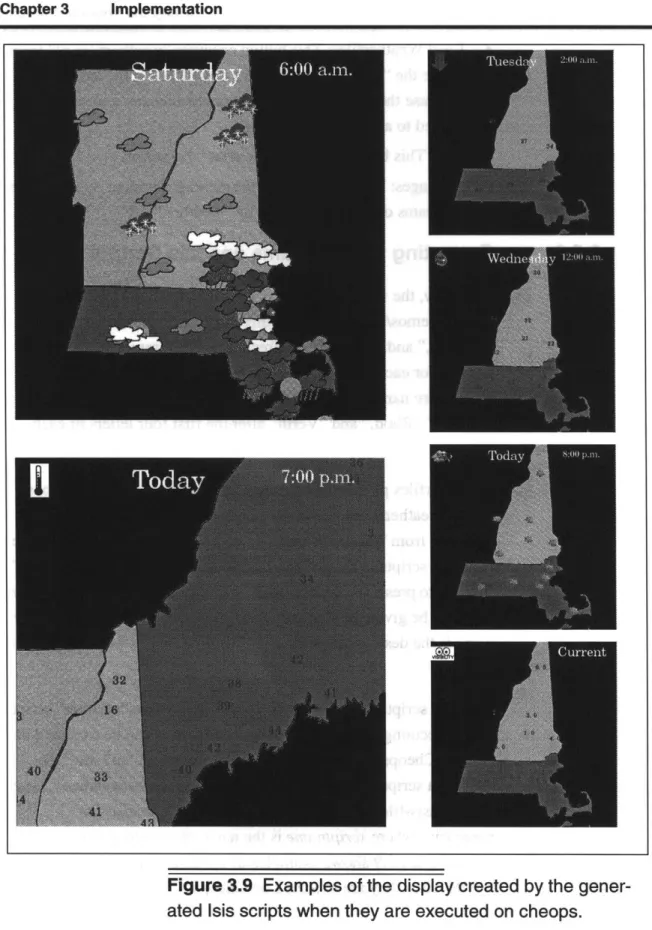
3.9 Examples of the display created by the generated
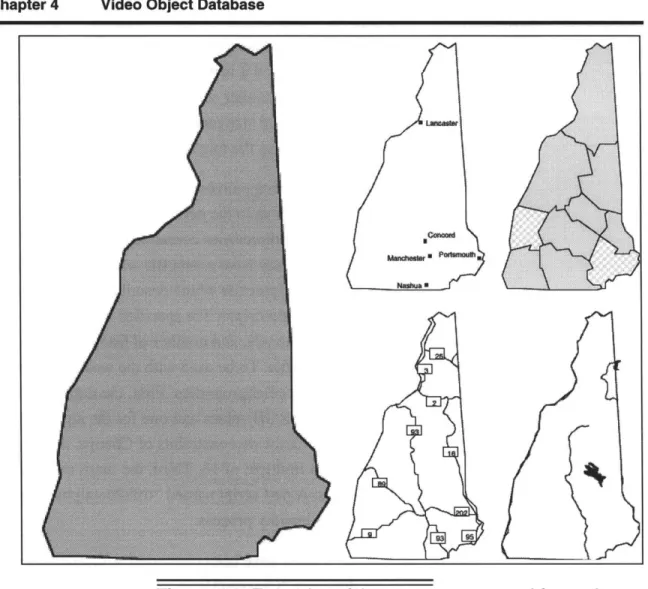
Isis scripts when they are executed on cheops .. . 464.1 Examples of the 5 state maps used for each state
in the system ... 52
Chapter 1
Introduction
Structured video describes a video sequence in terms of its compo-nent structural parts and a set of instructions describing how to recombine them. Structured video research has primarily focused on entertainment applications such as creating and displaying mov-ies. In contrast, the thesis presented in this paper emphasizes the advantages of structured video as a tool for visual communication of information. This thesis expands the current field of structured video research by using structured video as a data visualization technique in a weather information system. Using a structured video approach to data visualization allows users to customize the format of the visual presentation of information. Issues addressed include collection and parsing of information, automatic composi-tion of video sequences, and forms of customizacomposi-tion and interaccomposi-tion with the resulting video sequence.
1.1
Data Visualization
"Whatever relates to extent and quantity may be represented by
geometrical figures. Statistical projections which speak to the
senses without fatiguing the mind, possess the advantage offixing the attention on a great number of important facts."
Alexander von Humboldt, 1811
Alexander von Humboldt was one of the earliest scientists to real-ize the advantages of representing information graphically. In 1817 he prepared the first isothermal chart showing equal lines of tem-perature. Surprisingly, examples of graphical representations of data can be traced back to the 1600s. While the concept of data
Chapter 1 Introduction
visualization is not new, the type of data we are able to represent graphically is increasingly more complex, because of the introduc-tion of computers and computer graphics to the field. From its hum-ble beginnings with simple maps and charts, data visualization has grown to become one of the most widespread and technologically advanced fields [Ear93].
Computer-aided data visualization began in the late 1960s, when the computer allowed scientists to calculate answers to large, com-plex problems which until that point had been too computationally intensive to solve. With this significant increase in the complexity of data came a renewed need for methods of understanding that data. A surge of interest in the field of data visualization occurred in
1987 after the release of the SIGGRAPH panel report Visualization
in Scientific Computing [McC87]. Researchers from a wide variety
of fields began looking for theoretical models and display tech-niques to achieve a greater understanding of their research. Most of the data visualization research today focuses on modeling very complex systems and almost always involves data in more than two dimensions. However, both a simple bar chart and an abstract graphical representation of n-dimensional space are all examples of data visualization.
In the simplest sense, visualization is making pictures out of data. Jose Encarnacao points out in Animation and Scientific
Visualiza-tion that there are essentially two problems to face in creating a data
visualization system:
"Initially, visualization may be considered as a simple tech-nical problem of how to map information into visual forms. In fact, it involves a communication problem of great signif-icance. The mapping process needs to be adapted to the spe-cific goals of the visualization. Moreover, mechanisms must be provided to support the exploration of generated visual
1.2 Structured Video
This quote suggests that in order to determine how numerical infor-mation in a data visualization system will be mapped to a graphical representation, one must first determine the goals of the visualiza-tion. For this thesis, the goals of visualization were very simple. First, the visualization should be a video sequence, where a video
sequence refers to one or more sequential video frames. Second, the visualization should be modeled after a visualization currently
available in a traditional video format in order to show that struc-tured video can achieve similar results. Third, the visualization should be easily understandable.
The above quote also mentions the importance of exploring the generated visualization. The issue of providing mechanisms to sup-port the exploration of the resulting visualization is a focus of this thesis; this thesis will show that structured video is an excellent way of providing interaction that allows exploration of the data space.
1.2
Structured Video
The Information and Entertainment Systems Group of the MIT Media Laboratory has been exploring an image representation known as "structured video" for the past few years. Structured video (also known as model-based video [Har89] or analysis-syn-thesis video [Mus89], [Bov94b]) represents moving images in terms of component parts such as backgrounds and actors instead of sequences of frames. These parts may be objects with uniform depth (2-D), objects with corresponding surface depth values (2 1/
2-D), or particle databases (3-D). These components, along with a
set of instructions describing how they should be assembled, are used to produce video sequences.
Structured video provides advantages over traditional image-based coders. For example, structured video allows complex video sequences to be reduced to simple parametric expressions which leads to high compression rates. Using a traditional coder, a 1
sec-Chapter 1 Introduction
ond video sequence at NTSC resolution would require transmission rates on the order of 40 megabytes per second. Assuming that the structured video receiver has enough memory to locally store the component objects (see Section 2.1), and that the objects can be transmitted in advance, then only the instructions describing how to construct the sequence need to be transmitted. Depending on the language used for the instructions (see Section 2.2), the required transmission rates could drop to the order of kilobytes per second. Another advantage of structured video is that it uses knowledge of the structure of the scene being represented to allow enhanced user interaction [Bov 94b]. In current commercial applications, "cus-tomized video" can mean anything from video on demand to inter-active television. However, because of the limits of the frame-based video representations used in these applications, once the video sequences have been produced, they cannot be significantly altered. This limits the interaction in such systems to high-level choices between different predetermined video selections as opposed to low-level manipulation of the video's structural components. Because structured video creates video sequences by compositing a set of objects, the sequence can be altered at any time, including during display, thus allowing much higher levels of interaction. Past research has shown that such manipulation is achievable with reasonable processing power (see Section 2.1). In a structured video system, the level of interaction is not dictated by the video representation, but instead by the method of interaction used.
A third advantage of structured video is its ability to adapt to
differ-ent display environmdiffer-ents. Again, because the video sequence is represented by its component parts and a set of instructions defin-ing how to reconstruct it, the video can be adapted for a variety of different displays. For example, one script could describe how to construct the sequence for a wall size projection while another could describe how to construct the sequence for a wrist watch size display. Because traditional frame-based representations do not have this versatility, they have prevented researchers from focusing
1.3 A New Direction for Structured Video
on how the display environment should affect the creation of the video sequence. This is one of the most interesting questions intro-duced by such a flexible video representation and it is a focus of current research.
1.3
A New Direction for Structured Video
While the Entertainment and Information Systems group of the MIT Media Laboratory has developed a structured video decoder, it is currently only being used to create movies. This focus on enter-tainment applications overlooks a valuable use for structured video as a method of visually displaying information. This thesis expands the breadth of the current research by examining how structured video principles can be applied to a data visualization system. Structured video is useful for a data visualization application in two ways. First, the main objective of such a system is to allow a user to present data in a coherent graphical fashion. Because structured video uses component video objects and a script describing how to assemble them, it is conducive to assembling data. Each datum can be represented by a video object, while the instructions explain
when, where, and how to place that datum in the overall data space. Second, data visualization systems require a means of interacting with the visual product. Structured video easily provides this func-tionality by allowing direct interaction with the video sequence. Because structured video takes into account the structure of the scene, it is advantageous for a system where the structure of the scene conveys information.
1.4
Why Weather?
Despite the large quantity of weather information available through television, radio, newspapers and the World Wide Web, finding the answers to personal questions is still very difficult. For example, imagine yourself preparing to embark on a trip. You would like to
Chapter 1 Introduction
making a connection in either Denver or Chicago. Which do you choose? Both airports are notorious for delays due to weather. You would be more able to made an educated decision if you could instantly find out what the weather is like in both cities.
Or, perhaps you are planning on driving from Boston to Cleveland. and there are two routes you could take. One is shorter but takes you straight through the snow belt caused by the Great Lakes. The other is a longer, more southerly route that takes you through the Pocono Mountains. Which do you choose? If you had access to a weather system that could show you the weather along the two routes, you could plan the safest, most efficient trip. This thesis attempts to implement a customizeable weather information system that will allow users to answer very user-specific weather related questions.
Weather data was selected for three reasons. First, while customiza-tion and interaccustomiza-tion are important in all data visualizacustomiza-tion systems, they are particularly desirable in an information system that is used
by many different people from many different backgrounds, like a
weather information system. When many people are using an infor-mation system, it must provide a large range of capability in con-trast to a highly specialized data visualization system that can cater to a small group of people in a specific field. The diversity among users of a general weather system will require a great deal of flexi-bility to accommodate the user's customization requests. Structured video can satisfy this need.
Second, while meteorological modeling and forecasting is an extremely complicated science, there are already a large number of systems that perform these functions. One such system is the "Weather" program used by the Earth, Atmospheric and Planetary Sciences Department at MIT. This program uses sophisticated models to predict weather patterns, but the resulting data is at best readable text and at worst, cryptic sequences of alphanumerics. The weather information system in this thesis transforms the data
gener-1.5 Thesis Overview
ated by the "Weather" program into a graphical representation. Weather data was selected for this thesis because of the existence
and widespread availability of systems like "Weather." By using another system to perform the complicated modeling, this thesis was free to focus on how data created by these systems could be visualized.
Finally, a weather system was selected because of the existence of video based weather visualization systems: television weather fore-casts. The current method of using video to visualize weather infor-mation provides a framework for creating similar visualizations using structured video, and for showing the advantages of struc-tured video over traditional frame based video representations.
1.5
Thesis Overview
This thesis examines the use of structured video as a form of data visualization. It shows how video sequences can be automatically generated to represent data provided by an information system, spe-cifically a weather information system. It also shows how the video stream produced by the system can be customized through user interaction.
Chapter 2 will describe the structured video decoder that this sys-tem uses. It begins with an explanation of the hardware and soft-ware of the Cheops Imaging System which is the platform of the decoder. It also addresses two scripting languages that have been developed as methods of describing how to composite video objects.
Chapter 3 details the implementation of the system. This chapter discusses how the system collects data, how users request informa-tion, how the system parses the data, how the system generates the
scripts, and how the user interacts with the system.
Chapter 4 describes the different kinds of video objects and how they are created.
Chapter 1 Introduction
Chapter 5 concludes with the results and evaluation of the system and ideas for future work.
Chapter 2
A Structured Video Decoder
The challenge of implementing a structured video decoder lies in the large variety of data representations that must be supported. For example, the types of video objects supported by the decoder should include, but not be limited to, arrays of pixels with constant depth (2-D), arrays of pixels with associated depth values (2
1/2-D), computer graphics objects (3-1/2-D), and layered objects with
asso-ciated intensity, velocity and opacity maps (2-D or 2 1/2-D). In addition, the decoder should be extensible enough to support new object representations as the need arises.
A generic structured video decoder must also support a large range
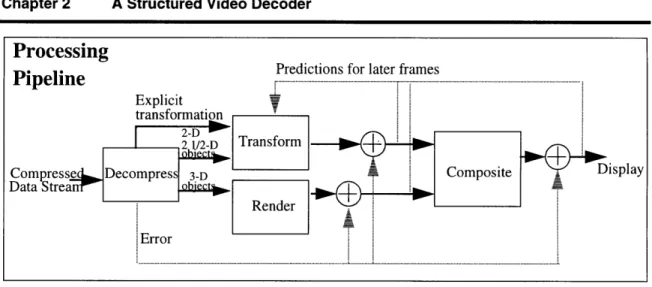
of instructions. For example, it must be able to function both as a three dimensional interactive graphics rendering system and as a standard hybrid decoder. Figure 2.1 shows a proposed pipeline for such a generic structured video decoder. [Bov94a] A more detailed explanation of these issues can be found in "Real-Time Decoding and Display of Structured Video" by Bove, Granger and Watling-ton. [Bov94a]
2.1
The Cheops Imaging System
One example of a structured video decoder has been implemented on the Cheops Imaging System. Cheops is a compact, modular plat-form for acquisition, processing, and display of digital video sequences and model-based representations of moving scenes [Bov93]. Cheops is both a prototype architecture for programmable video decoders and a tool for research which requires real-time video manipulation [Bov93, Bov91].
A Structured Video Decoder
Processing
Pipeline
Predictions for later frames- - - -...- - - -...Figure 2.1 Processing pipeline of a generic structured
video decoder.
Implementing a structured video decoder presents two main pro-cessing challenges. First, the decoder must be able to interpret a set of instructions and composite video objects as specified by those instructions in real time. In some cases, the decoder must also sup-port real-time interaction. Second, the decoder must be able to store the large quantity of video objects and retrieve them quickly enough for real-time display.
Cheops' design makes it ideally suited for acting as a structured video decoder. Cheops overcomes the challenge of compositing objects in real-time by implementing a set of basic, computationally intensive operations in specialized stream processors. These pro-cessors perform functions like convolution, correlation, matrix
algebra, block transforms, and spatial remapping. In addition, Cheops' modular design allows the machine to be reconfigured as technology or computational needs change. Finally, a general pur-pose processor in conjunction with a software resource manager
[She92] allows the system to execute stream operations in parallel whenever possible. These attributes enable Cheops to perform real time video processing that is currently impractical on general pur-pose computers. This ability is essential for a structured video decoder that has to interpret a set of instructions and composite
Display Chapter 2
2.2 The Isis Scripting Language
video objects in real time. In addition, this real time processing ability allows applications to provide user interaction options that are not feasible on other systems.
With regard to the problem of accessing large quantities of video objects, Cheops can easily store and manipulate the video objects required for the composited sequence because it can be configured to have up to 32 gigabytes of RAM. This, in conjunction with the high bandwidth Nile Buses provides Cheops the ability to store and retrieve the video objects in a timely fashion.
For information about the Cheops imaging system, see [Bov9 1], [Bov93a], and [Bov95].
2.2
The Isis Scripting Language
Isis is a platform independent scripting language which can be used for developing multi-media applications. It can be used either as a stand-alone programming environment or as an interface to C func-tions that perform a set of specialized operafunc-tions. [Aga95b] Two examples of specialized operation sets are the structured audio and video packages described in [Aga95c] and [Aga95d]. Isis can best be described as having three levels. The highest level is the plat-form independent Isis interpreter. The second level consists of the built in Isis functions implemented in the structured audio and video packages. Finally the packages rely on machine specific libraries to produce the video sequence for the platform being used. The two most noteworthy attributes of the implementation of Isis are that Isis data structures are based on arrays rather than linked lists and that the language core of Isis is small compared to other programming languages. The fact that it is based on arrays makes Isis an efficient scripting language for many structured video appli-cations. The small language core makes it easy to learn and use. This paper will not address the syntactical implementation of Isis except to say that it resembles the syntax of Scheme. Instead, it will
A Structured Video Decoder
focus on the functionality provided by Isis and how Isis is used to create the structured video application implemented in this thesis. Complete documentation of the Isis scripting language and its syn-tax can be found in [Aga95b], [Aga95c], and [Aga95d].
In general, Isis provides all of the basic functionality needed in any programming language including data types, variables, constants, lists, conditionals, expressions, and input/output operations. Three of the basic functions that were particularly useful in implementing this thesis were user-defined types, user-defined procedures and file loading operations. User defined types were useful because
weather-specific data types (like longitude and latitude pairs) could be defined. This made generating the scripts easier because the C code did not have to convert the data from a weather representation to an Isis representation. For example, a "LongLat" type and a pro-cedure that converts a "LongLat" from longitude and latitude to x, y pixel coordinates were implemented in Isis. Then, all the C code has to do is generate a script that loads that type and procedure; it does not have to know anything about the coordinate system that Isis uses. Thus, by being able to define types, write procedures and load files that contain these predefined types and procedures into the generated Isis scripts, the amount of work required to generate the scripts was significantly reduced.
In addition to the general functionality, Isis provides one particu-larly innovative data structure: the timeline data structure. A time-line structure is initially empty, but can have values at any real numbered time on the timeline. The values can be anything from boolean values to user-defined types and do not have to be uniform
throughout the timeline. This data structure was especially useful in implementing a weather system that deals with large sets of time series data. For example, a set of forecasted temperatures starting at the current time and extending for 57 hours at 3 hour intervals can easily be implemented as a timeline. It is important to note that timelines do not necessarily have to be correlated to physical time; they can be correlated to any ordered list of numbers.
2.2 The Isis Scripting Language
At the second level, the structured video package provides a frame-work for creating structured video applications. This package allows the manipulation of 6 kinds of entities: cameras,
environ-ments, actors, objects, windows, and engines. [Aga95c] The cam-era, in essence, is the viewer. The camera information specifies
where the viewer is in relation to the scene being displayed. In the weather system, this information controls what part of the map is visible in the window and at what scale the map is drawn. The
envi-ronment provides information about how the viewer perceives the
scene being displayed. Lighting information is one example of information that would be stored in the environment. Again, none of this information was needed for the weather information system.
The actors are the things in the production. For the weather system
implemented in this thesis, each datum for each city is represented
by an actor. Actors can be positioned and transformed in variety of
ways including translation, rotation, warping, and scaling. Each
actor must be associated with an object which is a graphics data
file. An object can be used by multiple actors simultaneously, but
an actor can only be associated with one object at a time.
The window describes how the scene will be translated to the win-dow on the display. The winwin-dow information includes winwin-dow size and position which, in the weather system, is provided by the user (see Section 3.2.1). Finally, the engine is the entity that performs all of processing and compositing. An engine refers to a camera, a
window, an environment, and a set of actors. An application can
have multiple engines which offers the capacity to control several presentations at once.
The weather system implemented in this thesis is the largest struc-tured video application implemented in Isis to date. Two other structured video productions, "The Museum Movie" and "Yellow Wallpaper" have been implemented in Isis. Each of those applica-tions uses a maximum of 25 actors. The weather system uses a min-imum of 128 actors and can easily exceed 1000 actors. In addition,
the Isis scripts created by the weather system can be as large as
25,000 lines of code, much larger than the Isis files for either of the
other two applications. This application establishes Isis' robustness as a scripting language that can define a variety of structured video applications.
Chapter 3
Implementation
The implementation of the weather system described in this thesis can be divided into four steps. The first step is to download weather data from a weather database. The second step is to provide a mech-anism for requesting information. The third step is to parse the weather data files and extract the relevant information. The final step is to generate Isis scripts describing how to composite the video objects in relation to the data. The Isis scripts can then be executed on a structured video decoder where the compositing, dis-play and interaction takes place. The next sections of this chapter will describe each of these steps in detail.
The current implementation of the system is limited to 8 states: Colorado, Connecticut, Maine, Massachusetts, Minnesota, New Hampshire, Rhode Island, and Vermont. This is not a factor of the availability of data, but instead a factor of the number of video objects required to support all 50 states. However, the organization of the system is versatile enough to add more states should the need arise (See Section 3.6).
3.1
Collecting Weather Data
There are many sources of weather data available to the general public in a large variety of formats including text and hypertext, audio, and video. In video format, there are weather forecasts on every major television network and an entire cable television chan-nel devoted to presenting weather information. In addition, the audio portion of a televised weather forecast can often stand alone as an audio presentation of weather information. Other audio
pre-Chapter 3 Implementation
sentations include telephone numbers providing recorded informa-tion and radio stainforma-tion forecasts. Radio is such a popular medium for distributing weather information that manufacturers build radios that only tune to the weather station. In written format, weather data is available in every newspaper, and with the growth of the World Wide Web, there are literally hundreds of weather information sites on line.
Despite the proliferation of weather information, on closer exami-nation, the data set is actually quite small; the same information is being presented in many different ways. Most weather data origi-nates from the National Weather Service (NWS). The National Weather Service collects weather observations from around the world, and then generates a variety of forecasts using different models. The results of the models are then passed to vendors who package the data and distribute it. The large number of vendors accounts for the enormous variation in presentation and format.
3.1.1
Data Set
The weather system implemented in this thesis only uses a small subset of the information available for two reasons. First, the sheer quantity of information available would be too much to parse. Sec-ond, there is so much overlap of information in the various formats that parsing more data does not necessarily add information to the system. The data files come from MIT's Department of Earth, Atmospheric and Planetary Sciences (EAPS) "Weather" program. "Weather" provides access to EAPS' extensive database of United States weather data. Of all the data available from the "Weather" database, three data sets are used for each city. These data sets were selected for their regularity of format, which aids in parsing, and for their combined quantity of information with as little overlap as pos-sible.
3.1 Collecting Weather Data
3.1.1.1 Surface Observations
The first of the three sets of data is the surface observation data (sa) which provides information about observed cloud cover and weather type, temperature in degrees Fahrenheit, dewpoint in degrees Fahrenheit, humidity by percentage, wind direction in degrees, wind speed in miles per hour, gust speed in miles per hour, pressure in millibars, altimeter in inches of mercury and visibility in miles at hourly intervals. The surface observations are provided in the textual format shown in Figure 3.1
weather -c safulldecode BOS 1
The weather observed at BOSTON (BOS) at 03:50 PM EDT was: The skies were thinly scattered with clouds.
Temperature: 57F (14C) Dewpoint: 27F (-3C) Relative Humidity: 31% Winds from the NW (310 degs) at 18 mph gusting to 24 mph.
Pressure: 1023.7 millibars. Altimeter:30.23 inches of mercury. Visibility: 20.0 miles.
Figure 3.1 An example surface observation data file.
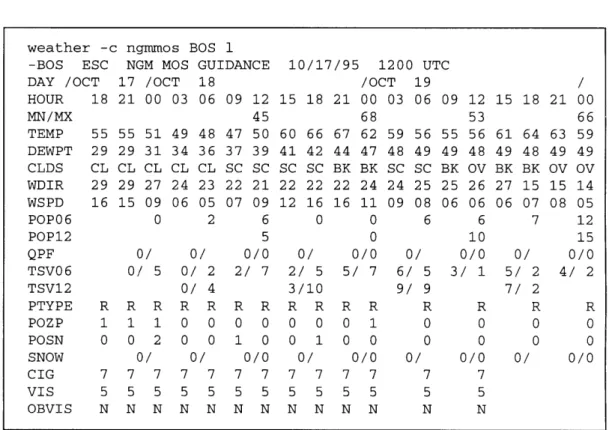
3.1.1.2 Nested Grid Model
The second data set is the Nested Grid Model (ngmmos). This data file provides forecast information that is created by a combination of interpolation and regression estimation. Nested Grid refers to the method used for interpolating values between observed weather data points. MOS stands for Model Output Statistics and refers to a regression estimation technique based on past weather develop-ments. [Par88] This data provides forecast information about mini-mum and maximini-mum temperature in degrees Fahrenheit,
temperature in degrees Fahrenheit, dewpoint in degrees Fahrenheit, cloud cover, wind direction in tens of degrees, wind speed in miles per hour, probability of precipitation for 6 and 12 hour periods by percentage, precipitation type, and snowfall at three hour intervals for 54 hours. An example nested grid model data file is shown in Figure 3.2.
Chapter 3 Implementation
weather -c ngmmos BOS 1 -BOS ESC NGM MOS GUIDANCE
DAY /OCT 17 /OCT 18 HOUR 18 21 00 03 06 MN/MX TEMP DEWPT CLDS WDIR WSPD POPO6 POP12 QPF TSVO6 TSV12 PTYPE POZP POSN SNOW CIG VIS OBVIS 0/ 0/ 0/ 5 0/ 0/ R R R 1 1 0 0 2 0 0/ 7 7 5 5 N N 0/ 7 7 5 5 N N 09 12 45 47 50 37 39 SC SC 22 21 07 09 6 5 0/0 2/ 7 R R 0 0 1 0 0/0 7 7 5 5 N N 10/17/95 1200 UTC /OCT 19 15 18 21 00 03 06 0/ 2/ 5 3/10 R R 0 0 0 1 0/ 7 7 5 5 N N 68 57 62 14 47 3K BK 2 24 .6 11 0 0 0/0 5/ 7 R R 0 1 0 0 0/0 7 7 5 5 N N 0/ 6/ 5 9/ 9 09 12 53 55 56 49 48 BK OV 25 26 06 06 6 10 0/0 3/ 1 R R 0 0 0 0 0/ 0/0 7 7 5 5 N N 15 18 21 00 66 61 64 63 59 49 48 49 49 BK BK OV OV 27 15 15 14 06 07 08 05 7 12 15 0/ 0/0 5/ 2 4/ 2 7/ 2 R R 0 0 0 0 0/ 0/0
Figure 3.2 An example nested grid model data file.
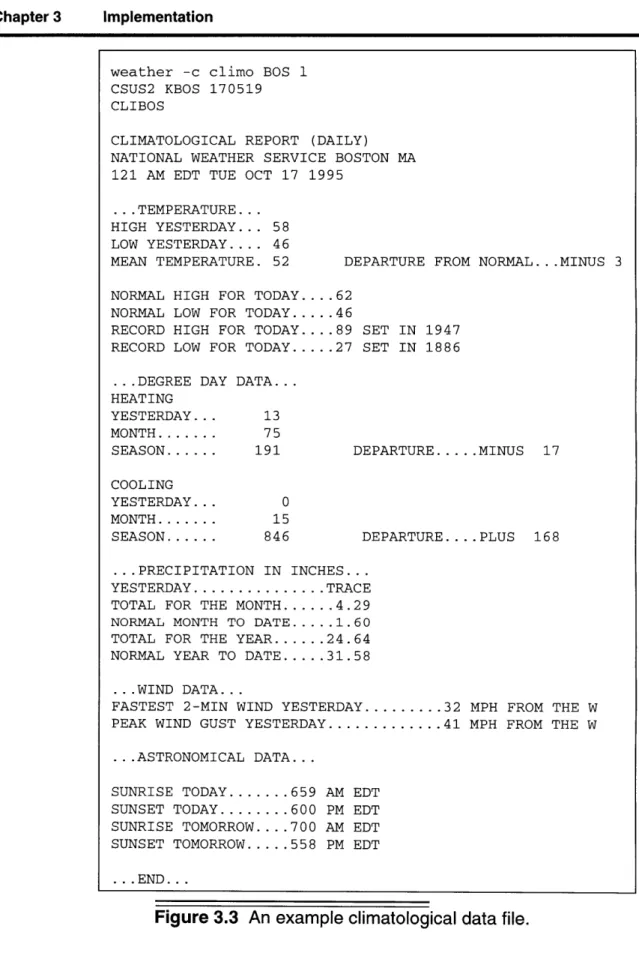
3.1.1.3 Climatological Report
The third data set is the climatological report (climo) which is cre-ated once per day. Climatological data files are usually only avail-able for large cities, and their format is not as standardized as the formats of the other two files. The climatological report provides information about the previous day's minimum and maximum tem-peratures in degrees Fahrenheit, and the mean temperature and departure from the normal mean temperature in degrees Fahrenheit. It also provides the current day's normal high and low temperatures in degrees Fahrenheit, record high and low temperatures in degrees Fahrenheit, and the years those records were set. The climatological data includes heating and cooling information for the previous day, month and season in degrees Fahrenheit, and the precipitation for the previous day, month and year, as well as the normal precipita-tion amounts for the month and year in inches. In months when
3.1 Collecting Weather Data
snow occurs, this file also provides snowfall information for the previous day, month and season in inches. Information about the previous day's fastest two minute wind and peak gust in miles per hour as well as the sunrise and sunset times for the current day and the next day can also be found in this file. See the example climato-logical data file in Figure 3.3.
3.1.2
Data Retrieval
The weather information system implemented in the thesis requires access to each of the three data files described in Section 3.1.1 for each city in the system. As mentioned at the beginning of Chapter
3, only the New England states, Colorado, and Minnesota have
cur-rently been implemented. However, these 8 states have 94 cities with National Weather Service stations. Thus the system needs access to 282 data files. In order to parse the data, the data files need to be locally accessible to the weather system. A perl script is used to download the most recent data files from the EAPS data-base to a local data directory.
The script named "weatherfiles.pl" was written in perl which is "a language for easily manipulating text, files, and processes."
[Wal91] "Weatherfiles.pl" must be executed inside a directory named "Data" which has the subdirectory structure shown in Figure 3.4. The first level of subdirectories under the "Data" directory are named after the two letter abbreviations of the implemented states. Within each state's directory, there is a subdirectory for each city in that state with a National Weather Service station. These city direc-tories are named after the three character NWS station codes. Within each city directory there are three data files named "sa," "climo," and "ngmmos" as described in Section 3.1.1. "Weather-files.pl" traverses the directory structure of "Data" to compile a list of NWS station codes for which information is requested. It also relies on this directory structure to know where to put the data files as they are being created.
Implementation
weather -c climo BOS 1
CSUS2 KBOS 170519
CLIBOS
CLIMATOLOGICAL REPORT (DAILY) NATIONAL WEATHER SERVICE BOSTON MA 121 AM EDT TUE OCT 17 1995
...TEMPERATURE... HIGH YESTERDAY... 58 LOW YESTERDAY.... 46
MEAN TEMPERATURE. 52 DEPARTURE FROM NORMAL.. .MINUS 3
NORMAL HIGH FOR TODAY.... 62 NORMAL LOW FOR TODAY...46
RECORD HIGH FOR TODAY.... 89 SET IN 1947 RECORD LOW FOR TODAY...27 SET IN 1886
...DEGREE DAY DATA... HEATING YESTERDAY... 13 MONTH... 75 SEASON... 191 COOLING YESTERDAY... MONTH... SEASON... 15 846 DEPARTURE...MINUS 17 DEPARTURE.... PLUS 168 ... PRECIPITATION IN INCHES... YESTERDAY...TRACE
TOTAL FOR THE MONTH...4.29 NORMAL MONTH TO DATE...1.60 TOTAL FOR THE YEAR...24.64 NORMAL YEAR TO DATE...31.58
...WIND DATA...
FASTEST 2-MIN WIND YESTERDAY...32 MPH FROM THE W
PEAK WIND GUST YESTERDAY...41 MPH FROM THE W ...ASTRONOMICAL DATA...
SUNRISE TODAY...659 AM EDT
SUNSET TODAY...600 PM EDT
SUNRISE TOMORROW.... 700 AM EDT
SUNSET TOMORROW...558 PM EDT ...END...
Figure 3.3 An example climatological data file.
3.1 Collecting Weather Data
sa climo ngmmos
Figure 3.4 Diagram of Data directory tree structure.
After logging into the EAPS computer, "weatherfiles.pl" sends commands of the syntax "weather -c safulldecode BOS 1" to the
EAPS server. "Weather" is the name of the EAPS program that
pro-vides access to the weather database in either interactive or com-mand line modes. The "-c" comcom-mand line option specifies which type of data to retrieve (in this case, surface observations; the other two data files are created using "-c ngmmos" and "-c climo"). The next three letters are the National Weather Service code for the city (in this case, Boston). Finally, the "1" asks for the last or most recent data set. The script then takes the text returned by these com-mands and writes them to the appropriate local file as determined
by the directory structure described above (in this case, Data/MA/
BOS/sa). Once all 292 commands have been executed (one for each data file) the necessary weather files are locally accessible to the weather system.
While "weatherfiles.pl" does serve its purpose, it does not necessar-ily do it in the most efficient fashion. The drawback of this imple-mentation is that it takes approximately two hours to download all of the data files. This is caused by two problems. First, the EAPS computers are exceptionally slow; this problem cannot be fixed within the scope of this thesis. The second problem is that not each
Chapter 3 Implementation
of the three data files is available for every city in the system. When the EAPS "weather" program is asked for information that does not exist, it spends a lot of time searching for the information before returning. The script execution time could be reduced by creating a more sophisticated perl script that determines when the EAPS com-puter is taking too long to respond, and then kills that command and moves to the next one. This is one suggestion for future enhance-ments to the system.
3.2
Requesting Information
One function of any information system is to provide a method of requesting a data set. In a weather application, users need the ability to request information for cities or regions of interest. In current weather applications data is selected in a variety of fashions rang-ing from simple text based interfaces where the user enters the National Weather Service code for each city (for example, the weather program on Athena), to more sophisticated graphical inter-faces where the user can click on a map to select a city (for exam-ple, the University of Michigan Interactive Weather Browser at http://rs560.cl.msu.edu/weather/graphicalinteractive.html). Regard-less of how sophisticated the interface is, all weather systems pro-vide the same functionality: allowing the user to select a data set to view.
3.2.1
Request Files
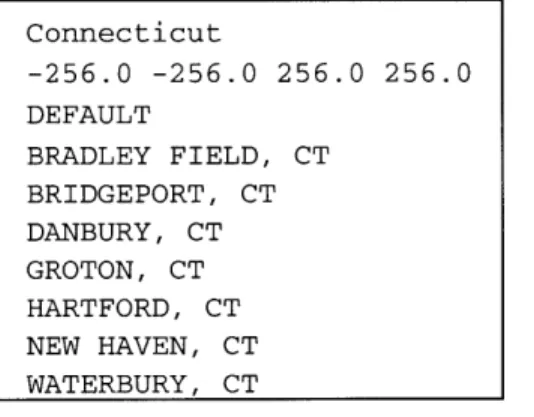
The mechanism for requesting information about cities in the weather system implemented in this thesis is to create a request file. Request files must be in the format shown in Figure 3.5. The first line of the request file is the name of the Isis script file to be gener-ated. The second line must have four real numbers separated by spaces. These numbers represent the coordinates of the lower left corner and upper right corner of the display window. The third line indicates the display mode and can currently be one of two values,
3.2 Requesting Information
The display mode information affects the placement of the display window on the screen. DEFAULT centers the display window on a high resolution monitor, while VGA centers the window for display on an NTSC device, such as a television monitor, or projection screen. In general, the DEFAULT setting should be used. The VGA option was implemented in order to facilitate demonstrating the system at the Media Lab. Finally, the request file contains a list of cities (listed as CITY, STATE in capital letters) for which informa-tion is desired. Connecticut -256.0 -256.0 256.0 256.0 DEFAULT BRADLEY FIELD, CT BRIDGEPORT, CT DANBURY, CT GROTON, CT HARTFORD, CT NEW HAVEN, CT WATERBURY, CT
Figure 3.5 An example request file.
3.2.2
Region Request Files
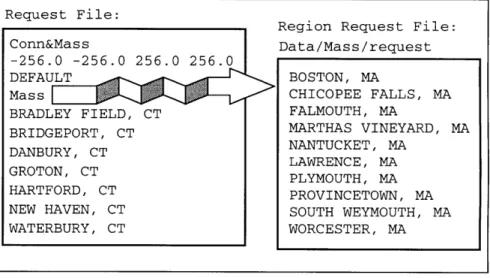
One interesting ability of the weather information system imple-mented in this thesis is that users can define regions. A region is a named list of cities. When a region name is included in the list of cities in a request file, as in Figure 3.6, the program first looks for the region name in the list of cities it knows about. If the region name is not found in that list, the program looks for a file named
"Data/regionname/request," where regionname is the name of the
region as typed in the request file. If a file by that name exists, the list of cities inside the file "Data/regionname/request" is substituted into the list of cities in the request file. Note that region request files are different from standard request files in two ways. First, there is no header information in a region request file; it simply contains a list of cities or regions. Second, the name of the region must be a
Chapter 3 Implementation
subdirectory of the "Data" directory, and the region request file must be in that subdirectory. If no request file is found under these circumstances, the systems treats the name as an invalid request and will print a message that there is no data available for that city.
Request File:
Requst Fle:Region Request File:
Conn&Mass Data/Mass/request
-256.0 -256.0 256.0 256.0
DEFAULT BOSTON, MA
Mass CHICOPEE FALLS, MA
BRADLEY FIELD, CT FALMOUTH, MA
BRIDEPOR, CTMARTHAS VINEYARD, MA
BRIDGEPORT, CT
DANBURY, CT NANTUCKET, MA
GROTON, GROTO, CTMACTPLYMOUTH, MA
HARTFORD, CT PROVINCETOWN, MA
NEW HAVEN, CT SOUTH WEYMOUTH, MA
WATERBURY, CT WORCESTER, MA
Figure 3.6 The name Mass is expanded to be the list of
cit-ies included in the region request file Data/Mass/request.
The limitation of this implementation is that it creates errors when "16weatherfiles.pl" is executed. Because states and regions are both implemented as subdirectories of the "Data" directory, "weather-files.pl" assumes that the region name is a state, and that "request" is the NWS code for a city. Of course, when the command is passed to the EAPS "weather" program asking for information about the city "request" "weather" returns errors. Likewise, when "weather-files.pl" tries to write the empty data files in the subdirectory
'(request," the script generates errors because "request" is not a directory. While these errors may be bothersome, they do not impair the function of "weatherfiles.pl." The errors could be elimi-nated by making "weatherfiles.pl" more intelligently traverse the tree structure of the "Data" directory by looking only for three char-acter NWS codes. In that implementation, "weatherfiles.pl" would know that a region request file is not a city and would not try to request that information.
3.3 Parsing the Weather Data
3.3
Parsing the Weather Data
Once the weather data files are downloaded, and the request file has been created, the next step is to parse the data for the requested cit-ies into a format that will facilitate the association of data with video objects. The parsing routines for the weather system imple-mented in this thesis were written in the C programming language. Each data file is parsed by a separate function and these functions can be found in files named "sa.c," "ngmmos.c," and "climo.c." This modular design facilitates extending the system to parse more data files should the need arise.
Each of the three parsing functions uses a different parsing tech-nique based on the structure of the data file. For example, because the nested grid model data file is in a tabular format, the lines are all processed simultaneously and each consecutive number is read off and placed in the appropriate C structure. On the other hand, because the surface observation data file is in more of an english format, "sa.c" searches for key words and then reads the number associated with that key word. Climatological information is the most difficult to parse because there is no standard format for cli-matological data files. "Climo.c" was written by examining a large data set of climatological data files and determining what format they had in common. The parsing routine was then based on that intersection of formats. This has two repercussions. First, climato-logical data files often have more information than "climo.c" is able to parse because "climo.c" is limited to parsing information com-mon to all climatological data files. Second, some climatological data file formats are so different from the other formats that they have to be discarded all together. When this happens, the system will print the message "Nonstandard file format command" where
command is the command sent to the EAPS server that created the
nonstandard data file. Finally, not all cities have all three types of data. When data does not exist, the data file will be empty and the
Chapter 3 Implementation
system will print the message "Empty file filename" where
file-name is the file-name of the empty file.
3.4
Creating the Isis Scripts
Once the data has been parsed, the weather system can use that information to create Isis scripts that will describe how to compos-ite video objects to represent the data. The functions that create the scripts were also written in the C programming language and can be found in the file "script.c."
"Script.c" creates three different kinds of Isis files, each of which is created by a separate function. The three files and their creation are described below.
3.4.1
City Isis Files
The function in "script.c" named "CityScript" creates an Isis file for each city for which data has been requested. Each city script is named after the three character National Weather Service code for that city with the extension ".isis." For example, assuming the information system is given the request file shown in Figure 3.5, "CityScript" would create the following files:
* BDL.isis - BDR.isis - DXR.isis - GON.isis e HFD.isis HVN.isis OXC.isis
The first line in the city Isis file indicates the longitude and latitude of the city. As shown in Appendix B, a set of standard weather Isis functions have been defined, one of which converts longitude and latitude to screen coordinates based on the range of longitudes and
3.4 Creating the Isis Scripts
latitudes being displayed. Next, the city Isis script sets up one actor per set of information (i.e. temperature, dewpoint, wind speed,
wind direction, etc.). Then, using the Isis timeline structure, the script defines what the value of each data set is for all the given times. If there is no value for a particular data set a a particular time, the value is set to a dummy value and the visibility is set to false. In general, each city Isis file sets up 120 actors and is approx-imately 450 lines of Isis code. An example city Isis file is shown in Appendix B.
3.4.2
Data Isis Files
There is only one data Isis file created for each script generated by the weather system and it is created by the function "AllCitiesS-cript." The data Isis file is named after the script with the extension "data.isis" appended. For example, given the request file in Figure
3.5, the data Isis file would be named "Connecticutdata.isis." The
first function of the data Isis file is to load each of the city Isis files. The only other function of the data Isis file is to set up the timeline structure that is used for the data knob during display. As the user turns the data knob, a different piece of information is being dis-played for each city (i.e. temperature, dewpoint, wind direction, etc.). This is accomplished by setting up a timeline that determines which actors should be displayed at each value of the data knob. For example, when the value of the data knob is 0, the system dis-plays the cloud cover symbols for each city. Because there is one actor for each city's cloud symbol, the value of the data knob time-line at 0 is the list of all of the city's cloud symbol actors. Because there are 38 different pieces of information contained in the system, the data knob timeline has 38 entries, each of which is a list of actors. Obviously, the size of the data Isis file depends on the num-ber of cities requested; the more cities, the larger the file. The data file for a script that implements all of the cities in New England is
Chapter 3 Implementation
3.4.3
Map Isis Files
The function "MapsScript" creates the map Isis file for each script created by the weather system. The map Isis file is named after the
script with the extension "map.isis" appended. For example, given the request file in Figure 3.5, the map Isis file would be named
"Connecticutmap.isis." In creating the map Isis file, the weather system loops through each of the requested cities and determines a list of state maps that are needed. For the request file in Figure 3.5, only the Connecticut maps are needed, but for the request file in Figure 3.6, both the Connecticut and Massachusetts maps are needed. The map Isis file loads the necessary state map graphics objects. There are at least five maps per state as described Figure
4.1. After loading the maps, the map Isis file sets up actors for each
state map and places them at their proper positions according to the longitude and latitude of the center of the state and the longitude and latitude range of the entire area being displayed. Again, the size of the map Isis file depends on the number of state maps needed, but the map Isis file for all of New England is 450 lines.
3.4.4
Main Isis Files
The script that ties everything together is the main Isis file. This file is created by the function "Script" in "script.c." It is named after the script with the extension ".isis" appended. For example, given the request file in Figure 3.5, the main Isis file would be named "Con-necticut.isis."
The main Isis file begins by loading the standard weather Isis defi-nitions. Then it initializes the system. These commands are the same for every main Isis script file created by the weather system. The main Isis file then defines the scale information that allows the structured video decoder to map longitude and latitude to screen coordinates. This includes setting the position of the display win-dow as defined by the DEFAULT and VGA settings discussed in Section 3.2.1. This file also loads the other Isis files and sets up the
3.5 Using the Weather System
list of actors. These commands depend on information gathered during the parsing step.
Another important function of the main Isis script is that it defines the user interaction with the system. The main Isis file loads the standard weather knob Isis files that set up each of the 8 knobs as
follows:
- Knob 1: Controls horizontal position - Knob 2: Controls vertical position - Knob 3: Controls the scale
- Knob 4: Changes the map
- Knob 5: Moves through the data sets - Knob 6: Moves through the time - Knob 7: Dummy knob
- Knob 8: Exits
The main loop of the main Isis file then reads the input from the knobs and adapts the display accordingly. The average size of a main Isis file is 350 lines. The equation shown in Figure 3.7 shows why automating the generation of these scripts is a necessity for this type of system.
53 cities * 450 lines + 650 lines + 450 lines + 350 lines = 25,300 lines
city data map main script
file file file file
Figure 3.7 Lines of Isis code required to implement a script
for all of New England.
3.5
Using the Weather System
The previous sections describe the logical steps in implementing the weather system, but they do not discuss how these steps work together. When the system is executed, the four steps described above are actually reduced to three steps. The first steps are the
Chapter 3 Implementation
same: the files are downloaded using the "weatherfiles.pl" script and a request file is generated. However, because the generated scripts depend heavily upon the parsed information, these two steps are tied together in the C program "makeweather" described below.
3.5.1
Makeweather
"Makeweather" is a simple program that takes two arguments: a request file, and a directory to write the scripts to. It must be exe-cuted in the directory that contains the "Data" directory.
"Makeweather" first sets up the database of implemented cities which includes information about the longitude and latitude of each city and the city's NWS code. It then sets up a database of imple-mented states that includes information about the longitude and lat-itude ranges of the states. These structures provide the necessary information that cannot be obtained from parsing the weather data files.
"Makeweather" then parses the request file specified by the first command line argument and creates a linked list of cites for which information is desired. Then, for each of these cities,
"makeweather" reads the three data files and calls each of the three parsing routines described in Section 3.3. Finally, "makeweather" calls each of the script generating functions described in Section
3.4. The scripts are written in the directory specified by the second command line argument.
One limitation of "makeweather" is that it only runs on DECsta-tions as opposed to DEC 3000/AlphaStaDECsta-tions. Unsuccessful
attempts were made to compile the code on a Dec Alpha. This pre-sents a problem when attempting to combine the script generation and script execution into one step because the script generation only works on DECstations while Isis only runs on Dec Alphas.
3.5 Using the Weather System
3.5.2
Weather: A Graphical Interface
Although the weather information system can be executed by run-ning all of these scripts and programs individually, it would be
much easier, and much more appealing if the system had a nice, simple graphical interface that tied everything together in one step. An interface was developed that allows a user to perform all of the necessary tasks, creating request files, downloading data files, and
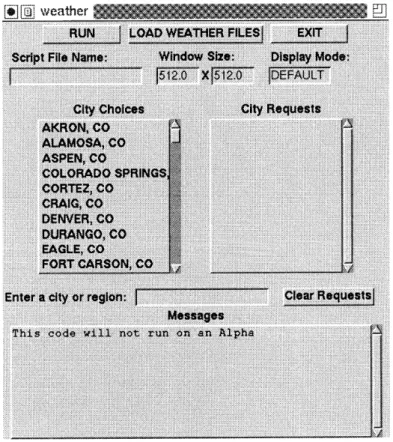
generating the scripts. The interface shown in Figure 3.8 was implemented in Tcl/Tk which is "a programming system for
devel-oping and using graphical user interface applications." [Ous94] It is executed by typing "weather" in a directory that has a copy of the executable, and that has subdirectories named "Scripts" and
"Data." The Data directory must contain the directory tree structure described in Section 3.3.
[§]L_1
weatherRUN LOAD WEATHER FILES| EXIT
Script File Name: Window Size: Display Mode:
5 2 0 X 512O DEFAULT
City Choices City Requests AKRON, CO ALAMOSA, CO ASPEN, CO COLORADO SPRINGS CORTEZ, CO CRAIG, CO DENVER, CO DURANGO, CO EAGLE, CO FORT CARSON, CO /
Enter a city or region: |-Clear Requests
Messages
This code will not run on an Alpha