HAL Id: inserm-00871593
https://www.hal.inserm.fr/inserm-00871593
Submitted on 9 Oct 2013
HAL is a multi-disciplinary open access
archive for the deposit and dissemination of
sci-entific research documents, whether they are
pub-lished or not. The documents may come from
teaching and research institutions in France or
abroad, or from public or private research centers.
L’archive ouverte pluridisciplinaire HAL, est
destinée au dépôt et à la diffusion de documents
scientifiques de niveau recherche, publiés ou non,
émanant des établissements d’enseignement et de
recherche français ou étrangers, des laboratoires
publics ou privés.
in super wideband listening quality assessment models
Sibiri Tiemounou, Régine Le Bouquin Jeannès, Vincent Barriac
To cite this version:
Sibiri Tiemounou, Régine Le Bouquin Jeannès, Vincent Barriac. On the identification of relevant
degradation indicators in super wideband listening quality assessment models. Speech
Communica-tion, Elsevier : North-Holland, 2013, 55 (10), pp.1047-1063. �10.1016/j.specom.2013.06.010�.
�inserm-00871593�
Abstract— Recently, new objective speech quality evaluation methods, designed and adapted to new high voice quality contexts, have
been developed. One interest of these methods is that they integrate voice quality perceptual dimensions reflecting the effects of frequency-response distortions, discontinuities, noise and/or speech level deviations respectively. This makes it possible to use these methods also to provide diagnostic information about specific aspects of the transmission systems' quality, as perceived by end-users. In this paper, we present and analyze in depth two of these approaches namely POLQA (Perceived Objective Listening Quality Assessment) and DIAL (Diagnostic Instrumental Assessment of Listening quality), in terms of quality degradation indicators related to the perceptual dimensions these models could embed. The main goal of our work is to find and propose the most robust quality degradation indicators to reliably characterize the impact of degradations relative to the perceptual dimensions described above and to identify the underlying technical causes in super wideband telephone communications [50, 14 000] Hz. To do so, the first step of our study was to identify in both models the correspondence between perceptual dimensions and quality degradation indicators. Such indicators could be either present in the model itself or derived from our own investigation of the model. In a second step, we analyzed the performance and robustness of the identified quality degradation indicators on speech samples only impaired by one degradation (representative of one perceptual dimension) at a time. This study highlighted the reliability of some of the quality degradation indicators embedded in the two models under study and stood for a first step in the evaluation of performance of these indicators to quantify the degradation for which they were designed.
Index Terms— Perceptual dimensions, super wideband, voice quality assessment, objective models, diagnostic
1. Introduction
Withthe introduction of transport of information on packet networks, the old bandwidth limitations of TDM (Time Division Multiplexing) networks have vanished. In particular, the coding of audio signals is no longer restricted to PCM (Pulse Code Modulation) frames coded at 8 kHz. Thus, new audio contents, without theoretical constraint on their temporal and spectral characteristics, can be carried onto telecommunication networks, opening the door to new services and new customer experience. Amongst these services, high quality telephony is promised to a fruitful future. Nowadays, Wideband (WB) (i.e. [50–7000] Hz) telephony, also known as HD (High Definition) Voice [1], is more and more common, and there are even some soft-telephony solutions allowing a so-called super wideband (SWB) telephony, corresponding to frequencies up to 14 kHz (i.e. [50-14000] Hz) and a sampling rate at 32 kHz or beyond.
The user experience of such services completely differs from what we have been facing until now. For instance, rich musical contents, or unfiltered environmental noise, can be carried together with or without voice. Some audible defects in the audio signal, particularly present in the higher frequencies, become annoying in SWB context whereas they are attenuated and hardly
On the identification of relevant degradation indicators in
super wideband listening quality assessment models
Sibiri Tiemounou
1,2,3, Régine Le Bouquin Jeannès
2,3, Vincent Barriac
11
Orange Labs - Lannion, 2 Av. Pierre Marzin, 22307 Lannion Cedex, France
2
INSERM, U 1099, Rennes, F-35000 France
3
Université de Rennes 1, LTSI, Rennes, F-35000, France
perceptible in Narrowband (NB) context (i.e. [300-3400] Hz). This explains why the current knowledge on quality expectations and perception has to be revisited.
Besides, the complexity of transmission and signal processing scenarios makes it harder and harder to troubleshoot end-to-end quality problems. New diagnosis tools are therefore needed by operational teams to help them in targeting the sources of degradations.
To achieve these two goals, the development of new tests and measurement methods (or the update of existing ones) is required. As far as voice quality measurement is concerned, the well-known PESQ (Perceptual Evaluation of Speech Quality, ITU-T Recommendation P.862 [2]) listening quality model, for instance, predicts MOS (Mean Opinion Score) values with a high correlation with auditory tests results (also known as subjective tests [3]) in Narrowband audio telephony context, but such a method presents several drawbacks. It is not able to cope with SWB telephony (and its Wideband extension called WB-PESQ [4] presents some limitations [5, 6] ), and it does not provide further diagnostic information about specific aspects of the transmission systems' quality, as indicated for instance in [5]. To overcome these obstacles, ITU-T study Group 12 decided to develop a new method (project named POLQA), adapted to the new audio contents (e.g. including super wideband audio contents) and potentially integrating, beside global quality scores, estimators of speech quality features grouped in what we call hereafter "perceptual dimensions" (because of their similar impact on speech quality as perceived by human ear).
With regard to voice quality perception, a distinction between three types of perceptual dimension, associated with corresponding degradations (proven to be orthogonal) has been already proposed in [7]. The first dimension, called "Directness/Frequency Content" [8], or "Coloration" [9], is related to frequency-response degradations. Results obtained by Leman et al. [10] in Narrowband telephony context revealed that the "Coloration" dimension is mostly linked to coding. Consequently, with a view to diagnosis and to deal with all possible degradations, coding was included in this dimension.
The "Continuity" dimension corresponds to degradations in the time domain, such as loss of signal, clipping, and sudden level variations. Finally, "Noisiness" is linked to perceived noise degradations. The existence of a fourth perceptual dimension reflecting the impact of the speech level, (called "Loudness") has been recognized in [11]. These four perceptual dimensions are assumed to cover the whole speech quality space including modern telecommunication networks and services.
To estimate quality degradation on these dimensions in the new telephony context and troubleshoot problems, Quality Degradation Indicators (QDIs) must be developed. These indicators are designed to quantify the underlying technical causes for a specific degradation perceived on speech quality. Instead of building them from scratch, we found it wiser to look first at those already developed, and then built new ones only if the study of existing ones concluded that they could not be used as reliable and robust diagnostic tools. When looking at the state-of-the-art, it became quickly obvious that the best place to dig out such indicators was inside signal-based voice quality models. When we started our study, ITU-T was just ending the POLQA (Perceived Objective Listening Quality Assessment) project launched in 2007, aiming at standardizing a new objective perceptual speech quality evaluation model to overcome PESQ, with a broader scope (in particular SWB speech). One of the 6 candidate models called DIAL (Diagnostic Instrumental Assessment of Listening quality) [12] has been developed jointly by FT (France Telecom) and DT (Deutsche Telekom). DIAL was explicitly built on the 4 perceptual degradation dimensions mentioned above and provided a global predicted MOS-LQOsw (MOS-Listening Quality Objective in super wideband context) value, together with 4 additional MOS values for each perceptual dimension respectively.
Once the essential parts of the code of the winner of the POLQA competition (now standardized as ITU-T P.863 Recommendation [13], and simply called POLQA in what follows), had been made public, we included it also in our study. Note that, since there is not a directly compilable version of POLQA available, we had to implement the missing blocks and build an executable version. In this latter case, the perceptual dimensions were implicitly integrated in the model.
The goal of our study was to find and propose QDIs in order to quantify the impact of the degradations on the four dimensions exposed above as well as to identify the underlying technical causes in super wideband context. Such indicators are potentially, but not necessarily, extracted from the two models introduced above. However, in this paper, we only present and analyze indicators found in the codes of DIAL and POLQA. It is important to underline that we considered these two objective models in our study for two reasons: (1) they stand for the first objective models to characterize the voice quality impairments in super wideband context whose codes were available and (2) they explicitly or implicitly integrate the four perceptual dimensions described above. Other objective models explicitly based on the 3 perceptual dimensions ("Directness/Frequency Content", "Continuity" and "Noisiness") were proposed in [9, 10] but these models were limited to Narrowband context. Note that our work did not intend to compare these two models from the point of view of their performance to predict the speech quality, but was rather to select the most relevant QDIs that are robust enough to quantify specific degradations for advanced diagnosis of modern telecommunication systems in super wideband context. We proposed to assess these QDIs under conditions where only one degradation is present, what naturally limits their use for a certain type of quality diagnostic applications, e.g., for intrusive network interface to network interface test where only the "Continuity" dimension is impacted. This study stood for a first step in the evaluation of performance of these QDIs in terms of reliability to quantify the degradation for which they are designed. Investigating these standalone degradations before studying more deeply conditions characterized by the presence of multiple degradations seemed essential. As a matter of fact, if a QDI fails in diagnosing the degradation for which it has been designed, testing it in multiple degradations conditions becomes useless.
This paper is organized as follows: Section 2 presents briefly the two models we selected to derive our QDIs. Section 3 is devoted to the comparison of these models from the point of view of the perceptual dimensions, including a description of the QDIs we found or built from the models. After a presentation in Section 4 of the methods and materials used to assess the performance of these QDIs, we analyze in Section 5 their relevance to quantify and diagnose degradations for which they were designed, with a particular focus on indicators referring to the "Continuity" dimension.
2. Presentation of the selected models
Both POLQA and DIAL models compare a reference signal X k
( )
with a degraded signal Y k( )
, where Y k( )
is the result of passing X k( )
through a communication system, providing a global MOS-LQO (i.e. an Objective MOS in Listening Quality context) quality score for Y k( )
, predicting the mean opinion of end users about the audio quality of the signal they perceive when using this communication system. Unlike POLQA, beside a global MOS-LQO, DIAL provides 4 additional MOS values for each perceptual dimension respectively. Furthermore, both models exist in two operational modes, one dedicated to NB communications only, and one applicable on all scenarios up to SWB. In this work, we focused on this SWB mode of models, since our main goal was to identify the main causes of degradations due to VoIP transmission, wherein NB, WB, but also more and more SWB codecs are in use. In this section, we briefly describe the structure of these models.2.1. Description of POLQA
POLQA has been jointly developed by three companies OPTICOM, SwissQual and TNO and was the winner of a technical competition carried out by the ITU-T to overcome drawbacks of PESQ. It was approved in January 2011 as ITU-T P.863 Recommendation [13]. It was specially developed for HD Voice, 3G and 4G/LTE, VoIP. As described in [13], POLQA is based on a further development of the underline concepts of PSQM [14], PESQ [15, 16] and the approach proposed in [17]. Figure 1
describes the mechanism of POLQA. Note that the presentation of its original structure (see [13]) has been modified in order to identify and highlight the perceptual dimensions. This model performs through the following stages:
(a) Pre-Processing: The time alignment and the level alignment to a calibrated listening level of reference and degraded signals are performed at this stage. The time alignment of POLQA is mainly based on a technique of resampling. First of all, both reference and degraded signals are split into frames of the same length. Then, the delay between the two signals is determined per frame followed by the estimation of the sampling rates of these two signals. The sampling rate estimation is based on the delay information. If the sampling rates of the reference and degraded signals differ by more than approximately 1%, the signal with the higher sampling rate is down-sampled. This process is repeated while strong delays are reliably detected.
(b) Core model: Once the correct delay between reference and degraded signals is determined, the reference signal and the aligned degraded signal are compared in terms of their internal representations which are analogous to the psychophysical representation of audio signals in the human auditory system, taking into account the perceptual frequency (Bark) and the loudness (Sone). This is achieved in several stages: time frequency mapping, frequency warping, and compressive loudness scaling. From the comparison of internal representation of reference and degraded signals, four different variants of disturbance density are computed, one representing the main branch (i.e. the difference between the loudness of reference and degraded signals), one representing the main branch for big distortions, one branch focused on added distortions and the last one on added big distortions. After several compensation stages, two final disturbance densities are derived from the four disturbance densities, the first one representing the disturbance as a function of time and frequency and the second one representing the final disturbance as a function of time and frequency but focused on the processing of added disturbances.
(c) Quality degradation indicators: POLQA integrates 3 QDIs, one for frequency response distortions ("Freq"), a second one for additive noise ("Noise") and a third one for room reverberations ("Reverb"), all used to compute the final MOS-LQO value (see blocks 1.a, 3.a, and 1.c respectively in Figure 1). In addition, 3 internal QDIs are used in the calculation in internal MOS scale compensation: the "Flatness" indicator for the global level of timbre deviation, the "Level" indicator for the global listening level and a third indicator, we named "NoiseContrast", for the noise level variations (see blocks 1.b, 4, and 3.b respectively on Figure 1). Furthermore, the effect of time clipping and frame repeat distortions are modelled into the Core model stage. Accordingly, we derived two indicators from these modelling that we named "TimeClip" and "FrameRepeat" indicators respectively (see block 2 in Figure 1). These quality degradations indicators are described in Section 3.
(d) Cognitive model: The two final disturbance densities are combined with QDIs to derive the final MOS-LQO value [13].
2.2. Description of DIAL
As explained above, the originality and singularity of DIAL is that it integrates 4 perceptual degradation dimensions and provides a global predicted MOS value together with 4 additional MOS values for each perceptual dimension respectively. These 4 dimensions are detailed in Section 3.
In DIAL, the building blocks corresponding to these perceptual dimensions (see blocks 1 to 4 in Figure 2) quantify linear degradations corresponding to each dimension, expressed and quantified in terms of a dedicated MOS.
Fig.1: Overview of POLQA Fig.2: Overview of DIAL
The particularity of the Core model of DIAL is that it provides not only the internal representation of the original and degraded speech signals, but also quantifies the non-linear distortions introduced by speech transmission systems such as low bit-rate codecs or abrupt level variations of perceived noise. The final prediction MOS-LQO is obtained by combining the 4 additional MOS values for each dimension with the Core model quality score using a machine learning technique.
3. Comparative analysis in terms of perceptual dimensions
Although the POLQA model is not explicitly based on perceptual dimensions, the presence of several intermediate indicators (mentioned as such in the description provided in P.863 [13]) supposes an implicit characterization of these dimensions. In this section, we first report how we identified and/or estimated these QDIs in POLQA and compared them with the corresponding explicit indicators found in DIAL, for the four perceptual dimensions mentioned above. Furthermore, recent studies [18-20] have shown that "Directness/Frequency Content", "Continuity" and "Noisiness" dimensions can be subdivided into sub-dimensions, which are presented and described in what follows. We think that this division in sub-dimensions is more suited to technical causes diagnosis than the one proposed in [21] which is more based on sound perception and less linked to underlying technical elements.
3.1. Directness/ Frequency Content (DFC)
This dimension quantifies the characteristics of the frequency response of the overall transmission system (mouth-to-ear). The studies reported in [18] showed that this dimension can be subdivided into two sub-dimensions described hereafter:
(a) Directness: This sub-dimension describes specific impairments such as the influence of talking-room reflections or
bandwidth limitation. It is quantified in DIAL by the "ERB" (Equivalent Rectangular Bandwidth) indicator, defined in Bark. This QDI characterizes the bandwidth limitation of the frequency response. In POLQA, the "Reverb" indicator is used to estimate the reverberation effect and is thus rather linked to this sub-dimension.
(b) Frequency Content: Also called Brightness [9], this sub-dimension addresses the frequency response deviation of the overall
transmission, and is characterized in DIAL by the "fc" indicator, which is the central frequency of the gain of the overall transmission system and is expressed in Hertz.
In POLQA, the "Freq" indicator quantifies the impact of the overall global frequency response distortion, similarly to the "FRQ" indicator detailed in [17]. It addresses both Directness and Frequency Content sub-dimensions. In addition, the "Flatness" indicator, which quantifies the impact of timbre distortions (also referred as "Coloration"), falls in the scope of this dimension.
3.2. Continuity
This dimension is representative of the effect of time-varying aspect perceived on speech. This kind of degradation is generally introduced into speech signal either by loss of packets during VoIP (Voice over IP) transmission, by erroneous bits during radio transmission, or by other signal processing techniques such as echo cancellation or noise reduction which may introduce an abrupt level variation in the signal. Techniques such as Packet Loss Concealment (PLC), used to reduce the effect of some of these interruptions, can also impact the "Continuity" dimension. The study achieved in [19] proved that this dimension can be sub-divided into three sub-dimensions:
(a) Interruptedness: This sub-dimension is linked to the perceived interruptions of transmitted speech. In case of packet loss,
interruptions are more audible when the audio frames lost during transmission are replaced by silence frames (e.g. zero insertion used as PLC technique). As indicated in [22], the resulting signal is then the same as if the signal had been interrupted for the duration of the lost packets. Another source of interruption referred as Time clipping, generally due to wrong detection of Voice Activity Detection (VAD), falls in the scope of the Interruptedness sub-dimension. For such kind of interruption, active speech signal is lost at the beginning (Front-End Clipping) or at the end (Back-End Clipping) of voice activity segments. This sub-dimension is addressed in DIAL using the "rI" indicator representing the rate of long interruptions in the degraded speech signal (named interruption rate in [12]), mainly caused by IP packet loss. In addition, DIAL includes the "rL" indicator that represents the rate of short interruptions (named short level variation rate [12]) due to packet/frame loss or time clipping occurring on the degraded speech signal during speech activity periods. In POLQA, during the calculation the internal representation of speech signal, the difference between the reference and the degraded pitch loudnesses reflects apparently the impact of time clipping on the perceived speech quality. Thus, we derived from this difference an indicator we called "TimeClip" (see block 2 in Figure 1). This indicator could be compared with the indicators found in DIAL (and mostly with the "rL" indicator).
(b) Additive Artifacts: This sub-dimension is representative of the audible artifacts due to signal processing techniques (e.g. PLC
techniques using interpolation). In DIAL, this sub-dimension is quantified by the "rA" indicator which estimates the rate of perceived artifacts. In POLQA, in the same manner as for "TimeClip", during the computation of the final disturbance densities, we identified an indicator used to estimate severe distortions introduced by frame repetitions. We considered that this indicator is certainly similar to the "rA" indicator used in DIAL. We named it "FrameRepeat" (see block 2 in Figure 1).
(c) Musical Noise: This sub-dimension covers the time varying residual noise components due to imperfect noise reduction
algorithms. We found no indicator in the models under study to quantify the effect of this musical noise.
Note that, in DIAL, the "
P
lin" indicator (see Figure 2), representing the linearized similarity value, is used to quantify thenonlinear degradations due to the effect of strong discontinuity or abrupt level variation of additive noise and thus it addresses both "Continuity" and "Noisiness" (see Section 3.3) dimensions.
3.3. Noisiness
This dimension is related to the perceived impact of noise-like distortions such as background noise or circuit noise. In [20], three sub-dimensions have been identified:
(a) Speech Contamination: This sub-dimension represents the perception of noise-like distortions correlated with speech or lying
within the (band-limited) transmitted speech spectrum. In DIAL, the "NoS" (Noise on Speech) indicator is used to quantify the impact of perceived noise present during active speech periods.
(b) Additive Noise Level: Describing the perceived level of additive noise, this sub-dimension is quantified in DIAL by the "Ln"
indicator, which represents the total perceived loudness of noise, computed during silent periods (taking into account abrupt noise level variations). This indicator is defined in Sone. In POLQA, the "Noise" indicator quantifies the impact of noise on the whole signal (i.e. during both silent and active speech periods). We suspected therefore that this indicator covered also the
Speech contamination sub-dimension. Besides, we investigated another inner indicator, we named "NoiseContrast". This
indicator is derived from the silent parts of the reference signal and quantified severe noise level variations.
(c) Noise Coloration: This sub-dimension reflects the effect of spectral shape and spectral content of noise. We found no
indicator to characterize this sub-dimension in the models under study.
3.4. Loudness
The "Loudness" dimension reflects degradations on speech due to a non-optimum listening level. No sub-dimension has been identified for "Loudness". In DIAL, the "LTL" (Long-Term Loudness) indicator estimates the perceived loudness of the whole degraded speech signal whereas the "Leq" (Equivalent Continuous Sound Level) indicator corresponds to the mean energy of the degraded signal over all active speech frames. The "LTL" and "Leq" indicators are respectively expressed in the Sone and dBSPL
scale. In POLQA, the "Level" indicator is used to quantify severe deviations of the optimal listening level. It is applied on the whole signal, thus corresponding more or less to the "LTL" indicator in DIAL.
3.5. Summary
Table I synthesizes all the perceptual dimensions and the different indicators relating to these dimensions. This table allows identifying common features as well as differences between the POLQA and DIAL models and highlights the sub-dimensions for which new indicators must be developed.
4. Methods and materials
In order to qualitatively assess the performance of the QDIs identified in the models presented before, we chose as a first step to apply them on speech samples corrupted by a single degradation condition pertaining to the four perceptual dimensions. This allows testing the reliability of the QDIs to correctly quantify the degradation for which it was designed. These stimuli were selected from existing speech databases that had been specifically designed for SWB material and developed by ITU-T Study Group 12 Question 9 for POLQA competition. It makes sense to point out that during the selection phase of the POLQA project, two groups of database were built: the first one represented a large set of conditions on which candidate models have been developed and optimized (training phase) and the second one stood for the "unknown" databases used to validate the reliability of these models. The first dataset (named dataset 1) we considered in our study was taken from this second group. This dataset
contained stimuli covering 4 different languages (French, Dutch, British English and Swiss German) and the 10 common anchor conditions of the POLQA SWB databases, as shown in Table II (merged per perceptual dimension). Each condition corresponded to a single degradation, except for the reference condition "SWB" (C1) for which no degradation has been introduced. The 9 other conditions represented different levels of degradation referring to bandwidth limitation (C2, C3, and C4), packet/frame loss (C5 and C6), noise (C7 and C8) and speech level attenuation (C9 and C10), respectively representative of the four perceptual dimensions identified. This dataset was made up of 36 stimuli per condition (4 stimuli in French, Dutch and Swiss German languages and 24 stimuli in British English language) yielding a total of 360 speech stimuli. To test our indicators, we first proposed a visual analysis of all indicators found in the models under study (see Section 5.1). Then, we analyzed objectively the performance of some of them, introducing two requirements (R1 and R2) proposed in [17] and summarized hereafter:
R1: A mapped (or predicted) MOS derived from a QDI should have a high correlation with auditory test results, preferably
above 0.9, for degradations for which the indicator was designed.
R2: A QDI should also have good discrimination properties, i.e. the corresponding predicted MOS value should be as high as
possible, preferably above 3.0, for degradations for which this indicator was not designed.
For instance, since the "ERB" indicator was designed to quantify the effect of bandwidth limitation, it should only predict speech quality degradation under bandwidth limitation conditions (requirement (R1)). This can be checked through the computation of correlation between the predicted MOS value derived from "ERB" and auditory test results obtained in the corresponding conditions. In addition, it should display a stable behavior (i.e. reflect good speech quality) for degradations that are not related to this specific degradation, for example for time clipping or noise effect (requirement R2). Answering both requirements insures the reliability and robustness of the indicator. Furthermore, it is generally rare to get a QDI which is robust to all degradations. Thus, the second requirement (R2) allows defining a minimum threshold of quality (i.e. MOS ! 3.0) beyond which the impact of other degradations is considered as acceptable. It is important to note that the first requirement (R1) could be applied only on databases (or parts of databases) where the degradation under study was not mixed with other degradations, so that the auditory test results would reflect the impact of this single degradation. That is why we built our dataset from stimuli degraded by a single degradation condition so that the subjective MOS reflects the impact of this degradation.
In a second step, we focused on the relevance of the "Continuity" dimension indicators. In this case, 48 speech samples (all in French, 8 per condition, 24 uttered by a male speaker, and 24 by a female speaker) were processed by the G.722 WB codec at 64kbits/s, using a zero insertion PLC, combined with packet/frame losses of 0, 2, 4, 6, 8, and 10 percents (conditions C11, C12, C13, C14, C15 and C16 respectively), representing the Interruptedness sub-dimension. In addition, 56 stimuli (same proportion of male and female speakers as above) were also degraded by the G.718B SWB codec (the selected bit rate was 48 kbits/s) with a frame repetition PLC together with packet/frame losses of 0, 2, 4, 6, 8, 10 and 15 percents corresponding respectively to conditions C17, C18, C19, C20, C21, C22 and C23. The 56 stimuli (8 stimuli per condition) were used to compare the performance of the indicators addressing the Additive Artifacts sub-dimension. Thus, a total of 104 stimuli, containing the same number of male and female speech samples were used to construct our second dataset (dataset 2). The conditions considered for this dataset are summarized in Table III. As detailed and justified later in Section 5.3, we performed a graphical analysis of the QDIs for Additive Artifacts sub-dimension whereas the performance of Interruptedness indicators was tested objectively using the same requirements as previously (see Section 5.2).
Moreover, as our first (dataset 1) was made up of stimuli extracted from 4 different databases with specific language, the auditory values may be biased by the corpus effect (e.g. the effect of language, sentence, etc.). Zielinski et al. [23] studied the corpus effect on quality judgments. They showed that the semantic difference between the terms "Fair" and "Poor" is not equal to their translated equivalent in other languages, e.g. respectively "Assez bon" and "Médiocre" in French. They concluded that quality judgments are different depending on the language. Consequently, our first dataset needed to compensate for the corpus effect. To do so, we applied on each database a specific normalization procedure suggested in [12]. Let us remind that all
databases contain the same 10 anchor conditions. First of all, for each database, the auditory MOSLQS (MOS-Listening Quality Subjective) values have been averaged per anchor condition resulting in 10 mean auditory MOSLQS values. Secondly, the auditory MOSLQS values for each anchor condition have also been averaged over all the 4 databases yielding a total of 10 mean auditory MOSLQS values. Then, for each database, a third order polynomial function f has been estimated between the
LQS
MOS values for the 10 anchor conditions and the 10 MOSLQS values. Finally, the function f has been applied to all auditory MOSLQS values of each database. The same normalization procedure has been applied on the second dataset to attenuate the effect of the sentence uttered by the male and female speakers. Therefore, to apply the first requirement on QDIs, we computed the correlation between the new auditory values corresponding to stimuli conditions and the predicted MOS values derived from QDIs.
Finally, it is worth mentioning that the codes of POLQA and DIAL have been modified to provide as outputs (in addition to MOS values) all dimension indicators we have identified. Concerning POLQA, the consistency in terms of global MOS value of these modifications with a reference implementation (executable used for characterizing the new standard) has been successfully checked.
TABLE I
COMPARISON BETWEEN POLQA AND DIAL IN PERCEPTUAL DIMENSION APPROACH
Perceptual Dimensions Sub-dimensions DIAL POLQA
Directness/Frequency Content
Directness ERB Reverb Freq,
Flatness Frequency Content fc -- Continuity Interruptedness lin
P
rI, rL TimeClipAdditive Artifacts rA FrameRepeat
Musical Noise -- --
Noisiness
Speech Contamination NoS
Noise
Additive Noise Level Ln NoiseContrast
Noise Coloration -- --
Loudness -- LTL Level
5. Experimental results
5.1 Graphical analysis of QDIs
To obtain reliable results, all speech stimuli of the first dataset were gathered by condition (36 stimuli per condition) and plotted on graphs (see Figures 3 to 6) to show the variations of the 18 studied indicators mentioned in Section 3, depending on the levels of degradations present in these conditions. For the 10 conditions, we used the same number of male speech samples, female speech samples and languages. In this section, we present an analysis of the graphical variations where the number of stimuli per condition was the x-axis and the QDI values the y-axis. Note that during the identification of QDIs, the unit of measurement of some of them was unknown. Therefore these QDIs values were represented on the y-axis without any unit of measurement.
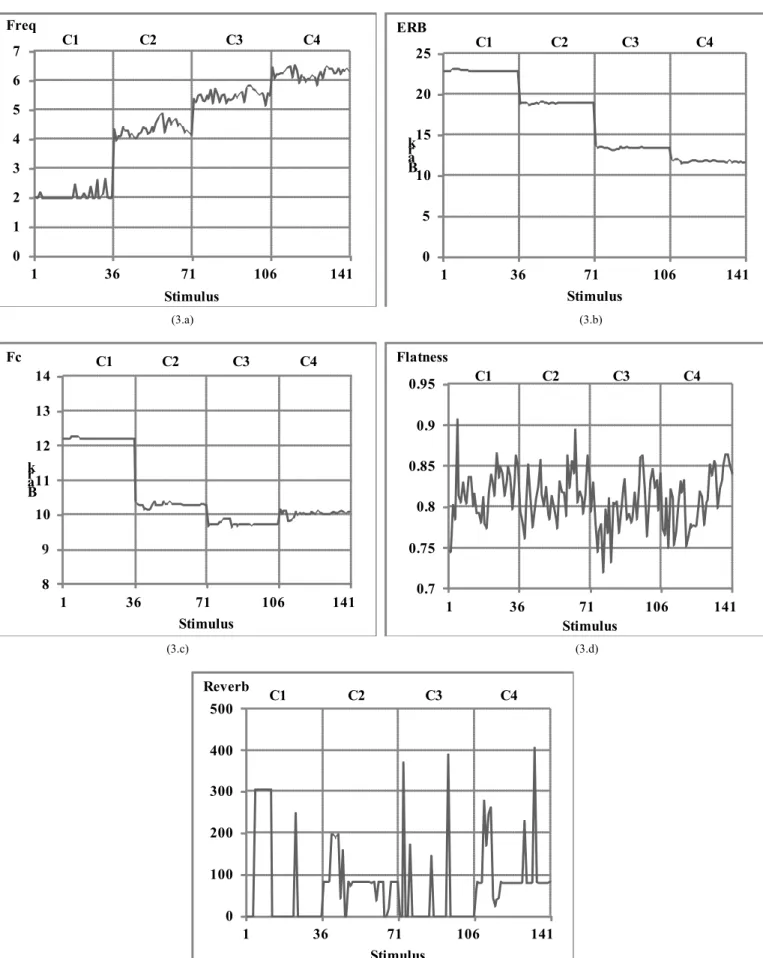
5.1.1 Directness/Frequency Content (DFC)
The conditions used for the DFC dimension were representative of a simple bandwidth limitation (conditions C2 and C4), with an exception corresponding to condition C3 where the signal was also IRS-filtered (two Intermediate Reference Systems (IRS) have been used, the modified IRS at send side and the IRS at received side [24]), but with a bandwidth comprised between those of conditions C2 and C4. In Figure 3.a, we observed that the POLQA "Freq" indicator increased following the degree of bandwidth restriction. In the same manner, the DIAL "ERB" indicator (see Figure 3.b) was depending on the bandwidth of the frequency response of the overall system and decreased according to the degradation level. So, these two indicators showed comparable monotonic behaviors. If the values of the "fc" indicator extracted from DIAL decreased when passing from condition C1 to condition C2, and then from condition C2 to condition C4 (see Figure 3.c), according to the progressive restriction of the bandwidth (when passing from C1 to C4), we can note that the lowest values for this indicator were obtained on condition C3. This result reveals that this indicator depended also on the nature of the frequency spectrum (remember that the third condition corresponded to an intermediate bandwidth between the bandwidths of C2 and C4). In Figure 3.d, the POLQA "Flatness" indicator displayed constant values for all conditions, what can be explained by the fact that these conditions did not contain any timbre distortion. Consequently, it can not be reliably assessed in this work. For similar reasons, i.e. no reverberation in the present conditions, the POLQA "Reverb" indicator remained relatively constant in the three conditions related to DFC (Figure 3.e). From all these observations, we concluded that the QDIs "Freq" and "ERB", derived respectively from POLQA and DIAL, were relevant for assessing the degradation linked to the bandwidth limitation, whereas the "fc" indicator from DIAL reflected other types of spectral distortion (needed to be confirmed on further test samples). As far as the "Reverb" and "Flatness" indicators of POLQA were concerned, they were not relevant for the distortion present in the dataset under study.
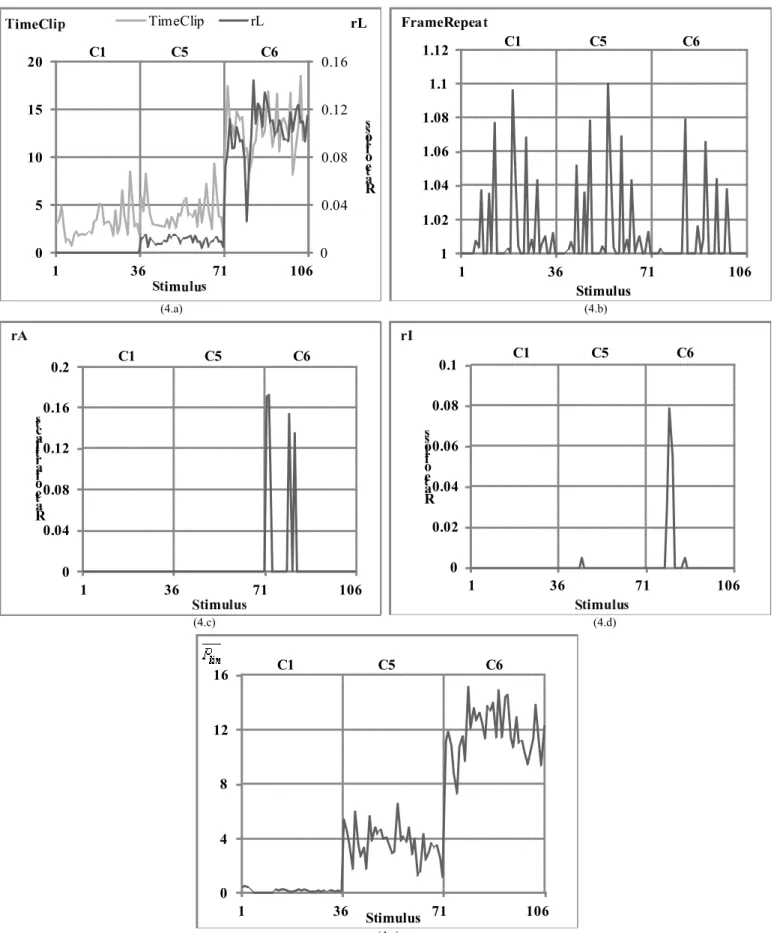
5.1.2. Continuity
To test the "Continuity" dimension indicators, we used conditions C5 and C6 representing two levels of packet/frame loss (2 % and 20 % respectively, randomly distributed). Figure 4.a shows that the "rL" indicator in DIAL, which quantified the impact of packet/frame loss, appeared relevant to characterize the "Continuity" dimension, as well as the "TimeClip" indicator in POLQA. The values obtained by these indicators clearly reflected the amount of packet loss. As for the three other indicators, i.e. "FrameRepeat" from POLQA, "rA" and "rI" from DIAL (see Figures 4.b, 4.c and 4.d), there was no appropriate degradation in our dataset to test their relevance. Furthermore, since the "Continuity" dimension was taken into account in the core model of
along with the level of packet/frame loss appeared coherent (see Figure 4.e), concluding to a comparable behavior of the three
indicators "rL", "TimeClip" and "
P
lin".TABLE II
THE 10 ANCHOR CONDITIONS (DATASET 1). F, D, E, AND S REPRESENT RESPECTIVELY THE FRENCH,DUTCH,ENGLISH AND SWISS GERMAN LANGUAGES
TABLE III
SUMMARY OF CONDITIONS USED TO ASSESS THE PERFORMANCE OF THE "CONTINUITY" DIMENSION INDICATORS (DATASET 2)
Degradation
conditions Dimension/Sub-dimensions Signal characteristics
C11 to C16 Continuity/Interruptedness G722 (with 64kbits/s as bit rate), packet/frame losses with percentage ranging from 0 to 10% (by step of 2 %)
C17 to C23 Continuity/Additive Artifacts G718B (with 48kbits/s as bit rate), packet/frame losses with percentage of 0,2, 4, 6, 8, 10 and 15%
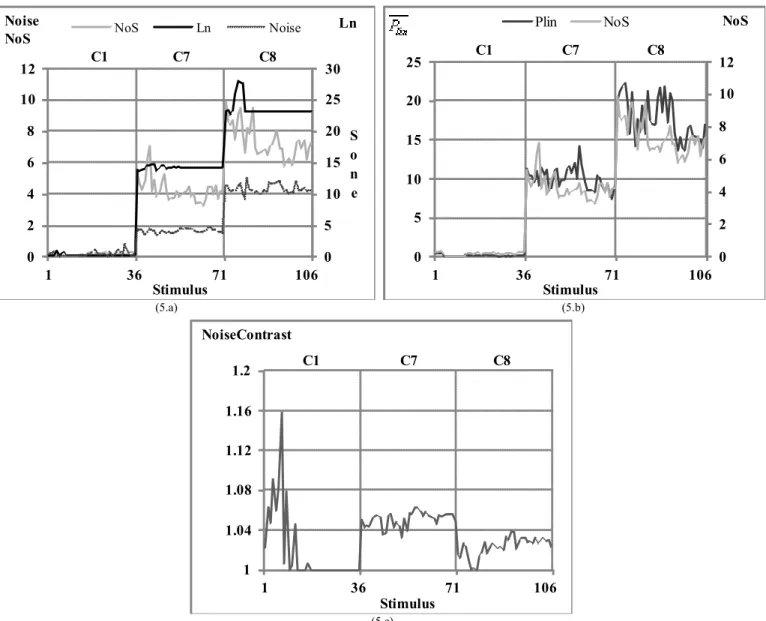
5.1.3. Noisiness
Testing the "Noisiness" dimension indicators was more complex, since the only available conditions relative to this phenomenon, namely C7 and C8, not only differed by the noise level (20 dB and 12 dB of Signal to Noise Ratio respectively) but also by the type of noise (a time-varying noise (C7) and a stationary one (C8)). Moreover, in our dataset, the noise was present not only on silence periods but also on voice segments. Figure 5.a shows that the "Noise" indicator from POLQA and the "Ln" and "NoS" indicators from DIAL increased with the level of noise, the "Noise" and "Ln" indicators being the most stable for
a given condition. Concerning the "
P
lin" indicator, it appeared quite comparable to the "NoS" indicator (see Figure 5.b). Even ifabrupt variations were detected on the "NoiseContrast" indicator in condition C1 (see Figure 5.c) that could not be explained at that time, this indicator was clearly influenced by the noise level variations (conditions C7 and C8). Let us remind that the time-varying disturbing noise present in condition C7 varied within a short dynamic range and then could introduce more severe noise level variations than steady noise.
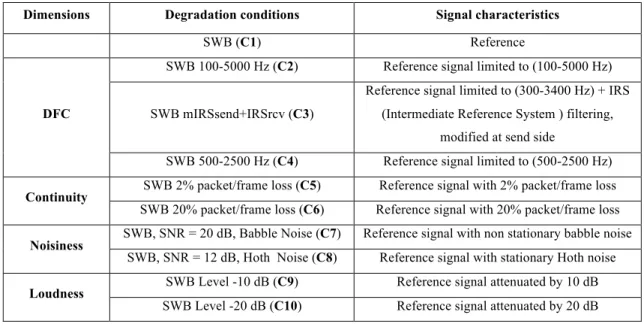
Dimensions Degradation conditions Signal characteristics
SWB (C1) Reference
DFC
SWB 100-5000 Hz (C2) Reference signal limited to (100-5000 Hz)
SWB mIRSsend+IRSrcv (C3)
Reference signal limited to (300-3400 Hz) + IRS (Intermediate Reference System ) filtering,
modified at send side
SWB 500-2500 Hz (C4) Reference signal limited to (500-2500 Hz)
Continuity SWB 2% packet/frame loss (C5) Reference signal with 2% packet/frame loss
SWB 20% packet/frame loss (C6) Reference signal with 20% packet/frame loss
Noisiness
SWB, SNR = 20 dB, Babble Noise (C7) Reference signal with non stationary babble noise SWB, SNR = 12 dB, Hoth Noise (C8) Reference signal with stationary Hoth noise
Loudness SWB Level -10 dB (C9) Reference signal attenuated by 10 dB
5.1.4. Loudness
The conditions C9 and C10 used for the "Loudness" dimension consisted of two stages of signal level attenuation compared to the original speech sample (10 dB and 20 dB respectively) uniformly applied on the whole signal. The POLQA "Level" indicator is defined as a ratio of an optimum level power density to the power density of the degraded signal. So, it must increase when the power density level of the degraded signal decreases, or, in other words, when this level is attenuated. This result has been confirmed by the graphical analysis (see Figure 6.a). Concerning the indicators from DIAL, namely "LTL" and "Leq", the first one was computed on the whole degraded signal and the second one only on the active speech frames. Consequently, they decreased when the level of the degraded signal decreased as observed in Figure 6.b. Since the attenuation applied in these conditions was the same on the whole duration of the signal, both indicators, "LTL" and "Leq", conveyed comparable information. To study their differences, signals with different levels of attenuation on active and silent parts of the signal should be considered.
To summarize, we observed that most of these indicators followed the degree of degradations for which they were designed and therefore, they can be used for an advanced diagnostic of speech quality. However, the relevance of the indicators "fc", "rA" from DIAL and "Reverb", "Flatness", and "FrameRepeat" from POLQA, cannot be discussed in the scope of this work since their corresponding degradation conditions were not available in our dataset. Consequently, these QDIs have been discarded afterwards.
5.2 Objective performance of these indicators
In Section 5.1, we proposed a comparison of QDIs we identified in the two selected models based on a visual analysis. However, this approach gives only an overview on their characteristics (and particularly monotony) and cannot fully assess their performance. As a matter of fact, the performance evaluation of QDIs is a difficult task in a real communication when multiple degradations occur simultaneously. So, in a second step, we proposed objective criteria to check the ability of QDIs to predict speech quality under degradations for which they were designed, while remaining robust to other degradations. Our goal was to find the best indicators to diagnose speech quality degradations whatever the context. The criteria we used to assess the performance of these indicators were described in Section 4.
To achieve the first requirement (R1), QDIs values required to be mapped to MOS values (or predicted MOS) using mapping functions. These functions are generally derived from the QDIs values and the corresponding subjective MOS using either a linear regression analysis or a machine learning technique. The machine learning technique provides more robust estimates than linear methods as mentioned in [25] but requires an important amount of stimuli. In our study we adopted the linear regression approach because of its simplicity. In addition, for each QDI, an optimum mapping function was required. Since we were looking for the best trade-off between the correlation between the predicted MOS values and the new auditory test values (see Section 4) and the prediction error, we estimated the mapping function between QDI values and the new auditory test values using a polynomial regression function of different orders N with a confidence interval of 95%. Then, by using the R-square statistic (R2) and Root Mean Square Error (RMSE) between the new auditory test values and the predicted MOS values, it came out that the optimum mapping function was obtained for N = 3. Therefore, we adopted the third order polynomial regression function. Then, we computed the correlation between the predicted MOS values derived from the indicators and the corresponding auditory subjective MOS. Furthermore, these mapping functions were needed for the second requirement (R2), for which we selected conditions from C2 to C10 (see Table I) to check the robustness of the QDIs.
Let us remind that the indicators "fc", "rA" from DIAL and "Reverb", "Flatness", and "FrameRepeat" from POLQA were out of the analysis since the degradations for which these indicators were designed were not present in our dataset. Requirements R1
and R2 were applied to assess the performance of the remaining thirteen indicators (see Table IV, where "
P
lin" was consideredfor two dimensions).
5.2.1. Directness/Frequency Content indicators
As shown on Table IV, the "Freq" and "ERB" indicators were highly correlated with auditory test results (" = 0.92) and yielded a high mapped MOS (! 4.42) for dimensions for which they were not dedicated. Since they fulfilled both requirements
R1 and R2, we concluded that these QDIs were highly relevant to diagnose the impact of bandwidth limitation.
5.2.2. Continuity indicators
The "TimeClip" indicator from POLQA and the "rL" indicator from DIAL behaved well in terms of correlation with auditory tests under packet/frame loss conditions (" ! 0.9) (see Table IV), but the "TimeClip" indicator led to an estimated MOS far below 3.0 (MOS = 1.62) for conditions relative to the "Directness/Frequency Content" dimension. Unlike "rL", the "TimeClip" indicator was impacted by the bandwidth limitation and, therefore, it was not satisfying to diagnose degradations of the "Continuity" dimension. In addition, Table IV shows that the "rI" indicator performed the worst in terms of correlation with auditory tests
(" = 0.22) and therefore was not reliable to quantify the effect of packet/frame loss. As far as the DIAL QDI "
P
lin" was concerned, it quantified the nonlinear degradations and allowed quantifying both "Continuity" and "Noisiness" dimensions.Concerning the "Continuity" dimension, Table IV shows that "
P
lin" was highly correlated with the auditory tests (" = 0.97) and led to high and stable predicted MOS (MOS = 4.75) for the remaining three degradations. To conclude, the "rL" and "P
lin"indicators from DIAL were the most relevant indicators to diagnose the effect of packet/frame loss on speech quality.
5.2.3. Noisiness indicators
On the one hand, the POLQA "Noise" indicator as well as the DIAL "Ln", "NoS" and "
P
lin" indicators fulfilled bothrequirements (i.e. " ! 0.9 and MOS > 3.0), concluding to their relevance in diagnosing degradations linked to the "Noisiness" dimension. On the other hand, the "NoiseContrast" indicator from POLQA behaved the worst in terms of correlation (" = 0.73) and thus failed to quantify correctly the impact of noise since it was impacted by other degradations (see Table IV).
5.2.4. Loudness indicators
The QDIs for the "Loudness" dimension, namely "Level" from POLQA and "Leq" and "LTL" from DIAL, displayed a correlation below 0.9 and thus did not fulfill the first requirement (R1). Nevertheless, "Leq" and "LTL" performed the best for the first requirement (" = 0.85 and " = 0.84 respectively) as observed in Table IV, and was compliant to the second requirement. Note that the predicted MOS values of these three QDIs were very high (MOS > 4) for degradations for which they were not designed.
TABLE IV
CORRELATION/DISCRIMINATION MATRIX.THE COLORED CELLS REPRESENT THE CORRELATIONS (#) BETWEEN THE PREDICTED MOS
PREDICTED MOS VALUES OF THE QDIS (R2).THE COLORED CONDITIONS REPRESENT THE CONDITIONS USED TO ACHIEVE THE REQUIREMENT R2. Conditions Indicators C1, C2, C3, C4 (DFC) C1, C5, C6 (Continuity) C1, C7, C8 (Noisiness) C1, C9, C10 (Loudness) DFC Freq 0.92 4.53 4.47 4.50 ERB 0.92 4.42 4.44 4.50 Continuity TimeClip 1.62 0.93 4.75 4.75 rL 4.41 0.97 4.49 4.49 rI 3.09 0.22 3.10 3.10 lin
P
4.75 0.97 4.75 4.75 Noisiness Noise 4.19 4.02 0.95 4.49 NoiseContrast 3.20 4.18 0.73 4.18 Ln 4.50 4.50 0.95 4.50 NoS 4.35 4.36 0.93 4.45 linP
3.43 3.56 0.94 4.49 Loudness Level 4.63 4.50 4.38 0.82 Leq 4.48 4.50 4.53 0.85 LTL 4.49 4.49 4.49 0.845.3. Performance evaluation of the "Continuity" indicators
This section focuses on the performance of QDIs for the "Continuity" dimension found in (or derived from) DIAL and POLQA, under conditions affected by degradations pertaining to this dimension. To this end, we considered the second dataset (dataset 2, see Section 4) and we kept the same criteria as those described in Section 5.2. As indicated in Section 4, the use of the first requirement (R1) supposed that the degradation under study was not mixed with other degradations so that the global subjective MOS entirely reflected the impact of the degradation under consideration. For conditions implying a frame repetition PLC technique (C17 to C23), this was not the case, since both artifacts and interruptions were present and audible in some speech samples. In this case, the global subjective MOS did not reflect only the presence of artifacts in the speech signal. Consequently, both requirements R1 and R2 could not be applied to conditions C17 to C23, for which we only proposed a graphical analysis (as in Section 5.1) of the QDIs developed to characterize Additive Artifacts. Therefore, the two requirements were applied only on conditions C11 to C16 impacted by packet/frame loss without any reconstruction of lost frames (zero insertion PLC), and so on QDIs relative to the Interruptedness sub-dimension.
5.3.1. Results on the Interruptedness indicators
According to Table V, the "rL" indicator was well correlated with the auditory test results (" = 0.94) and had a high mapped MOS value (! 3.71) for other degradations. Concerning the "TimeClip" indicator, it did not meet any requirement (" < 0.9 and MOS < 3.0). In Section 5.2.2, we already showed that "TimeClip" was impacted by frequency domain degradations. We concluded that this indicator was definitely not appropriate to diagnose packet/frame loss. In accordance with results obtained in Section 5.2.2, as far as the "rI" indicator was concerned, this indicator also failed in fulfilling both requirements (" = 0.28 and MOS = 2.23). Finally, Table V shows poor results for the "
P
lin" indicator (" = 0.66 and MOS< 3 for conditions related to DFCand Noisiness dimensions). This limits former conclusions drawn in Section 5.2, where we found that this indicator performed well in the case of packet/frame loss effect and remained robust for other degradations in particular for DFC and Noisiness. This difference can be explained by the fact that, unlike in the first dataset (dataset 1), packet/frame loss was associated with voice
CELP low bit rate coding in the second dataset. As described in Section 2.2, the "
P
lin" indicator takes into account thedegradation introduced by low bit rate coding resulting in some biased estimation of the mapping function. This non optimal mapping function justifies that the predicted MOS values for conditions relative to DFC and Noisiness (MOS < 3, see Table V)
differed from those obtained in Section 5.2 (MOS > 3, see Table IV). We concluded that the "
P
lin" indicator can only be used todetect degradations within the Continuity dimension if it is combined with an indicator for the DFC dimension able to assert that such a low bit rate codec is not present in the system under test.
TABLE V
CORRELATION/DISCRIMINATION MATRIX FOR "CONTINUITY/INTERRUPTEDNESS" INDICATORS.THE COLORED CELLS REPRESENT THE CORRELATIONS
(#) BETWEEN THE PREDICTED MOS VALUES DERIVED FROM QDIS AND THE CORRESPONDING NEW AUDITORY MOS(REQUIREMENT R1).THE OTHER VALUES STAND FOR THE PREDICTED MOS VALUES OF THESE QDIS (R2).THE COLORED CONDITIONS REPRESENT THE CONDITIONS USED TO ACHIEVE
THE REQUIREMENT (R2). Conditions Indicators C2, C3, C4 (DFC) C11, C12, C13, C14, C15, C16 (Continuity) C7, C8 (Noisiness) C9, C10 (Loudness) TimeClip 2.26 0.28 4.75 4.75 rL 3.71 0.94 3.74 3.74 rI 2.23 0.28 2.23 2.23 lin
P
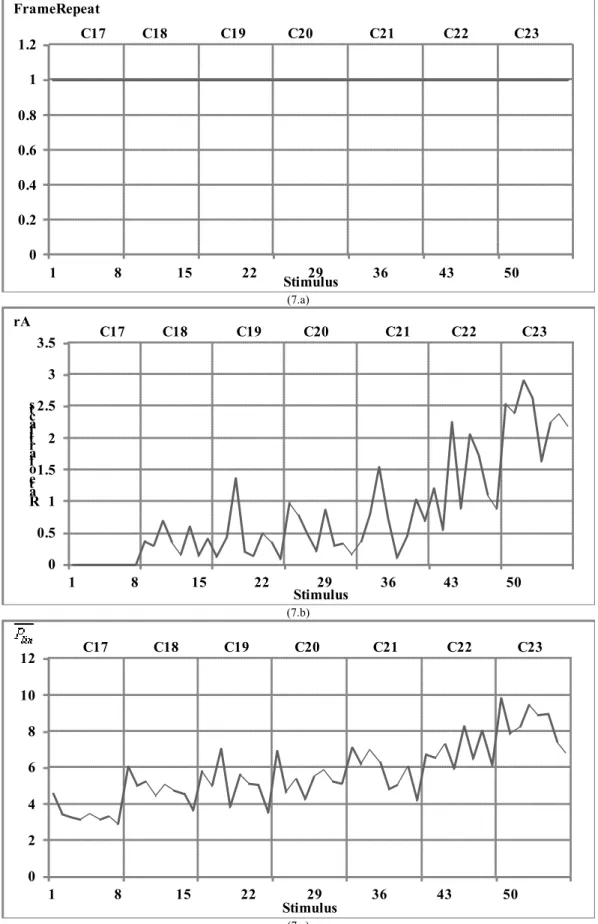
2.03 0.66 1.0 4.755.3.2. Results on the Additive Artifacts indicators
The Additive Artifacts indicators "FrameRepeat", "rA" and "
P
lin" are displayed in Figures 7.a, 7.b and 7.c respectively. Whilethe "FrameRepeat" indicator remained constant for all packet/frame loss conditions (Figure 7.a), the "rA" indicator quantifying the perceived additive artifacts, and in particular those due to frame repetition, increased with the percentage of packet/frame loss (Figure 7.b). This involves that the "rA" indicator should be used to diagnose the effect of perceived artifacts due to frame
repetition. The same result holds with the "
P
lin" indicator (Figure 7.c) whose values increased with the amount of packet/frameloss. We concluded that both "rA" and "
P
lin" were relevant indicators to diagnose the perceived additive artifacts. Since thedegradation conditions we studied were limited and not fully representative of this sub-dimension, these conclusions must be corroborated on a larger number of speech samples and databases, and the reliability and robustness of these QDIs must be objectively confirmed.
Up to now, no QDI has been proposed to quantify the Musical Noise sub-dimension, even though this kind of degradation has a non negligible impact on speech quality that must be quantified. To address this issue, we plan to develop new indicators in a near future.
In this paper, we presented and studied several voice Quality Degradation Indicators (QDIs), extracted from two speech listening quality models (ITU-T P.863 or POLQA, and proprietary DIAL), to consider their relevance in diagnosing technical causes of perceived voice quality degradations in new telecommunication contexts characterized by the wide use of signal processing techniques and SWB audio coding. To this end, we built datasets of speech stimuli containing different degradation conditions pertaining to the four perceptual dimensions identified in the literature, namely "Directness/Frequency Content", "Continuity", "Noisiness" and "Loudness". We assessed the performance of the QDIs using objective and subjective methods and came to the following conclusions:
! For the "Directness/Frequency Content" dimension, we concluded that the "Freq" and "ERB" indicators respectively present in POLQA and DIAL were relevant and could help in diagnosing the effect of bandwidth limitation, considered as a part of the Directness sub-dimension. Concerning the effects of (i) reverberation (included in the Directness sub-dimension), quantified by the "Reverb" indicator in POLQA, (ii) dominance of high or low frequencies at fixed bandwidth, characterized by "fc" in DIAL and (iii) timbre distortion, represented by the "Flatness" indicator in POLQA, these effects were not present in our datasets and so could not be assessed objectively. Therefore, future investigation on larger databases is necessary to test the reliability and/or the robustness of these indicators and complete the ongoing study.
! Concerning the "Continuity" dimension, we found that the POLQA "TimeClip" indicator was impacted by other degradations (such as the effect of bandwidth limitation) and poorly performed when tested on the second dataset. Therefore, this indicator was not reliable to quantify the effect of packet/frame loss. On the other hand, the DIAL QDI "rL" was reliable to be used for an advanced diagnostic of speech quality impacted by packet/frame loss. As for the "rI" indicator, it was clearly inappropriate
to characterize the effect of packet/frame loss. As far as the "rA" and "
P
lin" indicators from DIAL were concerned, theyincreased with the degree of packet/frame loss under the use of PLC techniques. Even if the performance of the "rA" indicator
was difficult to assess objectively, it remained a good candidate to characterize additive artifacts. With regard to the "
P
lin"indicator, it could be optimized to better characterize the effect of packet/frame loss. A future work will focus on these two last QDIs to find a metric which could allow checking out their reliability and robustness.
! For the "Noisiness" dimension, our results showed that all indicators, except "NoiseContrast", were relevant to quantify properly the global impact of noise on speech quality. These QDIs were robust enough to diagnose both Speech
Contamination and Additive Noise Level sub-dimensions.
! Finally, for the "Loudness" dimension, the POLQA "Level" indicator and the DIAL "LTL" and "Leq" indicators could cope with the attenuation of speech signal level.
These results can be considered as a potential and valuable contribution to the project called P.AMD (Perceptual Approaches for Multi-Dimensional Analysis) [26] aiming at developing a model which will provide more information about each dimension besides a predicted MOS for these four perceptual dimensions.
In a future work, signals with multiple degradations need to be tested to highlight the relevance of some of these indicators. In the same way, the combination of different indicators must be considered to derive new robust indicators to diagnose perceptual degradations. Furthermore, for the time being, no QDI has been identified to characterize the Musical Noise and the
combine and/or optimize QDIs to perfectly characterize the first three dimensions. Concerning the "Loudness" dimension, it seemed easier to characterize and does not need any priority investigation.
Acknowledgments
The authors wish to thank the following companies for granting us permission to use their SWB subjectively scored databases and publish results based on them: Rohde & Schwarz - SwissQual, TNO, Deutsche Telekom, Netscout-Psytechnics. The use and analysis of the new POLQA/P.863 standard model have been made possible thanks to the support of Rohde & Schwarz - SwissQual and Opticom.
References
[1] V. Danno, "Adaptive Multirate Wide Band, Version 2.0", Source: http://www.gsma.com/newsroom/official-document-ir-36-adaptive-multirate-wide-band, GSM Association, 2013.
[2] ITU-T Rec. P.862, "Perceptual Evaluation of Speech Quality (PESQ): An Objective Method for End-to-End Speech Quality Assessment of Narrow-Band Telephone Networks and Speech Codecs", International Telecommunication Union, CH-Geneva, 2001.
[3] ITU-T Rec. P.800, "Methods for subjective determination of transmission quality", International Telecommunication Union, CH-Geneva, 1996.
[4] ITU-T Rec. P.862.2, "Wideband extension to Recommendation P.862 for the assessment of wideband telephone networks and speech codecs", International Telecommunication Union, CH-Geneva, November 2005.
[5] J. G. Beerends and J. M. Van Vugt, "An extension of PESQ for assessing the quality of speech degraded by severe time clipping and linear frequency response distortions", Joint conference of the German and French acoustical society, DAGA 2004, Strasbourg, 2004.
[6] N. Côté, V. Gautier-Turbin, A. Raake and S. Möller, "Analysis of a quality prediction model for wideband speech quality, the WB-PESQ", in: Proc. 2nd ISCA/DEGA Tutorial and Research Workshop on Perceptual Quality of Systems, pp. 115-122, Berlin, 2006.
[7] M. Wältermann, K. Scholz, A. Raake, U. Heute and S. Möller, "Underlying quality dimensions of modern telephone connections", in: Proc. 9th Intl. Conf. Spoken Language Processing, pp. 2170-2173, USA-Pittsburgh, PA, 2006.
[8] K. Scholz, M. Wältermann, L. Huo, A. Raake, S. Möller and U. Heute, "Estimation of the quality dimension "Directness/Frequency Content" for the instrumental assessment of speech quality", in: Proc. 9th Intl Conf. on Spoken Language Processing (ICSLP), pp. 1523-1523, USA-Pittsburgh, PA, 2006.
[9] M. Wältermann, A. Raake and S. Möller, "Modeling of Integral Quality Based on Perceptual Dimensions-A Framework for a New Instrumental Speech-Quality Measure", in: Voice Communication (SprachKommunikation), ITG Conference on, pp. 1-4, DE-Aachen, 2008.
[10] A. Leman, J. Faure and E. Parizet, "Hybrid Model for Non-Intrusive Speech Quality Evaluation in Telephony Applications", in: Proc. 38th Intl Conf. of the Audio Engineering Society (AES), Piteå, 2010.
[11] B. J. McDermott, "Multidimensional analyses of circuit quality judgments", Journal of the Acoustical Society of America, vol. 45(3), pp. 774-781, 1969.
[12] N. Côté, "Integral and Diagnostic Intrusive Prediction of Speech Quality", Springer, Edition 2011, pp 133-209.
[13] ITU-T Rec. P.863, "Perceptual Objective Listening Quality Assessment (POLQA)", International Telecommunication Union, CH-Geneva, 2011.
[14] J. G. Beerends and J. A. Stemerdink, "A Perceptual Speech-Quality Measure based on a psychoacoustic sound representation", Journal of the Audio Engineering Society, vol. 42(3), pp. 115-123, 1994.
[15] A. Rix, M. Hollier, A. Hekstra and J. G. Beerends, "PESQ, the new ITU standard for objective measurement of perceived speech quality, Part I-Time alignment", Journal of the Audio Engineering Society, vol. 50, pp. 755-764, 2002.
[16] J. G. Beerends, A. P. Hekstra, A. W. Rix and M. P. Hollier, "Perceptual evaluation of speech quality (PESQ): the new ITU standard for end-to-end speech quality assessment part II-psychoacoustic model", Journal of the Audio Engineering Society, vol. 50, pp. 765-778, 2002.
[17] J. G. Beerends, B. Busz, P. Oudshoorn, J. M. Van Vugt, K. Ahmed and O. Niamut, "Degradation decomposition of the perceived quality of speech signals on the basis of a perceptual modeling approach", Journal of the Audio Engineering Society, vol. 55, pp. 1059-1076, 2007.
[18] L. Huo, M. Wältermann, K. Scholz, A. Raake, U. Heute and S. Möller, "Estimation model for the speech-quality dimension "Directness/Frequency Content"", in: IEEE Workshop on Applications of Signal Processing to Audio and Acoustics, New Paltz, NY, October 21-24, 2007.
[19] L. Huo, M. Wältermann, U. Heute and S. Möller, "Estimation of the Speech Quality Dimension "Discontinuity"", in: Voice Communication (SprachKommunikation), ITG Conference on, pp. 1-4, DE-Aachen, 2008.
[20] L. Huo, M. Waltermann, U. Heute and S. Moller, "Estimation model for the speech-quality dimension "Noisiness"", in: Proc 155th Meeting of Acoustical Society of America/ 5th Forum Acusticum/ 9ème Congrès Français d'Acoustique/ 2nd ASA-EAA Joint Conference, Paris, June 29-July 4, 2008.
[21] D. Sen and W. Lu, "Objective evaluation of speech signal quality by the prediction of multiple foreground diagnostic acceptability measure attributes", Journal of the Audio Engineering Society, vol. 131(5), pp. 4087-4103, 2008.
[22] A. Raake, "Speech quality of VOIP: Assessment and Prediction", pp. 74-75, Wiley, Edition 2006.
[23] S. Zielinski, F. Rumsey and S. Bech, "On some biases encountered in modern audio quality listening tests–A review", Journal of the Audio Engineering Society, vol. 56(6), pp. 427–451, June 2008.
[24] IUT-T Rec. P.48, "Specification for an intermediate reference system", International Telecommunication Union, CH-Geneva, 1988.
[25] Q. Fu, K. Yi and M. Sun, "Speech quality objective assessment using neural network", in: Proc. IEEE Int. Conf. on Acoustics, Speech and Signal Processing, vol. 3, pp. 1511-1514, TK-Istanbul, 2000.
[26] ITU-T Contrib. COM 12-61, "Proposed Amendments to Draft Requirement Proposal for P.AMD", Source: Qualcomm, Inc, USA (D. Sen), International Telecommunication Union, CH-Geneva, 2012.
0 1 2 3 4 5 6 7 1 36 71 106 141 Freq Stimulus C1 C2 C3 C4 0 5 10 15 20 25 1 36 71 106 141 B a r k Stimulus C1 C2 C3 C4 ERB (3.a) (3.b) 8 10 11 12 13 14 1 36 71 106 141 B a r k Stimulus C1 C2 C3 C4 Fc 0.7 0.75 0.8 0.85 0.9 0.95 1 36 71 106 141 Stimulus C1 C2 C3 C4 Flatness (3.c) (3.d) 0 100 200 300 400 500 1 36 71 106 141 Stimulus C1 C2 C3 C4 Reverb (3.e)
Fig. 3: Quality degradation indicators for the "DFC" dimension. (3.a) "Freq" (POLQA), (3.b) "ERB" (DIAL), (3.c) "fc" (DIAL), (3.d) "Flatness" (POLQA), (3.e) "Reverb" (POLQA)
0 0.04 0.08 0.12 0.16 0 5 10 15 20 1 36 71 106 R e o f o rL imeC im TimeClip rL C1 C5 C6 1 1.02 1.04 1.06 1.08 1.1 1.12 1 36 71 106 Stimulus C1 C5 C6 F meRep (4.a) (4.b) 0 0.04 0.08 0.12 0.16 0.2 1 36 71 106 R e o f r if im C1 C5 C6 0 0.02 0.04 0.06 0.08 0.1 1 36 71 106 R e o f o im C1 C5 C6 (4.c) (4.d) 0 4 8 12 16 1 36 71 106 Stimulus C1 C5 C6 (4.e)
Fig. 4: Quality degradation indicators for the "Continuity" dimension. (4.a) "TimeClip"(POLQA) in grey line and "rL" (DIAL) in black line, (4.b)
0 5 10 15 20 25 30 0 2 4 6 8 10 12 1 36 71 106 S o n e Stimulus NoS Ln Noise C1 C7 C8 Noise NoS Ln 0 2 4 6 8 10 12 0 5 10 15 20 25 1 36 71 106 Stimulus Plin NoS C1 C7 C8 NoS (5.a) (5.b) 1 1.04 1.08 1.12 1.16 1.2 1 36 71 106 Stimulus C1 C7 C8 NoiseContrast (5.c)
Fig. 5: Quality degradation indicators for the "Noisiness" dimension. (5.a) "Noise"(POLQA) in dashed line, "Ln" in black line and "NoS" in grey line (DIAL), (5.b) "
P
lin" in black line and "NoS" in grey line (DIAL), (5.c) "NoiseContrast"(POLQA)0.99 0.995 1 1.005 1.01 1.015 1.02 1.025 1 36 71 106 Stimulus C1 C9 C10 Level 0 20 40 60 80 0 20 40 60 1 36 71 106 dB S o n e Stimulus LTL Leq C1 C9 C10 LTL Leq (6.a) (6.b)
0 0.2 0.4 0.6 0.8 1 1.2 1 8 15 22 29 36 43 50 Stimulus C17 C18 C19 C20 C21 C22 C23 FrameRepeat (7.a) 0 0.5 1 1.5 2 2.5 3 3.5 1 8 15 22 29 36 43 50 R a te o f a r ti f a c ts Stimulus C17 C18 C19 C20 C21 C22 C23 rA (7.b) 0 2 4 6 8 10 12 1 8 15 22 29 36 43 50 Stimulus C17 C18 C19 C20 C21 C22 C23 (7.c)