HAL Id: hal-00302171
https://hal.archives-ouvertes.fr/hal-00302171
Submitted on 1 Jan 2003
HAL is a multi-disciplinary open access
archive for the deposit and dissemination of
sci-entific research documents, whether they are
pub-lished or not. The documents may come from
teaching and research institutions in France or
abroad, or from public or private research centers.
L’archive ouverte pluridisciplinaire HAL, est
destinée au dépôt et à la diffusion de documents
scientifiques de niveau recherche, publiés ou non,
émanant des établissements d’enseignement et de
recherche français ou étrangers, des laboratoires
publics ou privés.
Double layers in the downward current region of the
aurora
R. E. Ergun, L. Andersson, C. W. Carlson, D. L. Newman, M. V. Goldman
To cite this version:
R. E. Ergun, L. Andersson, C. W. Carlson, D. L. Newman, M. V. Goldman. Double layers in the
downward current region of the aurora. Nonlinear Processes in Geophysics, European Geosciences
Union (EGU), 2003, 10 (1/2), pp.45-52. �hal-00302171�
Nonlinear Processes
in Geophysics
c
European Geosciences Union 2003
Double layers in the downward current region of the aurora
R. E. Ergun1, 2, L. Andersson2, C. W. Carlson3, D. L. Newman4, and M. V. Goldman4
1Department of Astrophysical and Planetary Sciences, University of Colorado, Boulder, CO, USA 2Laboratory for Atmospheric and Space Physics, University of Colorado, Boulder, CO, USA 3Space Sciences Laboratory, University of California, Berkeley, CA, USA
4Center for Integrated Plasma Studies, University of Colorado, Boulder, CO, USA
Received: 3 January 2002 – Revised: 4 April 2002 – Accepted: 5 April 2002
Abstract. Direct observations of magnetic-field-aligned
(parallel) electric fields in the downward current region of the aurora provide decisive evidence of naturally occurring dou-ble layers. We report measurements of parallel electric fields, electron fluxes and ion fluxes related to double layers that are responsible for particle acceleration. The observations sug-gest that parallel electric fields organize into a structure of three distinct, narrowly-confined regions along the magnetic field (B). In the “ramp” region, the measured parallel electric field forms a nearly-monotonic potential ramp that is local-ized to ∼10 Debye lengths along B. The ramp is moving par-allel to B at the ion acoustic speed (vs) and in the same direc-tion as the accelerated electrons. On the high-potential side of the ramp, in the “beam” region, an unstable electron beam is seen for roughly another 10 Debye lengths along B. The electron beam is rapidly stabilized by intense electrostatic waves and nonlinear structures interpreted as electron phase-space holes. The “wave” region is physically separated from the ramp by the beam region. Numerical simulations repro-duce a similar ramp structure, beam region, electrostatic tur-bulence region and plasma characteristics as seen in the ob-servations. These results suggest that large double layers can account for the parallel electric field in the downward current region and that intense electrostatic turbulence rapidly stabi-lizes the accelerated electron distributions. These results also demonstrate that parallel electric fields are directly associ-ated with the generation of large-amplitude electron phase-space holes and plasma waves.
1 Introduction
The purpose of this article is to present a detailed descrip-tion of a direct observadescrip-tion of the parallel electric field in the downward current region of the aurora reported by Er-gun et al. (2001). The earlier report included observations of electron fluxes which, together with the electric field
mea-Correspondence to: R. E. Ergun ([email protected])
surements, strongly suggest that the electric field is self-consistently supported as a “strong” (e18 > Te, i) double layer (Block, 1972; Schamel an Bujarbarua, 1983). The above report (Ergun et al., 2001) also establishes a direct link between parallel electric fields and electron phase-space holes.
Most of the earlier work on parallel electric fields of the aurora focused on the upward current region. Visi-ble auroral arcs were determined to result from energetic (∼10 keV) electrons accelerated earthward by parallel elec-tric fields (Evans, 1974; Shelley et al., 1976; Mozer et al., 1977). Theoretical treatments of the self-consistent struc-ture include weak double layers (Temerin et al., 1982), strong double layers (Block, 1972), anomalous resistivity (Hudson and Mozer, 1978), and parallel electric fields associated with ion cyclotron waves (Ishiguro et al., 1997). However, no generally-accepted theoretical description of these parallel electric fields has emerged, primarily due to lack of detailed observations.
Direct observations of parallel electric fields in the up-ward current region have been reported (Mozer and Kletz-ing, 1998) but corroborative electron and ion fluxes are not available. The reported electric field amplitudes are greater than 100 mV/m and therefore suggest that the parallel tric field is localized. Collisionless, localized, parallel elec-tric fields have also been extensively studied in laboratory experiments (Quon and Wong, 1976). Direct observations in the downward current region (Ergun et al., 2001) now indi-cate that the parallel electric fields are localized to roughly 10 Debye lengths (λD) along B.
Observations also suggest that the parallel electric field sets up strongly unstable electron beams which, in turn, cre-ate a spatially-separcre-ated region of strong electrostatic wave turbulence from which electron phase-space holes emerge (Matsumoto et al., 1994; Ergun et al., 1998a, b). The ac-celerated electron fluxes are substantially modified by the accompanying intense wave turbulence and electron phase-space holes. The wave turbulence modifies the electron dis-tribution to the degree that part of the electron disdis-tribution is
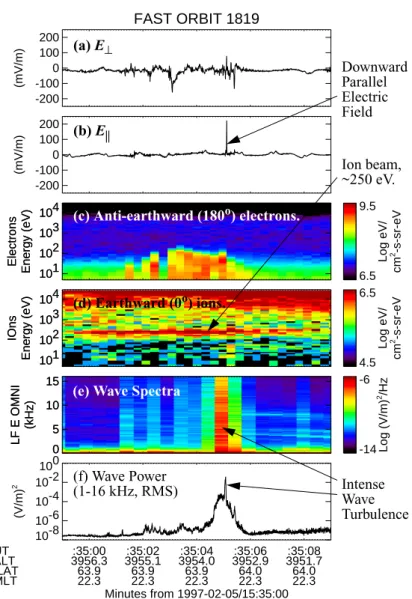
46 R. E. Ergun et al.: Double layers in the downward current region of the aurora FAST ORBIT 1819 -200 -100 0 100 200 (mV/m) -200 -100 0 100 200 (mV/m) 101 102 103 104 Electrons Energy (eV) 101 102 103 104 Electrons Energy (eV) 6.5 9.5 Log eV/ cm 2 -s-sr-eV 101 102 103 104 IOns Energy (eV) 101 102 103 104 IOns Energy (eV) 4.5 6.5 Log eV/ cm 2 -s-sr-eV 0 5 10 15 LF E OMNI (kHz) 0 5 10 15 LF E OMNI (kHz) -14 -6 Log (V/m) 2/Hz :35:00 3956.3 63.9 22.3 :35:02 3955.1 63.9 22.3 :35:04 3954.0 63.9 22.3 :35:06 3952.9 64.0 22.3 :35:08 3951.7 64.0 22.3 Minutes from 1997-02-05/15:35:00 10-8 10-6 10-4 10-2 100 (V/m) 2 UT ALT ILAT MLT (d) Earthward (0o) ions. (c) Anti-earthward (180o) electrons. (a) E⊥ (b) E|| Downward Parallel Electric Field Intense Wave Turbulence (f) Wave Power Ion beam, ~250 eV. (1-16 kHz, RMS) (e) Wave Spectra
Fig. 1. Derived from Ergun et al. (2001) (a) The electric field perpendicular to B (E⊥) and nearly along the velocity of the satellite. (b) The electric field parallel to B. (c) Anti-earthward travelling ion energy flux versus energy and time. The ion fluxes have pitch angles from
−22.5◦to 22.5◦. (d) Earthward travelling electron energy flux versus energy and time. The electron fluxes have pitch angles from 167.5◦to 202.5◦. (e) The spectral power density of the omni-directional electric field from ∼40 Hz to 16 kHz. Each spectra is averaged over ∼0.25 s and has 40 Hz resolution in frequency. (f) The wave power integrated from ∼1 kHz to 16 kHz displayed at 4 ms resolution.
reflected back toward the double layer. These reflected elec-trons may provide a mechanism for interaction between the wave turbulence and the double layer. These data suggest that a self-consistent treatment of the parallel electric field must include substantial modification of the electron distri-bution due to intense wave turbulence.
2 Observations
The observations are from the Fast Auroral SnapshoT (FAST) satellite (Carlson et al., 1998a) which measures elec-tromagnetic fields and charged particle distributions in the earth’s auroral zone. The FAST satellite is in a near-polar orbit with 83◦ inclination. The orbit has a 350 km perigee and a 4175 km apogee. The FAST satellite has electron and ion spectrographs and 3-axis electric field and magnetic field instruments.
Figure 1 displays 10 s of data from the downward current region on the aurora. The spacecraft was in the pre-midnight sector travelling toward the northern polar cap at 5.57 km/s so the horizontal axis in Fig. 1 also may be interpreted as distance spanning approximately 56 km. The top two panels display the (a) perpendicular (to B) electric field (E⊥) closest to the direction of the spacecraft velocity and (b) the parallel electric field (E|| =E ·B/|B|). Immediately below (Panel c) are the anti-earthward electron energy fluxes with pitch an-gles between 157.5◦and 202.5◦. The electron fluxes are plot-ted as an energy-time-flux spectrogram. The energy ranges from 5 eV to 30 keV. Panel (d) is an energy-time-flux spec-trogram of the earthward-moving ion fluxes (−22.5◦to 22.5◦ pitch angles). Panels (e) and (f) display the omni-directional wave electric field in the frequency range from ∼1 kHz to 16 kHz. Panel (e) displays the spectral power density as a function of frequency (40 Hz resolution) and time (0.25 s
res-0 20 40 60 80 100 Time (ms) -4 -2 0 2 4 6 8 Probe Potential (V) Probe 1 Probe 5 Probe 8 S/C Velocity B Structure Velocity ~10 km/s 5.57 km/s 6.5o ∆t85 = 1.7 + 0.4 ms ∆t18 = 1.9 + 0.5 ms ∆t15 = 3.4 + 0.5 ms 29 m from SC 49o Apparent Velocity ~12 km/s Correlation delay: (-) Probe 1 (-) Probe 8 (+) Probe 5 SC Probe 9: 4 m out of plane.
Fig. 2. (Top) The signals on three spatially separated probes during
the E||event. The dotted line is the negative of the Probe 1 signal,
the solid line is the negative of the Probe 8 signal, and the dotted solid line is the Probe 5 signal. (Bottom) The orientation of the spacecraft and the position of the probes during the E||event. The
shaded lines are perpendicular to the motion of the structure. Probes 5 and 8 are 6.5◦from perpendicular to Probe 1 as indicated by the dashed line.
olution). Panel (f) plots the RMS integrated wave power at 4 ms resolution.
At ∼15:35:03 UT, E⊥ reaches −150 mV/m (Fig. 1a) and the 10 eV to 100 eV anti-earthward electron fluxes increase (Fig. 1c). These observations are characteristic of the down-ward current region of the aurora and indicate that a parallel electric field is on the magnetic flux tube and earthward of the spacecraft (Carlson et al., 1998b; Ergun et al., 1998c). The 200 mV/m (positive is earthward in the northern hemi-sphere) excursion in E||at ∼15:35:05 UT (Fig. 1b), however, is extremely unusual. At the same time, the electron fluxes abruptly decrease (Fig. 1c) and the wave power briefly in-creases by nearly two orders of magnitude as indicated by the spike in Fig. 1f and the broad band increase in wave spectral power density in Fig. 1e.
2.1 Electric field observations
One of the first problems that needs to be resolved is the spatial-temporal nature of the large-amplitude spike in E||.
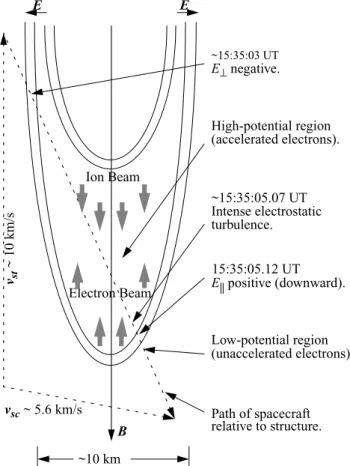
E E B vsc ~ 5.6 km/s vst ~ 10 km/s Path of spacecraft relative to structure. ~15:35:03 UT E|| positive (downward). Electron Beam High-potential region E⊥ negative. 15:35:05.12 UT ~15:35:05.07 UT Intense electrostatic turbulence. ~10 km (accelerated electrons). Low-potential region (unaccelerated electrons). Ion Beam
Fig. 3. A cartoon interpreting the observations in Fig. 1.
Figure 2 shows the signals from three individual probes and the magnetic orientation of spacecraft during the event. The magnetic field, pointing downward in the diagram, was within 3◦of lying in the spin plane of the satellite. The space-craft is moving at 5.57 km/s toward the right in the diagram; its velocity is almost perpendicular to B with a small com-ponent along B and downward.
The horizontal axis of the top panel is greatly magnified in time encompassing only 100 ms. The spike in E||first ap-pears on Probe 1, next on Probe 8, the last on Probe 5. The delay between the peaks of Probe 1 and Probe 8 appear to be ∼5 ms while the time delay derived from correlating the two signals over a 20 ms period (40 ms to 60 ms in Fig. 2) is ∼3.4 ms. The direction of motion of the structure in the spacecraft frame is clearly from the bottom right toward the top left in the diagram. The velocity of the structure derived from the correlation delay is 12.5 m/s. In an inertial frame, the structure velocity is nearly anti-parallel to B at ∼10 km/s. Accounting for uncertainties in the measurements, the elec-tric field observations are consistent with an E|| structure travelling anti-earthward within 20◦of B and with a velocity between 8 km/s and 11 km/s. This speed is consistent with the estimated ion acoustic speed on the low-potential side (see later). Using these speeds, the net potential of the E|| structure is determined to be between 21 V and 30 V.
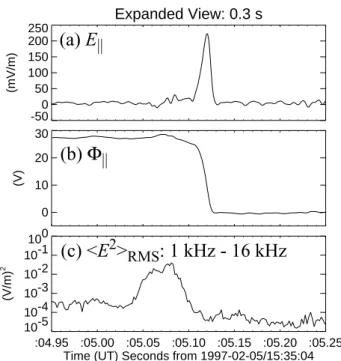
48 R. E. Ergun et al.: Double layers in the downward current region of the aurora Expanded View: 0.3 s -50 0 50 100 150 200 250 (mV/m) 0 10 20 30 (V) :04.95 :05.00 :05.05 :05.10 :05.15 :05.20 :05.25 Time (UT) Seconds from 1997-02-05/15:35:04 10-5 10-4 10-3 10-2 10-1 100 (V/m) 2
(a) E
||(c) <E
2>
RMS: 1 kHz - 16 kHz
(b)
Φ
||Fig. 4. An expanded view of the E||event. (a) E||. (b)R E||v||dt. v|| is assumed to be 10 km/s. (c) The wave power integrated from ∼1 kHz to 16 kHz displayed at 4 ms resolution.
describe our methods of validating the observations. The FAST electric field instrument uses a set of four, 8-cm di-ameter, high impedance spherical probes to measure the vec-tor field (Fig. 2). In the spin plane of the satellite, the electric field is derived from long-baseline (56 m and 29 m) dipoles which measure the instantaneous (independent of satellite spin phase) electric field. From empirical analysis, we find that the accuracy of the measurement depends on the plasma properties, in particular, the plasma density. With plasma density (ne) >5 cm−3, the spin-averaged accuracy is ±1 mV/m and the instantaneous accuracy is ±10 mV/m if (1) none of the probes are magnetically conjunctive to the space-craft, (2) none of the probes is in dc saturation (±50 V), (3) none of the probes in is ac saturation (±300 mV/m), (4) no bias or mode switching was occurring at the time, and (5) the spacecraft was not crossing the terminator. Such conditions were met during the event.
The spin-axis component of E is measured with far less accuracy (±200 mV/m with ne > 5 cm−3) because of the short baseline (4 m). The FAST mission, however, was de-signed such that its spin plane is often nearly coplanar (within 6◦) of the plane formed by the magnetic field and the space-craft velocity, so the instantaneous parallel electric field does not greatly depend on the short baseline measurement. At the time of the event, the magnetic field was 2.7◦ from the spin plane. We conclude that the 200 mV/m spike in E||was measured with an accuracy of ±20 mV/m.
Figure 3 displays a cartoon interpreting the observations in Fig. 1. The thick, vertical solid line represents the magnetic field and the thin, “U”-shaped solid lines represent
equipo-tential contours of a two-dimensional structure that carries a parallel electric field. The dashed lines indicate the velocity of the spacecraft, the velocity of the structure, and the rela-tive path of the spacecraft through the structure. The space-craft entered the structure at ∼15:35:03 UT when the electric field was perpendicular to B as attested by the negative spike in E⊥and the appearance of anti-earthward electron fluxes. Although the actual spacecraft velocity was nearly perpen-dicular to B, the apparent path of the spacecraft relative to the structure was at an oblique angle due to the motion of the structure as shown in Fig. 3. The spacecraft then exited the potential structure 2 s later at ∼15:35:05 UT through a re-gion which had a parallel electric field. Thus, the spacecraft crossed the parallel electric field from a region of accelerated electrons (high-potential side) into the region of unacceler-ated electrons (low-potential side).
2.2 Wave observations
Figure 4 displays (a) an expanded view of E||, (b) the poten-tial (8||) derived from integrating E||, and (c) the broad band electric field wave amplitude from 1 kHz to 16 kHz. The po-tential ramp was calculated with the assumption that the rel-ative velocity between the spacecraft and the parallel electric field structure was 10 km/s. The net potential is ∼27 V.
A salient feature of the figure is the substantial increase in the wave power that was observed clearly before the parallel electric field. There was no corresponding increase magnetic field wave power, and hence we conclude the wave emis-sions were primarily electrostatic. The most intense wave power occurs over a ∼50 ms period. Under the interpretation diagrammed in Fig. 3, the intense wave emissions are on the high-potential side of the parallel electric field and associ-ated with the accelerassoci-ated electron beam. The energy density, W = ε◦E2/2neTe ∼=10−3to 10−2(ignoring the magneto-spheric electrons), indicates strong modification of the elec-tron distribution and possibly nonlinear behavior. Far less wave energy is seen on the low potential side of the double layer.
The intense wave emissions were broad banded with the frequency extending up to and possibly over 16 kHz (Fig. 1e). The plasma frequency was ∼40 kHz. No wave-form data are available for this event, but Ergun et al. (2001) found that the spectral signature of the wave emissions was that of electron phase-space holes. This interpretation has since been verified by numerical simulations (Newman et al., 2001) and subsequent observations (Andersson et al., 2002). The electron phase-space holes in the downward cur-rent region of the aurora were seen to travel with the elec-tron beam and thus explain the wave turbulence beginning at ∼15:35:02 UT.
2.3 Electron observations
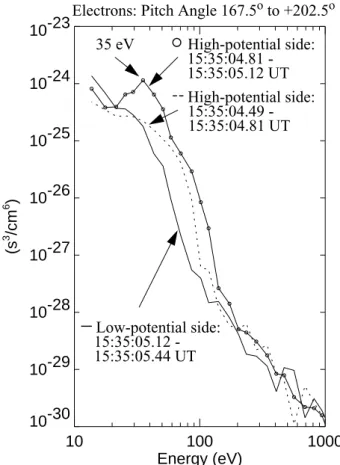
Figure 5 displays the measured electron distributions on the low-potential side (solid line) and high-potential side (cir-cles and dashed lines) of the parallel electric field. In all of
10
100
1000
Energy (eV)
10
-30
10
-29
10
-28
10
-27
10
-26
10
-25
10
-24
10
-23
(s
3/cm
6)
High-potential side:
15:35:04.81
-Low-potential side:
15:35:05.12
-35 eV
High-potential side:
15:35:04.49
-15:35:05.44 UT
15:35:05.12 UT
15:35:04.81 UT
Electrons: Pitch Angle 167.5
oto +202.5
oFig. 5. Electron distributions surrounding the parallel electric field.
The solid line is the distribution on the low-potential side. The cir-cles indicate the distribution closest to the beam region. An unstable peak is visible. The dashed line is the distribution on the high po-tential side farther from the double layer.
the distributions, there is a tenuous, ∼1 cm−3, hot, ∼1.2 keV, electron population indicating a magnetic connection to the central plasma sheet that is not apparent in Fig. 5, but can be seen as the blue background in Fig. 1. This population is not significantly perturbed by the parallel electric field.
The low-potential or source distribution (Fig. 5, solid line) displays a heated population with a density ne ∼ 5 cm−3 and a parallel temperature Te ∼ 6 eV (derived from the second moment of the electron distribution in the energy range from 5 eV to 100 eV) that is drifting anti-earthward at ∼1 km/s. Langmuir probe measurements (not displayed), however, suggest that the source electron distribution has a dense (ne ∼50 cm−3±a factor of two) core with a temper-ature that is below the energy range of the electron analyzer (<5 eV). Thus, the electron distribution on the low potential side is comprised of three populations: a cold, dense core, a “heated” (Te ∼ 6 eV) population and a “hot” (∼1 keV), tenuous plasma-sheet population. The second moment of the three combined populations yields an electron temperature of ∼25 eV which indicates that the ion acoustic speed in an O+ plasma is roughly 12 km/s (within a factor of 2).
The high-potential or accelerated electron distribution
(cir-High-
Low-Potential Potential
Side Side
∆ξ ~ 30 eV (One count level)
Pitch Angle: -45o to +45o (Down-going)
Fig. 6. Ion energy fluxes measured on both sides of the parallel
electric field. The circles represent the fluxes on the high-potential side and the triangles represent the fluxes on the low potential side. The ions fluxes are consistent with a 30 V potential. The one count level is indicated on the plot. Measured flux levels under ∼ 106 (cm-s-ster)−1have large statistical uncertainties.
cles) shows a dramatic increase in fluxes with a peak at ξ =35 ± 4 eV in energy, indicating a net energy gain (1ξ ) of roughly 30 eV. The moments of the distribution in the en-ergy range from 5 eV to 100 eV yield a parallel temperature of ∼12 eV and a density of 12 cm−3(accurate to a factor of two). The perpendicular temperature is less than 2 eV. Within error, 1ξ agrees with the net potential (18 = 21 eV to 30 eV) derived from the electric field observations. This agreement strongly supports the interpretation diagramed in Fig. 3.
The electron distribution farther from the parallel electric field on the high-potential side (Fig. 5, dashed line) has no peak, rather, it appears as if heated and drifting. The acceler-ated electron distribution has a significant phase-space den-sity with a positive parallel velocity (see Fig. 4c, Ergun et al., 2001) indicating that part of the population is travelling back toward the double layer. This electron population, created by the wave turbulence, may affect the structure and dynamics of the double layer.
2.4 Ion observations
The ion energy fluxes also indicate several different popula-tions. Energy fluxes at pitch angels from −22.5◦ to 22.5◦ (travelling earthward) are displayed in Fig. 1d. The most
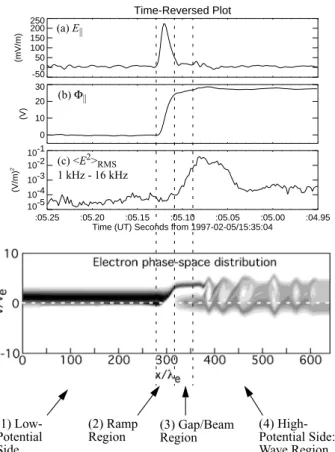
50 R. E. Ergun et al.: Double layers in the downward current region of the aurora Time-Reversed Plot -50 0 50 100 150 200 250 (mV/m) 0 10 20 30 (V) :04.95 :05.00 :05.05 :05.10 :05.15 :05.20 :05.25
Time (UT) Seconds from 1997-02-05/15:35:04 10-5 10-4 10-3 10-2 10-1 (V/m) 2
(1) Low- (2) Ramp (3) Gap/Beam (4)
High-Potential Region Region Potential Side:
Side Wave Region
(a) E||
(c) <E2>RMS (b)Φ||
1 kHz - 16 kHz
Fig. 7. The structure of the parallel electric field region. The top
panels are identical to those in Fig. 4 with the time axis reversed. The bottom panel is a snapshot of the electron phase-space from an numerical simulation (Newman et al., 2001). In this figure, the hor-izontal axis (x) is the distance anti-parallel to the magnetic field in units of Debye lengths (derived from the low-potential side), increasing from low-altitude (low potential side) to high-altitude (high-potential side). The ramp region, the beam region and the turbulent region are seen in both observation and simulation.
energetic fluxes (>1 keV) indicate a hot (∼5 keV) plasma sheet population. Not visible in Fig. 1d are weak ion fluxes (∼3 × 105cm−2s−1sr−1) at energies on the order of 10 eV with nearly perpendicular pitch angles. The perpendicular fluxes were detected after 15:35:05 UT indicating ion con-ics on the low-potential side of the double layer. The ion distributions associated with double layers are discussed by Andersson et al. (2002).
The most unusual feature in Fig. 1d is the enhancement at ∼250 eV that is visible throughout the plot. We examine these fluxes in more detail in Fig. 6 which plots the ion en-ergy flux on the high- and low-potential sides of the double layer. One can see a clear peak in energy flux at ∼250 eV that was also visible in Fig. 1d. We interpret these fluxes as evi-dence of an approximately 250 eV parallel electric field that is anti-earthward of the spacecraft. Under this interpretation, the observed parallel electric field carries only part of the to-tal potential on the flux tube. Figure 3 includes a U-shaped potential structure, anti-earthward of the satellite path, to
ac-count for the ion observations.
The horizontal axis in Fig. 6 is linear in energy which al-lows one easily to see a ∼30 eV increase in energy between the high-potential side and the low-potential side. The one-count level of the instrument, indicated in the figure by a dashed line, is such that values under 106(cm-s-ster)−1have large statistical uncertainties. Thus, the earthward-travelling ions see the same energy gain as the anti-earthward-travelling electrons, both of which are consistent with the observed par-allel electric fields.
3 Discussion
The observed parallel electric field structure reaches a rel-atively high amplitude (200 mV/m) and endures for ∼10 to ∼20 ms (Fig. 4). Using 10 km/s as relative speed along B between the electric field structure and the spacecraft, the size of the structure is between 100 and 200 m. The plasma parameters on the low-potential side of the parallel electric field are such that λD∼5 m if one considers all electron pop-ulations (the magnetospheric electrons increase λD). On the high-potential side, λD ∼20 m. Thus, the ramp region ex-tends between 5 and 40 λD along B. The local ion-acoustic speed was estimated to be ∼12 km/s on the low-potential side and ∼23 km/s on the high-potential side (Ergun et al., 2001). The scale size and the speed of the observed electric field structure are consistent with the parameters of a strong dou-ble layer (Block, 1972).
A numerical simulation, designed to investigate the ob-served parallel electric fields illustrates the basic structure of the ramp, beam and turbulence regions. The details of the simulation are described elsewhere (Newman et al., 2001) so we provide only a very brief description. The simulation used a 1-D, open boundary Vlasov code with dynamic trons. Figure 7 (bottom panel) displays a snapshot of an elec-tron distribution near the end of a the simulation that started with a density depression in the presence of a current im-posed through boundary injection. The simulation has ions drifting to the left at the ion thermal speed and the electrons are drifting to the right. Thus, Fig. 7 is in the rest frame of the double layer, that is, moving at the ion acoustic speed.
Figure 4 is replotted at the top of Fig. 7 with the horizontal axis reversed so electrons are accelerated from the left to-ward the right as in the numerical simulation. The evolved state of the numerical simulation is qualitatively similar to the observations. The regions of interest are marked on the plot with vertical dashed lines. On the low-potential (left) side, the electrons are undisturbed and drifting though the double layer. Ions are accelerated into the low-potential side through the double layer but cause only low-level turbulence. The ramp region is confined to roughly 10 λD, carries a po-tential (18) ∼3–5 times the initial electron thermal energy, and appears nearly monotonic. Immediately to the right of the ramp (high-potential side) is an unstable electron beam. The convective instability can exist indefinitely but extends over a distance less than 10 λD. To the right of the beam
re-gion, the beam is rapidly stabilized by intense turbulence and electron phase-space holes. The electron phase-space holes propagate toward the right, away from the double layer in the same direction as the accelerated electrons.
Although the double layer and intense electrostatic turbu-lence are spatially separated, they can interact by means of the stagnating electrons. Both the observations and the nu-merical simulations indicate that the intense wave turbulence creates an electron population that is moving toward the dou-ble layer. This population, in turn, is reflected by the doudou-ble layer back into the wave turbulence region. The stagnating electrons appear to set up the two-stream instability which can lead to rapid growth of electron phase-space holes (Gold-man et al., 1998). This population also must be considered in a self-consistent solution of the double layer.
The above observations suggest that multiple double lay-ers may lie on a magnetic flux tube. The electrons on the low-potential side of the double layer appear to be a rela-tively undisturbed ionospheric population while the down-going ions indicate a parallel potential of ∼250 V on the same flux tube but at higher altitude. The numerical simu-lations and the observations indicate an electron acceleration of approximately 3 to 5 times the initial electron thermal ve-locity (ve), as measured on the low-potential side. Thus a second strong double layer may be responsible for the ion acceleration.
The concept of multiple double layers gets strong support from the observations reported by Andersson et al. (2002). In those double layer observations, the low-potential electron population was drifting into the double layer with ∼50 eV initial temperature before experiencing a 700 V acceleration. The source electrons appear to have been accelerated by a double layer earthward of the spacecraft.
4 Conclusions
We presented direct observations of the parallel electric field in the downward current region of the auroral zone. The ob-servations are consistent with a strong double layer moving along B at the ion acoustic speed in the same direction of the accelerated electrons. The potential drop extends ∼10 λD along B. Intense electrostatic emissions are spatially sepa-rated from the structure on the high-potential side. Electron phase-space holes emerge from the wave turbulence associ-ated with the double layer.
The potential structure accelerates electrons to several times their initial thermal velocity which results in a factor of 10 gain from the initial thermal energy. Intense quasi-electrostatic wave emissions and electron phase-space holes rapidly modify the accelerated electron distribution. Part of the electron distribution (stagnating electrons) is reflected back into the double layer through interaction with the in-tense wave turbulence. Thus, the inin-tense wave turbulence may interact with the double layer through this stagnating electron population.
Ions are accelerated into a beam in travelling in the oppo-site direction of the electron beam. The energetic ion fluxes suggest that parallel electric fields on a magnetic flux tube are a localized to one or several strong double layers. There are, however, several open questions that need to be resolved including how the electrostatic turbulence and double layers interact through the stagnating electrons, how moving dou-ble layers interact with heated ions, the role of the acceler-ated ions and if they disrupt the double layer, and how sev-eral moving double layers combine to form the large-scale, quasi-static potential structure.
Acknowledgements. This work was supported by NASA grant
NAG5-3596.
References
Andersson, L., Ergun, R. E., Newman, D. L., McFadden, J. P., and Carlson, C. W.: Characteristics of parallel electric fields in the downward current region of the aurora, Phys. Plasma, in press, 2002.
Block, L. P.: Potential double layers in the ionosphere, Cosmic Electrodyn., 3, 349, 1972.
Carlson, C. W., Pfaff, R., and Watzin, J. G.: The Fast Auroral Snap-shoT (FAST) mission, Geophys. Res. Lett., 25, 2013, 1998a. Carlson, C. W., McFadden, J. P., Ergun, R. E., Temerin, M., Peria,
W., Mozer, F. S., Klumpar, D. M., Shelly, E. G., Peterson, W. K., Moebius, E., Elphic, R., Strangeway, R. J., Cattell, C., and Pfaff, R.: FAST observations in the downward auroral current region: Energetic up-going electrons beams, parallel potential drops, and ion heating, Geophys. Res. Lett., 25, 2017, 1998b.
Ergun, R. E., Carlson, C. W., McFadden, J. P., Mozer, F. S., De-lory, G. T., Peria, W., Chaston, C. C., Temerin, M., Elphic, R., Strangeway, R. J., Pfaff, R., Cattell, C. A., Klumpar, D., Shelly, E., Peterson, W., Moebius, E., and Kistler, L.: FAST satellite ob-servations of large-amplitude solitary structures, Geophys. Res. Lett., 25, 2041, 1998a.
Ergun, R. E., Carlson, C. W., McFadden, J. P., Mozer, F. S., Muschi-etti, L., and Roth, I.: Debye-scale plasma structures associated with magnetic-field-aligned electric fields, Phys. Rev. Lett., 81, 826, 1998b.
Ergun, R. E., Carlson, C. W., McFadden, J. P., Mozer, F. S., De-lory, G. T., Peria, W., Chaston, C. C., Temerin, M., Elphic, R., Strangeway, R. J., Pfaff, R., Cattell, C. A., Klumpar, D., Shelly, E., Peterson, W., Moebius, E., and Kistler, L.: FAST satellite observations of electric field structures in the auroral zone, Geo-phys. Res. Lett., 25, 2025, 1998c.
Ergun, R. E., Su, Y.-J., Andersson, L., Carlson, C. W., McFadden, J. P., Mozer, F. S., Newman, D. L., Goldman, M. V., and Strange-way, R. J.: Direct observation of localized parallel electric fields in a space plasma, Phys. Rev. Lett., 87, 045003, 2001.
Evans, D. S.: Precipitation electron fluxes formed by a magnetic-field-aligned potential difference, J. Geophys. Res., 79, 2853, 1974.
Goldman, M. V., Oppenheim, M. M., and Newman, D. L.: PIC simulations of bipolar wave structures driven by dense beams in the auroral ionosphere, in: Physics of Space Plasmas 15, (Eds) Chang, T. and Jasperse, J. R., 115, Cambridge, MA, 1998.
52 R. E. Ergun et al.: Double layers in the downward current region of the aurora
Hudson, M. K. and Mozer, F. S.: Electrostatic shocks, double lay-ers, and anomalous resistivity in the magnetosphere, Geophys. Res. Lett., 5, 131, 1978.
Ishiguro, S., Sato, T., Takamaru, H., and The Complexity Simu-lation Group: V-shaped dc potential structure caused by current-driven electrostatic ion-cyclotron instability, Phys. Rev. Lett., 78, 4761, 1997.
Matsumoto, H., Kojima, H., Miyatake, T., Omura, Y., Okada, M., Nagano, I., and Tsutsui, M.: Electrostatic solitary waves (ESW) in the magnetotail: BEN wave forms observed by GEOTAIL, Geophys. Res. Lett., 21, 2915, 1994.
Mozer, F. S., Carlson, C. W., Hudson, M. K., Torbert, R. B., Parady, B., Yatteau, J., and Kelley, M. C.: Observations of paired elec-trostatic shocks in the polar magnetosphere, Phys. Rev. Lett., 38, 292, 1977.
Mozer, F. S. and Kletzing, C. A.: Direct observation of large,
quasi-static, parallel electric fields in the auroral acceleration region, Geophys. Res. Lett., 25, 1629, 1998.
Newman, D. L., Goldman, M. V., Ergun, R. E., and Mangeney, A.: Formation of Double Layers and Electron Holes in a Current-Driven Space Plasma, Phys. Rev. Lett., 87, 255001, 2001. Quon, B. H. and Wong, A. Y.: Formation of potential double layers
in plasmas, Phys. Rev. Lett., 37, 1393, 1976.
Schamel, H. and Bujarbarua, S.: Analytical double layers, Phys. Fluid, 26, 190, 1983.
Shelley, E. G., Sharp, R. D., and Johnson, R. G.: Satellite observa-tions of an ionospheric acceleration mechanism, Geophys. Res. Lett., 3, 654, 1976.
Temerin, M., Cerny, K., Lotko, W., and Mozer, F. S.: Observations of double layers and solitary waves in the auroral plasma, Phys. Rev. Lett., 48, 1175, 1982.