HAL Id: hal-00299359
https://hal.archives-ouvertes.fr/hal-00299359
Submitted on 4 Aug 2006
HAL is a multi-disciplinary open access
archive for the deposit and dissemination of
sci-entific research documents, whether they are
pub-lished or not. The documents may come from
teaching and research institutions in France or
abroad, or from public or private research centers.
L’archive ouverte pluridisciplinaire HAL, est
destinée au dépôt et à la diffusion de documents
scientifiques de niveau recherche, publiés ou non,
émanant des établissements d’enseignement et de
recherche français ou étrangers, des laboratoires
publics ou privés.
project ”Risk Map Germany”
M. Müller, S. Vorogushyn, P. Maier, A. H. Thieken, T. Petrow, A. Kron, B.
Büchele, J. Wächter
To cite this version:
M. Müller, S. Vorogushyn, P. Maier, A. H. Thieken, T. Petrow, et al.. CEDIM Risk Explorer ? a
map server solution in the project ”Risk Map Germany”. Natural Hazards and Earth System Science,
Copernicus Publications on behalf of the European Geosciences Union, 2006, 6 (5), pp.711-720.
�hal-00299359�
Nat. Hazards Earth Syst. Sci., 6, 711–720, 2006 www.nat-hazards-earth-syst-sci.net/6/711/2006/ © Author(s) 2006. This work is licensed under a Creative Commons License.
Natural Hazards
and Earth
System Sciences
CEDIM Risk Explorer – a map server solution in the project “Risk
Map Germany”
M. M ¨uller1,3, S. Vorogushyn1,3, P. Maier1,3, A. H. Thieken1, T. Petrow1,3, A. Kron2,3, B. B ¨uchele2,3, and J. W¨achter1
1GeoForschungsZentrum Potsdam (GFZ), Data Center & Section Engineering Hydrology, Telegrafenberg, 14473 Potsdam,
Germany
2Department for Water and River Basin Management, Chair of Water Resources, Hydraulic and Rural Engineering,
University of Karlsruhe, Germany
3Center for Disaster Management and Risk Reduction Technology (CEDIM), Karlsruhe, Germany
Received: 9 November 2005 – Revised: 28 July 2006 – Accepted: 28 July 2006 – Published: 4 August 2006
Abstract. The project “Risk Map Germany” at the Cen-ter for DisasCen-ter Management and Risk Reduction Technol-ogy (CEDIM) aims at visualizing hazards, vulnerabilities and risks associated with natural and man made hazards. CEDIM as an interdisciplinary project unified various exper-tise like earthquake, storm and flood disaster research. Our aim was to visualize the manifold data exploration in the-matic maps. The implemented Web-GIS solution “CEDIM Risk Explorer” represents the map visualizations of the dif-ferent risk research. This Web-GIS integrates results from interdisciplinary work as maps of hazard, vulnerability and risk in one application and offers therefore new cognitions to the user by enabling visual comparisons. The present pa-per starts with a project introduction and a literature review of distributed GIS environments. Further the methods of map realization and visualization in the selected technical solution is worked out. Finally, the conclusions give the perspectives for future developments to the “CEDIM Risk Explorer”.
1 Introduction
1.1 Risk atlas as an output of the project “Risk Map Ger-many”
The main aim of the project “Risk Map Germany” in the Cen-ter for DisasCen-ter Management and Risk Reduction Technology (CEDIM) is to generate risk maps associated with natural and man made hazards in Germany. Different risks were to be an-alyzed, compared and finally synoptically visualized in form of cartographic presentations. Within CEDIM, risks due to
Correspondence to: M. M¨uller
the natural threats earthquakes, flooding and windstorms as well as man-made risks have been investigated.
The research revealed a range of results such as vulnerabil-ity, hazard and risk maps of the different threats at different spatial scales. In order to consolidate the project results in a consistent way, a uniform accurate cartographic style was to be developed and the various maps were to be represented to the public in an atlas. It was decided to publish an elec-tronic atlas using the Internet and in doing so reach a vari-ety of users at low costs. Our research work is focused on the possibility of a synoptical representation of the generated thematic maps. Therefore, this paper presents the results of a working group whose aims were
1. formulating proposals for the cartographical visualiza-tion of different themes,
2. compiling the CEDIM results and classification in map themes, and
3. implementing a technical solution for the online map publication that allows the user to compare different risks.
The paper is organized as follows: At first, an introduction of GIS applications for the Internet especially for the World Wide Web (WWW) and mapping application with a focus on disaster and risk management is given. Section 2 discusses different methods of cartographic visualizations, the methods we used for this study and further the map themes classifica-tion. The general and technical requirements for the visual-izations within the project “Risk Map Germany” are outlined in Sect. 3. An elaborative conclusion with focus on future de-velopments in Sect. 4 closes this paper.
1.2 GIS applications for the Internet
As Taylor (1994) predicted, new ways of cartographic vi-sualization were explored and discovered in the last years due to the digital innovations. In this context Geographic Information Systems (GIS) play a leading role for the visu-alizing of spatial data. GIS are meanwhile a widely spread tool for the handling of all kind of geodata. Besides visu-alization, GIS are well known for storing, manipulating and analyzing of spatial data. Several years ago GIS were used as stand-alone applications and limiting the number of users who have access to a GIS software (Peng and Tsou, 2003). With the use of Web technology GIS concepts become more open, accessible and mobile (Dragicevic, 2004). A grow-ing number of GIS software developers equip their software with online functionalities so that the Internet could become the general platform for the distribution of geo-information (Green und Bossomaier, 2002). Different terms have been used for the developments of GI-Systems for the World Wide Web: they called e.g. Distributed Geographic Information (DGI) (Plewe, 1997), Internet GIS (Peng, 1999), On-line-GIS or Web-based On-line-GIS. These terms differ sometimes also in their meaning, but in general they all deal with Web tech-nologies. However, it seems the simple term Web-GIS has become widely accepted.
Web-GIS facilitate the open use of GIS to spatial data ac-cess and dissemination, to spatial data exploration and geo-visualization and to spatial data processing and ergo it con-tributes to the democratization of spatial data (Dragicevic, 2004). Today Web-GIS are mostly not complete GI-Systems in contrast to Desktop-GIS which have a broad range of func-tionalities. There exist a great number of applications which focus on various aspects of GIS. For example, Web-GIS applications span from Web mapping applications for the distribution of static maps like the PCL Map Collection of the University Texas (PCL, 2006), to Web-GIS products which include multimedia (Cartwright, 1999), to the realiza-tion of electronic atlases like the Internet atlas of Switzerland (Richard, 2000). Other kinds of Web-GIS applications are Mobile-GIS solutions that can be found in cellular phones or mobile navigators etc. These Web-GIS provide in most cases just few GIS-functionalities and therefore they can be regarded as pure information systems.
Distributed GIS is a network-centric approach of GIS which deliver geoinformation and analysis tools over the In-ternet. Data and processing tools can be integrated locally in a Web client like a standard Web browser and provide func-tionalities like a real Desktop GIS. Different type of data and analysis tools are allocated on different servers. Such tributed GIS uses the advantage of the Internet as a giant dis-tributed system (Peng and Tsou, 2003). A disdis-tributed GIS consists of several open and interoperable components which can be requested by users to establish so called GI services. This enables a number of service possibilities like searching for geospatial data, spatial data sharing and on-line
process-ing or location based services (LBS). In the disaster and risk management a few projects implementing a distributed GIS were realized. For instance, Latini and K¨obben (2005) devel-oped a landslide inventory tool which enables municipalities to sketch landslides without having a GI-System. Further-more, a few projects are in progress, staying in a concep-tual stage like a distributed spatial data library (Hunter, 2005) or a content based image search for satellite images (G¨obel, 2005).
To enable these interoperable GI-Services the compliance of standards like the International Standardisation Organisa-tion (ISO, 2003) and the Open Geospatial Consortium (OGC, 2002) specifications are compulsory conditions. These de-velopments in software architecture enable users in an open distributed GIS service architecture to search, access and re-trieve geodata and GIS analysis components from any server (Peng and Tsou, 2003). Current research efforts focus there-fore on the interoperability of geoinformation. For example, the project ORCHESTRA, funded by the European Commis-sion, will improve the interoperability in the multi-risk man-agement by implementing open service oriented software ar-chitecture (Annoni et al., 2005).
Nevertheless, designed maps play an important role in a Web-GIS environment as well (Kraak, 2004). Atlases tradi-tionally consist of a collection of maps which follow certain systematics, e.g. the same scale or the same theme. This def-inition also applies to a so-called electronic or digital atlas. In this work we use the term digital atlas as a synonym to Web-GIS.
Several applications of digital atlases which deal with the topics vulnerability, hazards and risks have already been implemented in the World Wide Web. For instance, there are some Web solutions containing hazard maps as a main component like the Multi-hazard Mapping Initiative by the Federal Emergency Management Agency (FEMA, 2005) in Washington D.C. or the interactive hazard atlas “CatNet” by the Swiss Re reinsurance company (SWISSRE, 2005). An-other initiative is the “Coastal Risk Atlas” by the National Oceanic & Atmospheric Administration dealing with topics of vulnerability and risk (NOAA, 2005). A comprehensive elaboration of international initiatives on this topic is given by Maier (2005).
However, most of the currently available WWW solutions either focus on only one (natural) hazard or only on hazard or vulnerability/risk maps. In contrast, the “CEDIM Risk Explorer” combines three thematic map types, i.e. hazard, vulnerability and risk maps, for several hazards types in one application. In this context, the application was carried out as an interdisciplinary information platform. The challenge was among others to harmonize the heterogeneous data sets and the different results to common map visualization for Germany, for more details on harmonization see K¨ohler et al. (2006). At the end a comparative view of the different risks should be provided in the Web-GIS “CEDIM Risk Ex-plorer”.
M. M¨uller et al.: CEDIM Risk Explorer 713
Table 1. Data properties of hazard, vulnerability and risk maps in CEDIM and their suitable graphic compositions (Maier, 2005).Tab. 1: Data properties of hazard, vulnerability and risk maps in CEDIM and their suitable graphic compositions (MAIER 2005).
Data characteristics Suitable graphic compositions
map/properties
discreta continua qualitative quantitative absolute rela
tive
graduated symbol map choropleth/dasymetric map
filled-in iso
line map
smooth statistical surface stepped statistical surface multivar
iate diagra m ma p small mu ltiples Hazard Map — 9 — 9 9 — — — 9 9 — — (9) Vulnerability Map 9 — — 9 — 9 9 9 — — 9 9 9 Risk Map 9 — — 9 — 9 9 9 — — 9 9 9
9= yes, — = no,(9) = partly suitable
1 2 Risk maps and cognate map compositions
2.1 Methods of visualization
The visualization of spatial data, especially according to cartographic standards, was a research subject for the last decades. The evolution of the communication-oriented car-tographic research towards the recent map-based geovisual-ization has been pushed and accompanied by the Commis-sion on Visualization and Virtual Environments of the Inter-national Cartographic Association (ICA) (see MacEachren and Kraak, 2001 or WWW: http://kartoweb.itc.nl/icavis/ overview.html).
Declaring the aim, the purpose, and the use of the map is of crucial importance for a correct cartographic visualization. MacEachren and Kraak (1997, Fig. 2) defined four use goals in a map-use cube: exploring, analyzing, synthesizing and presenting. They conclude that the emphasis of one of them requires different visualization strategies. The map visual-ization in the “CEDIM Risk Explorer” meets the purposes of presentation and analysis (see Sect. 3). Thereby the pre-sentation enables the cartographic communication between the map-user and the map. “Analysis” is here defined as a general search of new relationships between different data sources and the possibility to answer questions by maps, for example, the spatial analysis operation by the visual overlay-ing of two or more datasets and/or maps.
In order to meet the map goals in CEDIM and to visualize the statistical data within its spatial context in a suitable man-ner, the characteristics of the underlying phenomena have to be determined. A scientific classification of the represented phenomena helps to acquire knowledge about laws pertinent in single classes (Ogrissek, 1987). Efforts towards classi-fication schemes in cartography were made e.g. by Imhof (1972) or Arnberger (1997). An enclosing compendium of the processing of spatial data including classification aspects is given by Andrienko and Andrienko (2005).
One important classification category relevant to the as-signment of suitable graphic compositions for the map out-come of CEDIM is the Data Characteristic. Among others, it can be distinguished into the following classes: (1)
disc-reta, (2) continua, (3) qualitative, (4) quantitative, (5) abso-lute and (6) relative. Having the knowledge on the
classifica-tion category Data Characteristics in mind, suitable graphic compositions can be assigned as shown in Table 1.
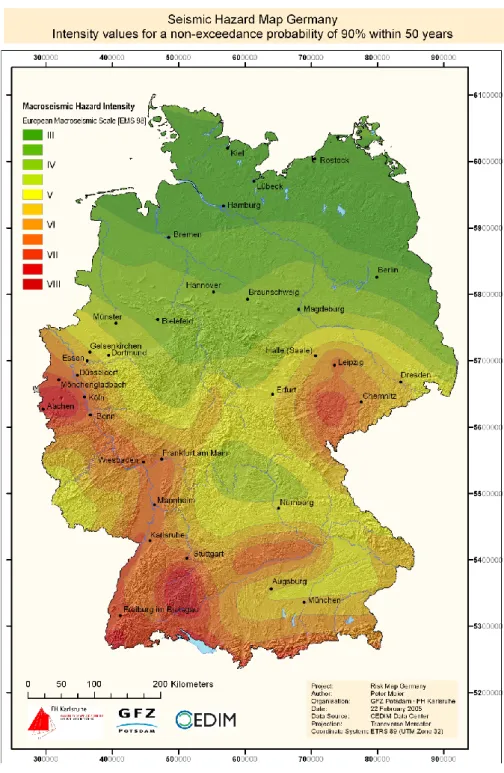
A further methodological approach can be seen in the use of visual variables. The visual variables that fit best to represent areal phenomena at an ordinal or numerical mea-surement scale are lightness and hue (MacEachren, 1994; Slocum, 1999). By using hue to represent ordinal data, the cartographer has to maintain a carefully ordered selection, such as yellow, orange and red, which implies the ranked na-ture of the ordinal data. The map visualization in Fig. 1 of the Seismic Hazard Map of Germany gives an example for this method.
Another visual variable, described by Slocum (1999), is the variation of symbol sizes. Size can be applied in a pro-portional manner according to the data values to be visual-ized. Every symbol has a distinct size that can, in sum, over-tax the perceptual skills for differentiation of a human ob-server. Hence, a similar method uses classification again to reduce the number of different symbol sizes to a perceptible degree. This method is referred as graduated symbols shown in Fig. 2. It provides a better overview of the data value dis-tribution at a glance. However, the map in Fig. 2 shows the limitations of a paper printout at the chosen scale. The under-lying information of community boundaries and settlement areas is almost entirely masked by the symbols. The sym-bols are also partly overlapping, especially in the dense mid-dle part of map. This problem can be solved here by using a zoomable screen map representation, like the “CEDIM Risk Explorer”, where a user can choose a customized scale that fits better to his requirements.
Fig. 1. Seismic Hazard Map Germany. Intensity values for a non-exceedance probability of 90% within 50 years. Example for a filled-in isoline map with steps in lightness and two hue transitions in the ordinal measurement scale (data source Tyagunov et al., 2006).
Finally, for the purpose of comparison of e.g. flood and storm or earthquake risks at the same location small multi-ples and diagram maps can be suitable. Small multimulti-ples refer to individual univariate maps that are displayed in a constant format and in ordered sequence next to each other. They ful-fill the visualization tasks of (1) what is at a given location and (2) where is a given characteristic (Bertin, 1981, 1983). Small multiples are described by Tufte (2001) as the best
so-lution for a wide range of problems in data representation. A diagram map enables users to directly compare quantitative values for a certain geographic location.
However, for the general map compilation in CEDIM it is important that quantitative data is classified and visualized using the same methodology that enhances the value compa-rability.
M. M¨uller et al.: CEDIM Risk Explorer 715
Fig. 2. Seismic Risk Map Germany. Estimated direct loss (Mio. EUR) due to damage to residential buildings per community with a non-exceedance probability of 90% within 50 years. Example for a graduated symbol map (Data source Kleist et al., 2006).
2.2 Map themes classification in the project CEDIM Risk maps play an important role to visualize the results of a risk analysis. Risk assessment describes a methodology to analyse the intensities and probabilities of hazards in combi-nation with the vulnerability of all the elements (objects, peo-ple etc.) in the region under study. Therefore, several steps of analysis and modelling have to be undertaken before a risk
map is produced. Risk assessment shall be the first step in a serious consideration of disaster reduction strategies (United Nations ISDR, 2004). However, different approaches are possible like the three-stage procedure by Chung et al. (2005) where first a hazard prediction map is created, which is fol-lowed by a validation step and will finally end in the genera-tion of a risk map.
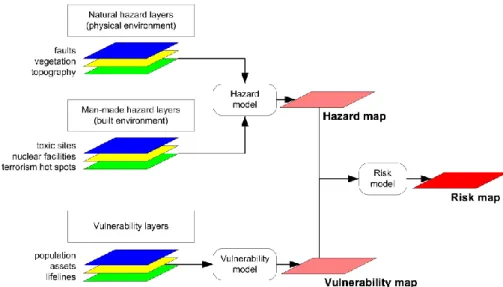
Fig. 3. Main map outcomes in CEDIM. Source: adapted from COVA (1999, Fig. 3).
Table 2. Overview about the preliminary map compositions.
Hazard Map Vulnerability Map Risk Map
Earthquake Risk 1 1 1
Flood Risk 2 – 1
Storm Risk 4–5 2 4–5
Man Made Hazard – 5 –
Asset Estimation – 6 –
Within CEDIM risk is defined as the probability that a given loss will occur or will be exceeded. Based on this defi-nition risk assessment is a three-stage procedure resulting in mainly three kinds of thematic maps schematically shown in Fig. 3: (1) hazard maps, (2) vulnerability maps and (3) risk maps (Cova, 1999). To distinguish between those three map representations the following definitions hold for CEDIM’s Risk Map Germany project (Maier, 2005; Merz et al., 2005): 1. A Hazard Map, sometimes called Hazard Zonation Map, represents the spatial dissemination of a hazard and its intensity with the declaration of an assigned probability of occurrence or exceedance probability. 2. A Vulnerability Map is distinct for representations of
the damage potential of a phenomenon (expressed in terms of relative or absolute monetary loss) on the one hand, and the susceptibility of elements at risk (accounts for parameters that affect the degree of destruction, e.g. building construction) on the other hand.
3. A Risk Map shows the spatial allocation of risk, which represents the expected damage or monetary loss and its assigned exceedance probability.
It has to be acknowledged that the definitions of vulnera-bility and risk used in the CEDIM project emphasize techni-cal vulnerability and the assessment of direct economic dam-age and neglect many aspects of social vulnerability as they are discussed e.g. by Blaikie et al. (1994).
In the framework of a quantitative risk analysis, the de-termination of building assets and their spatial dissemination was an important step towards a common data set that has been used by different CEDIM research teams (e.g. flood, earthquake and storm) for risk analysis purposes. For a com-parative risk analysis building assets were considered as ele-ments at risk to be analyzed first (see Kleist et al., 2006 and Thieken et al., 2006). The cartographic outcome of the asset determination is assigned to the map classification “Vulnera-bility Map”, since it is a step towards generation of vulnera-bility maps. The above mentioned map classifications of this study with the amount of the preliminary map realizations are shown in Table 2. This table represents first the map outputs of the earthquake risk of one map each for the three different map-kinds because earthquakes were just considered for the entire Germany without return periods. The other categories: Flood Risk, Storm Risk, Man Made Hazards and Asset Es-timation will mostly results in more than one map. That is due to the investigated regions, e.g. on federal or community level and by the different hazard scenarios with various re-turn periods. A few empty cells in Table 2 appear due to the nature of the investigated phenomena, e.g. the asset estima-tion can be only result in vulnerability maps which are then inputs for the generation of risk maps.
M. M¨uller et al.: CEDIM Risk Explorer 717 3 The “CEDIM Risk Explorer”
3.1 Requirements of the application
All Web-GIS are entirely or partly based on a map server technology, which was therefore also chosen for the imple-mentation of the “CEDIM Risk Explorer”. The digital atlas application named “CEDIM Risk Explorer” shall publish the risk information via the Internet in order to increase aware-ness to natural and anthropogenic risks. A range of poten-tial users may comprise insurance and reinsurance compa-nies, decision makers at various administrative levels (fed-eral, regional, communal), emergency and catastrophic man-agement or other researchers and interested public as well.
Several general requirements are imposed on the “CEDIM Risk Explorer” taking into account the range of potential users. For the users an operational availability must be given which is inherent by a Web application. The map informa-tion should reach the user in a sophisticated way so that an intuitive handling and map presentation are warranted. On the other hand, the underlying data must be protected from an unauthorized access. Finally, the conveyed information should give the current state of the research.
Furthermore, some graphical requirements should be ful-filled. For example, a well designed cartographic display can be easily understood by a wide audience (MacEachren and Kraak, 1997). A Web application, especially a cartographi-cal visualization, has to warrant that a suitable graphic com-position meets criteria for screen displays. These are e.g. a suitable line width, the possibility to adapt layer technique and the preference to visualize area symbols over line sym-bols. The Graphical User Interface (GUI) has particular rele-vance for the acceptance by the user. Graphical clearness and balance of the information volume and tools are therefore of enormous importance. The arrangement of the unique ele-ments should be based on general design rules (Plewe, 1997). They define the central object, here the map view, in the mid-dle with map navigation tools adhered to it. The user should be able to grasp the interface with one view.
3.2 Architecture, layout and functionality
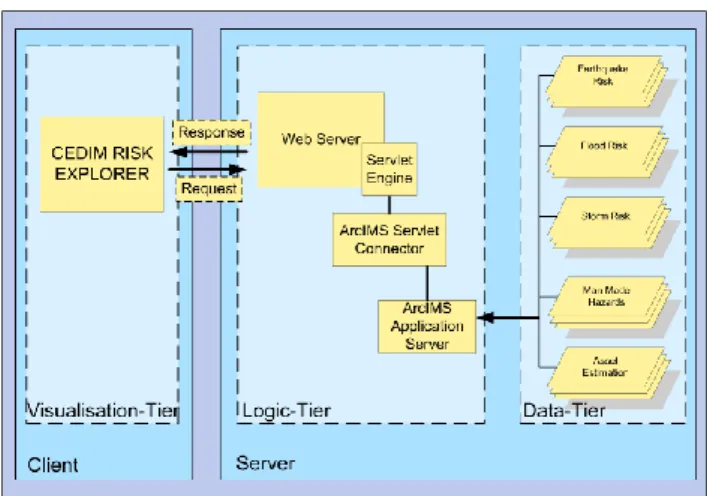
The Web-GIS solution “CEDIM Risk Explorer” is struc-turally built as a typical Web client/server model. The archi-tecture consists of a tier structure (Fig. 4). From a logically architecture view it is a so-called three-tier structure where the tiers are termed as presentation, logic and data (Peng and Tsou, 2003). This application is also shared in a phys-ically two-tier structure on the other side. Thereby the
pre-sentation tier resides on the client side in a Web browser or
a GIS-Software client and covers the visualization part. On the other hand, the logic tier and the data tier are located on a server side.
Figure 4 further indicates the data flow of the application based on the commercial software package ArcIMS (Internet
Fig. 4. Client/Server system of the “CEDIM Risk Explorer” in log-ically three-tier and physlog-ically two-tier architecture.
Map Service) by the Environmental System and Research In-stitute, Redlands CA. (ESRI). A user request is transmitted through the Web server further to the map server. The map server generates a raster image from the data tier which is vi-sualized by an image service back through the Web browser. In this study an existing map server application, the “CEDIM Data Center” could be used as a layout template. The “CEDIM Data Center” is an implemented map-server solution of the sub-project “Data management and GIS” in-side CEDIM (K¨ohler et al., 2006). This application works as a Geodata-Server, which gives an overview of spatial data sets to the members of CEDIM and provides data down-load functionality (K¨ohler et al., 2004). The kernel of the “CEDIM Risk Explorer” is based on this Geodata-Server due to the expected high effectiveness and low realization costs.
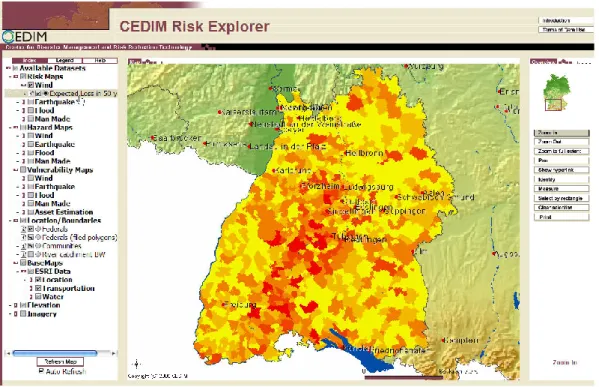
The “CEDIM Risk Explorer” – in its layout shown in Fig. 5 – offers a structural customized table of contents based on the JavaScript dbGroupToc15a (Bollinger, 2004). The ta-ble of contents gives an overview of availata-ble map layers dis-tinguished in hazard, vulnerability and risk maps, with each group containing the subgroups referring to a certain type of threat (storm, earthquake, flood and man made hazard). The group of vulnerability maps also includes general maps about number of people and assets potentially at risk as presented by Kleist et al. (2006) and Thieken et al. (2006). The table of contents provides the functionality of toggling the map layers. Together with a range of base maps and digital ele-vation models it gives potential users the possibility to com-pose different maps for their own needs. The user has thereby the possibilities to choose a custom geographical area and to combine the risk information layers for his/her needs. A print function provides additional generation of a custom map to the user. A print form in a fixed “CEDIM Risk Explorer” layout gives a print preview with additional information like a reference to the map data for the user-composed maps. The printout also includes an overview window indicating a
Fig. 5. Layout of the CEDIM Risk Explorer – table of contents, map window, toolbar.
localization of the selected printed map section on the whole map extent, and a legend of features selected for printing.
Metadata for each map layer can be accessed through the layer information icon in the Web-GIS contents. The meta-data generation in CEDIM follows the international standard “ISO 19115: Geographic Information – Metadata” (ISO, 2003). Accordingly a CEDIM standardized and approved metadata profile was developed that allows the standardized documentation of the used data and generated maps (K¨ohler et al., 2006).
4 Conclusion and further development
With the ”CEDIM Risk Explorer” a (preliminary) Web-GIS application was implemented to publish CEDIM research results as maps representing natural and man made haz-ards, vulnerabilities and risks. These thematic maps shall be available for the interested audience through a standard Web browser enabling the user to generate map compositions for their own needs. The “CEDIM Risk Explorer” gives a consistent overview of the CEDIM research project results. Users can compare different hazards and risks on specified locations in Germany. The consistent data and map base will serve as an important prerequisite for a multi-risk analysis, which is currently carried out. Due to the map presentations a better spatial understanding about the different threats can be transferred to the users. The easy comprehensibility and comparability of the map presentations emphasize the
exist-ing spatial relations to the user rather than the creation of new knowledge (MacEachren and Kraak, 1997).
During the study a successful map classification in haz-ard, vulnerability and risk categories was achieved. Thus, the implementation of an accurate cartographical visualiza-tion of the phenomena could be attained. Currently, choro-pleth maps, which show phenomena of area distribution, and graduated symbol maps, which show point phenomena, are used for the map representation in the “CEDIM Risk Ex-plorer”. Also dasymetric maps (see Thieken et al., 2006) were adopted for a better dissemination of spatial phenom-ena. The shown map compositions exemplify the current know-how of risk mapping adopted in CEDIM.
The technical improvement and the overcoming of the pro-totype status of this Web-GIS is a challenge for future ac-tivities. The current “CEDIM Risk Explorer” application represents a prototype which demands further development. The initial maps of vulnerability, hazard and risk are prede-fined by the interdisciplinary researchers. Thus, the users have limited interactive and explorative operations to gener-ate new maps. It would be more sophisticgener-ated if the users could choose the color or the class range of the maps them-selves. Consequently, a better interactive manipulation (An-drienko and An(An-drienko, 1999) provided for the users is de-sirable for the map compositions. Another challenge is the increasing amount of data and maps, leading to slower per-formance. The implementation of a suitable geo-database into the existing map server architecture will provide better performance as well as a dynamic map generation from up-dated data and the promotion of a certain data consistency.
M. M¨uller et al.: CEDIM Risk Explorer 719 All the desired improvements lead to an ongoing
develop-ment of the “CEDIM Risk Explorer” to a real open and in-teroperable distributed GIS as mentioned in Sect. 1.2 and the deployment as a GIS Web Service in the next future. Since the comparability of hazards and risks is one of the main characteristics of the “CEDIM Risk Explorer”, however the use of a distributed environment could lead to data misin-terpretations. It is normally unknown, with which method the map contents of the remote data sources were visualized. For instance this could have happened for the used classi-fication method of data in the certain ranges or class-breaks. Different variations of a classification arise therefore in various map views and could promote fail interpretations (Monmonier, 1991). However, a general recipe for a correct classification could not be found (Andrienko and Andrienko, 2005). Therefore, careful use of the data visualization in re-gard to the value comparability should be present.
Nevertheless interoperable Web-GIS for the “CEDIM Risk Explorer” shall be soon achieved so that the current solution can be regarded as an intermediate step on the way to a GIS Web service which operates as a GIS node in an open GIS network in future.
Acknowledgements. This work is part of the Center for Disaster
Management and Risk Reduction Technology (www.cedim.de), a joint venture between the GeoForschungsZentrum Potsdam (GFZ) and the University of Karlsruhe (TH). We thank the GFZ Potsdam and the University of Karlsruhe (TH) for financial support. Edited by: H. Kreibich
Reviewed by: B. Meissner and two other referees
References
Andrienko, G. and Andrienko, N.: Interactive Maps for Visual Data Exploration, Int. J. Geograph. Inf. Sci., 13, 355–374, 1999. Andrienko, N. and Andrienko, G.: Exploratory Analysis of Spatial
and Temporal Data: A Systematic Approach, Berlin Heidelberg, Springer, XV, 703 p., 2005.
Annoni, A., Bernhard, L., Douglas, J., Greenwood, J., Laiz, I., Lloyd, M., Sabeur, Z., Sassen, A.-M., Serrano, J.-J., and Usl¨ander, T.: Orchestra: Developing a Unified Open Archi-tecture for Risk Management, in: Geo-information for Disas-ter Management, edited by: v. OosDisas-terom, P., Zlatanova, S., and Fendel, E. M., Berlin Heidelberg, Springer, 1–17, 2005. Arnberger, E.: Thematische Kartographie. Mit einer
Kurze-inf¨uhrung ¨uber EDV-unterst¨utzte Kartographie und Quellen der Fernerkundung: Das geographische Seminar, Braunschweig, Westermann Schulbuchverlag GmbH, 1–245 ,1997.
Bertin, J.: Graphics and Graphic Information-Processing, Berlin, New York, Walter de Gruyter, 1–274, 1981.
Bertin, J.: Semiology of Graphics: Diagrams, Networks, Maps, Madison, WI, University of Wisconsin Press, 1983.
Blaikie, P., Cannon, T., Davis, I., and Wisner, B.: At risk. Natural hazards, people’s vulnerability, and disasters, Routledge, Lon-don, New York, 1994.
Bollinger, D.: dbGroupToc15a ArcScript, electronic source: http:// arcscripts.esri.com/details.asp?dbid=12191, accessed Jan. 2004, Redlands, USA, ESRI Support Center, 2003.
Cartwright, W., Peterson, M. P., and Gartner, G.: Multimedia car-tography, Berlin Heidelberg, Springer, 361 p., 1999.
Chung, C.-J. F., Fabbri, A. G., Jang, D.-H., and Scholten, H. J.: Risk Assessment Using Spatial Prediction Model for Natural Disas-ter Preparedness, in: Geo-information for DisasDisas-ter Management, edited by: v. Oosterom, P., Zlatanova, S., and Fendel, E. M., Berlin Heidelberg, Springer, 619–640, 2005.
Cova, T. J.: GIS in Emergency Management, in Geographical In-formation Systems: Management Issues and Applications, edited by: Longley, P. A., Goodchild, M. F. Maguire, D. J., and Rhind, D., New York, John Wiley & Sons, Inc., 2, 845–858, 1999. Dragicevic, S.: The potential of web-based GIS, J. Geograph. Syst.,
6, 79–81, 2004.
Federal Emergency Management Agency (FEMA), electronic source: http://www.fema.gov/hazard/index.shtm, accessed Octo-ber 2005, Washington D.C., USA, FEMA, 2005.
G¨obel, R., Almer, A., Blaschke, T., Lemoine, G., and Wimmer, A.: Towards an Integrated Concept for Geographical Informa-tion Systems in Disaster Management, in: Geo-informaInforma-tion for Disaster Management, edited by: v. Oosterom, P., Zlatanova, S., and Fendel, E. M., Berlin Heidelberg, Springer, 715–732, 2005. Green, D. and Bossomaier, T.: Online GIS and Spatial Metadata,
London – New York, Taylor & Francis Inc., 2002.
Hunter, T.: A Distributed Spatial Data Library for Emergency Man-agement, in: Geo-information for Disaster ManMan-agement, edited by: v. Oosterom, P., Zlatanova, S., and Fendel, E. M., Berlin Heidelberg, Springer, 733–750, 2005.
Imhof, E.: Thematische Kartographie, Berlin, Walter de Gruyter & Co., 360 p., 1972.
International Standard Organization (ISO): International Standard ISO 19119, Geographic Information – Services, ISO/TC 211, 2003.
International Standard Organization (ISO): International Stan-dard ISO/DIS 19115 (ISO/TC211), Geographic informa-tion – Metadata, electronic source: http://www.iso.org/iso/ en/CatalogueDetailPage.CatalogueDetail?CSNUMBER= 26020{\&}ICS1=35{\&}ICS2=240{\&}ICS3=70, accessed Oc-tober 2005, Genf, International Standardization for Organization, 2003.
Kleist, L., Thieken, A. H., K¨ohler, P., Seifert, I., Borst, D., and WERNER, U.: Estimation of Building Values as a Basis for Comparative Risk Assessments, Nat. Hazards Earth Syst. Sci., 6, 541–552, 2006,
http://www.nat-hazards-earth-syst-sci.net/6/541/2006/.
K¨ohler, P., M¨uller, M., and Sanders, M.: Daten- und Information-smanagement im Center for Disaster Management and Risk Re-duction Technology (CEDIM), in: Angewandte Geoinformatik 2004, Beitr¨age zum 16. AGIT-Symposium Salzburg, edited by: Strobl, Blaschke, Griesebner, Salzburg, Herbert Wichmann Ver-lag, 359–364, 2004.
K¨ohler, P., M¨uller, M., and Sanders, M., and W¨achter, J.: Data Management and GIS in the Center for Disaster Management and Risk Reduction Technology (CEDIM): From integrated spa-tial data to the mapping of risk, Nat. Hazards Earth Syst. Sci., 6, 621–628, 2006,
http://www.nat-hazards-earth-syst-sci.net/6/621/2006/.
Kraak, M. J.: The role of the map in a Web-GIS environment, J. Geograph. Syst., 6, 83–93, 2004.
Latini, M. and K¨obben, B.: A Web Application for Landslide In-ventory Using Data-Driven SVG, in: Geo-information for Disas-ter Management, edited by: v. OosDisas-terom, P., Zlatanova, S., and Fendel, E. M., Berlin Heidelberg, Springer, 1041–1054, 2005. MacEachren, A. M.: Some Truth with Maps: A Primer on
Sym-bolization and Design, Resource Publications in Geography, v. IV: Washington, D.C., Association of American Geographers, 1– 129, 1994.
MacEachren, A. M. and Kraak, M. J.: Research Challenges in Geo-visualization, Cartography and Geographic Information Science, 28(1), 3–12, 2001.
MacEachren, A. M. and Kraak, M. J.: Exploratory cartographic vi-sualization: Advancing the agenda, Computers & Geosciences, Exploratory Cartographic Visualisation, 23, 335–343, 1997. Maier, P.: Development of a Risk Mapping Concept for CEDIM
Based on an Investigation and Evaluation of Cartographic Meth-ods Used for Mapping Hazard, Vulnerability and Risk, Mas-ter Thesis, University of Karlsruhe, Karlsruhe – Potsdam, 1–87, 2005.
Merz, B., Thieken, A. H., and Gocht, M.: Flood risk mapping at the local scale: Concepts and challenges, in: Flood Risk Man-agement in Europe: Innovation in Policy and Practice, edited by: Begum, S., Hall, J., and Stive, M., Dordrecht, Kluwer Academic Publishers, 2005.
Monmonier, M.: How to lie with Maps, Chicago London, Univer-sity of Chicago Press, 176 p., 1991.
NOAA & NCDDC: National Oceanic and Atmospheric Adminis-tration & Coastal Data Development Centre, electronic source: http://www.ncddc.noaa.gov/cra, accessed October 2005. OGC: The OpenGIS Abstract Specification, Topic 12: OpenGIS
Service Architecture, Version 4.3., 2002, electronic source: http: //www.opengeospatial.org/specs/?page=abstract, accessed Octo-ber 2005.
OGC: Web Map Service Implementation Specification, 2006, electronic source: http://www.opengeospatial.org/specs/?page= specs, accessed April 2006.
Ogrissek, R.: Theoretische Kartographie, Studienb¨ucherei Kar-tographie, v. Band 1: Gotha, VEB Hermann Haack, 257–261, 1987.
PCL: Perry Castaneda Library – Map Collection. Austin, Univer-sity of Texas, electronic source: http://www.lib.utexas.edu/maps/ asia.html, accessed February 2006.
Peng, Z.-R.: An assessment framework for the development of In-ternet GIS, Environment and Planning B: Planning and Design, 29, 117–132, 1999.
Peng, Z.-R. and Tsou, M.-H.: Internet GIS: Distributed Geographic Information Services for the Internet and Wireless Networks, Hoboken, New Jersey, John Wiley & Sons, Inc., 720 p., 2003. Plewe, B.: GIS Online: information retrieval, mapping, and the
Internet, SantaFe, Onword Press, 1997.
Richard, D.: Development of an internet atlas of Switzerland, Com-puters & Geosciences, 26, 45–50, 2000.
Slocum, T. A.: Thematic Cartography and Visualization, New Jer-sey, Prentice Hall Inc., 1999.
Swiss Re: CatNet, electronic source: https://entry.swissre.com/ webapp/sls/frameset.jsp?requestedPage=/webapp/c4c/, accessed October 2005, Zurich, Swiss, 2005.
Taylor, D. R. F.: Cartographic Visualization and Spatial Data Han-dling, in: Advances in GIS research, Proceedings of the 6th inter-national symposium on spatial data handling, edited by: Waugh, T. C. and Healey, R. G., Edinburgh, August 1994, two volumes, Vol. 1, London, Taylor & Francis, 1140 p., 1994.
Thieken, A. H., M¨uller, M., Kleist, L., Seifert, I., Borst, D., and Werner, U.: Regionalisation of asset values for risk analyses, Nat. Hazards Earth Syst. Sci., 6, 167–178, 2006,
http://www.nat-hazards-earth-syst-sci.net/6/167/2006/.
Tufte, E. R.: Envisioning Information, Graphics Press, 126 p., 2001. Tyagunov, S., Gr¨unthal, G., Wahlstr¨om, R., Pohl, D., Stempniewski, L., and Zschau, J.: Seismic Risk Mapping for Germany, Nat. Hazards Earth Syst. Sci., 6, 573–586, 2006,
http://www.nat-hazards-earth-syst-sci.net/6/573/2006/.
United Nations ISDR: Living with Risk: A global review of dis-aster reduction initiatives, Geneva, Switzerland, Inter-Agency Secretariat of the International Strategy for Disaster Reduction (UN/ISDR), 430 p., 2004.