HAL Id: hal-00298132
https://hal.archives-ouvertes.fr/hal-00298132
Submitted on 28 Jun 2006HAL is a multi-disciplinary open access
archive for the deposit and dissemination of sci-entific research documents, whether they are pub-lished or not. The documents may come from teaching and research institutions in France or abroad, or from public or private research centers.
L’archive ouverte pluridisciplinaire HAL, est destinée au dépôt et à la diffusion de documents scientifiques de niveau recherche, publiés ou non, émanant des établissements d’enseignement et de recherche français ou étrangers, des laboratoires publics ou privés.
On the importance of initial conditions for simulations
of the Mid-Holocene climate
H. Renssen, E. Driesschaert, M. F. Loutre, T. Fichefet
To cite this version:
H. Renssen, E. Driesschaert, M. F. Loutre, T. Fichefet. On the importance of initial conditions for simulations of the Mid-Holocene climate. Climate of the Past Discussions, European Geosciences Union (EGU), 2006, 2 (3), pp.315-326. �hal-00298132�
CPD
2, 315–326, 2006 Initial conditions in simulations of mid-Holocene climate H. Renssen et al. Title Page Abstract Introduction Conclusions References Tables Figures J I J I Back CloseFull Screen / Esc
Printer-friendly Version Interactive Discussion
EGU Clim. Past Discuss., 2, 315–326, 2006
www.clim-past-discuss.net/2/315/2006/ © Author(s) 2006. This work is licensed under a Creative Commons License.
Climate of the Past Discussions
Climate of the Past Discussions is the access reviewed discussion forum of Climate of the Past
On the importance of initial conditions for
simulations of the Mid-Holocene climate
H. Renssen1, E. Driesschaert2, M. F. Loutre2, and T. Fichefet2
1
Faculty of Earth and Life Sciences, Vrije Universiteit Amsterdam, De Boelelaan 1085, 1081 HV Amsterdam, The Netherlands
2
Institut d’Astronomie et de G ´eophysique G. Lemaˆıtre, Universit´e Catholique de Louvain, 2 Chemin du Cyclotron, 1348 Louvain-la-Neuve, Belgium
Received: 24 May 2006 – Accepted: 31 May 2006 – Published: 28 June 2006 Correspondence to: H. Renssen ([email protected])
CPD
2, 315–326, 2006 Initial conditions in simulations of mid-Holocene climate H. Renssen et al. Title Page Abstract Introduction Conclusions References Tables Figures J I J I Back CloseFull Screen / Esc
Printer-friendly Version Interactive Discussion
EGU
Abstract
Three simulations of the Mid-Holocene (6 ka) climate were performed with the ECBilt-CLIO-VECODE coupled atmosphere-ocean-vegetation model to study the impact of initial conditions. These experiments were forced with identical 6 ka forcings (orbital parameters and atmospheric greenhouse gas concentrations) and differed only in
ini-5
tial conditions. Two simulations were designed as equilibrium experiments, with one being initialized with preindustrial conditions as required by the protocol of the Paleo-climate Modelling Intercomparison Project (PMIP), while in a second experiment early Holocene (9 ka) intial conditions were used. These equilibrium simulations were run for 2100 years with 6 ka forcings. The third experiment was set up as a transient
simu-10
lation, also starting from early Holocene conditions, but forced with annually changing orbital parameters and greenhouse gas levels. The results of the last 100 years are compared and reveal no statistically significant differences, showing that in this model the initial conditions have no discernible impact on the 6 ka climate. This suggests that the PMIP set-up for 6 ka simulations is valid, with the condition that spin-up phase
15
should be long enough (at least 600 years) to allow the deep ocean to adjust to the change in forcings.
1 Introduction
The Mid-Holocene (6 ka) is frequently used as a reference period to evaluate the sen-sitivity of climate models to changes in radiative forcing, e.g., in the first and second
20
phases of the Paleoclimate Modelling Intercomparison Project (PMIP, Joussaume and Taylor, 2000; Crucifix et al., 2005). Within PMIP, all models use an identical experi-mental setup to make intermodel comparisons possible (e.g., Joussaume et al., 1999; Braconnot et al., 2000). The PMIP experimental setup for Mid-Holocene simulations includes the forcing conditions and model spin-up. Compared to preindustrial forcings,
25
CPD
2, 315–326, 2006 Initial conditions in simulations of mid-Holocene climate H. Renssen et al. Title Page Abstract Introduction Conclusions References Tables Figures J I J I Back CloseFull Screen / Esc
Printer-friendly Version Interactive Discussion
EGU to represent conditions at 6 ka. The spin-up procedure requires models to start with
initial conditions obtained from a model state in quasi-equilibrium with pre-industrial forcings. After completion of the experiments in PMIP, the model results are evaluated by comparison with proxy data (e.g., Prentice et al., 1998; Joussaume et al., 1999). A key region for model-data comparisons is Northern Africa, which experienced a much
5
wetter climate at 6 ka than today under influence of the orbitally forced enhancement of the summer monsoons (i.e. “green” Sahara).
The choice of the preindustrial initial conditions for 6 ka experiments is disputable, as potentially a different 6-ka climate state can be obtained when different initial con-ditions are used. Possibly, the use of early Holocene (e.g., 9 ka) initial concon-ditions is
10
more appropriate because the climate of that time could have been closer to the mid-Holocene climate. This could for instance be the case in the Sahara/Sahel region that was in a ‘green’ state in the early-to-mid Holocene (from ∼11 to 5 ka) during the so-called African Humid Period (e.g., deMenocal et al., 2000), which includes the 6 ka time-slice (e.g., Hoelzmann et al., 1998; Prentice et al., 2000). Previous model studies
15
have suggested that both the green and desert states could have been stable under 6 ka forcings (Renssen et al. 2003), implying that potentially simulations initialized with preindustrial conditions could produce a desert state in Northern Africa instead of the required green state.
To study the influence of the initial conditions on the simulated 6-ka climate, we
com-20
pare here the results of three simulation experiments performed with the ECBilt-CLIO-VECODE model, which describes the global coupled atmosphere-ocean-vegetation system. In addition to an experiment with the “standard” PMIP setup (i.e. preindustrial initial conditions), we have performed an experiment with 6 ka forcings that is initialized with conditions derived from a simulation in quasi equilibrium with forcings for 9 ka.
25
These two experiments are compared with 6 ka results from a transient experiment that is integrated forward in time, forced with annually varying orbital and greenhouse gas forcing and starting from the same 9 ka initial conditions.
CPD
2, 315–326, 2006 Initial conditions in simulations of mid-Holocene climate H. Renssen et al. Title Page Abstract Introduction Conclusions References Tables Figures J I J I Back CloseFull Screen / Esc
Printer-friendly Version Interactive Discussion
EGU
2 Model and experimental setup
We applied version 3 of the ECBilt-CLIO-VECODE coupled climate model of intermedi-ate complexity. The atmospheric model is ECBilt, a quasi-geostrophic model with T21-L3 resolution (Opsteegh et al., 1998). CLIO is the oceanic component and consists of a free-surface, primitive-equation ocean general circulation model (OGCM), coupled to
5
a dynamic-thermodynamic sea-ice model (Goosse and Fichefet, 1999). The OGCM in-cludes 20 levels in the vertical and has a 3◦×3◦latitude-longitude horizontal resolution. VECODE is a model that simulates the dynamics of two main terrestrial plant functional types, trees and grasses, and desert as a dummy type (Brovkin et al., 2002). Details about the model are available athttp://www.knmi.nl/onderzk/CKO/ecbilt.html. With an
10
earlier version of the model (i.e. version 2), we studied the Holocene climate evolution in Northern Africa (Renssen et al. 2003). The differences between versions 2 and 3 are discussed athttp://www.knmi.nl/onderzk/CKO/differences.html.
With ECBilt-CLIO-VECODE-version-3 we performed two equilibrium 6 ka experi-ments in which identical changes in forcings are applied relative to a standard set
15
of preindustrial conditions. The most important change is the modification of the orbital parameters to their 6-ka values according to Berger (1978). In addition, to account for different values in atmospheric trace gas concentrations at 6 ka, the levels of CO2, CH4 and N2O were set at 267.6 ppm, 589.1 ppb and 262.3 ppb, respectively (Raynaud et al., 2000). The two experiments were run with these forcings for 2100 years, starting from
20
different initial conditions. The first experiment (hereafter “6kPI”) was started from a state obtained from a 2500-year control run with preindustrial conditions in accordance with the PMIP protocol, while a second simulation (hereafter “6k9k”) was initialized with a state derived from a 1500-year long experiment with orbital and greenhouse gas forc-ings for 9 ka. Note that these 9 ka conditions do not account for the remnant Laurentide
25
Icesheet in North America, implying that the early Holocene initial state is slightly too warm compared to proxy data (Renssen et al., 2005a).
CPD
2, 315–326, 2006 Initial conditions in simulations of mid-Holocene climate H. Renssen et al. Title Page Abstract Introduction Conclusions References Tables Figures J I J I Back CloseFull Screen / Esc
Printer-friendly Version Interactive Discussion
EGU was set-up as a transient experiment (6kTR). It was started from the same 9 ka
ini-tial conditions as 6k9k, but was integrated forward in time towards preindustrial times, forced by annually changing values in orbital parameters and atmospheric concentra-tions of CO2 and CH4. At 6 ka, these values were identical to the ones prescribed in 6kPI and 6k9k. The level of N2O was kept constant at 262.3 ppb throughout the 6kTR
5
experiment. The results of 6kTR have been analyzed in detail for high-latitude climates (Renssen et al., 2005a, b, c).
3 Results and discussion
In our coupled atmosphere-ocean-vegetation system, the oceans are the component with the longest memory due to their large heat capacity. Consequently, any potential
10
differences between our experiments that are caused by initial conditions and that are related to the memory of the system could be expected to be primarily present in the oceans. Therefore, we focus our global scale analysis on the oceans. For Northern Africa, we also consider vegetation because it has been suggested that in this region the vegetation-climate system could have two stable equilibria (i.e., “green” and desert)
15
under 6 ka forcings.
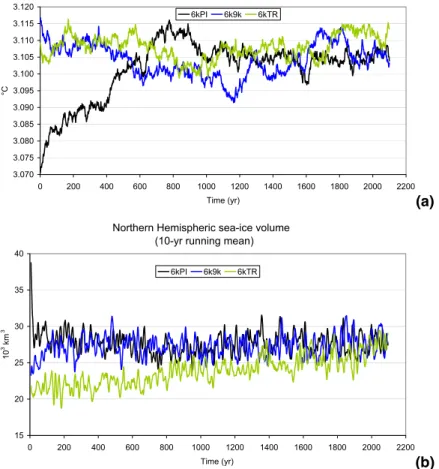
The globally averaged ocean temperature (Fig. 1a) provides a clear picture of the influence of the initial conditions and the time that is required to reach a new quasi equilibrium. On a global scale, the 9 ka initial temperature is close (3.12◦C, see Ta-ble 1) to the final 6 ka state (3.11◦C), while the preindustrial climate is considerably
20
colder (3.07◦C). After about 600 years, the global ocean temperature is similar in 6kPI and 6k9k, implying that the influence of the cold initial preindustrial conditions is no longer discernible at the global scale. The temperature fluctuations in the remaining 1500 years of the experiments can be attributed to natural variability. The final level (3.11◦C) of the global ocean temperature in 6kPI and 6k9k is the same as in 6kTR at
25
6 ka (Table 1). The same is true for the sea-ice volumes in both hemispheres (Fig. 1b, Table 1) and the strength of the overturning circulation (Table 1), showing that the di
ffer-CPD
2, 315–326, 2006 Initial conditions in simulations of mid-Holocene climate H. Renssen et al. Title Page Abstract Introduction Conclusions References Tables Figures J I J I Back CloseFull Screen / Esc
Printer-friendly Version Interactive Discussion
EGU ences in experimental setup between the considered simulations have no discernible
impact on the final 6 ka ocean state in our model. The evolution of the Northern Hemi-spheric sea-ice volume (Fig. 1b) clearly shows the slow adjustment to the annually changing forcings in 6kTR.
In addition to the discussed oceanic variables, we have also analyzed the spatial
5
patterns of surface temperature and precipitation anomalies, thereby considering the averages over the last 100 years of 6kPI and 6k9k, and the relevant 100 years of 6kTR (i.e. 6050–5950 yr BP). To see if the differences between these average 6 ka climates were statistically significant, we performed a student-t test at the 95% level (not shown). In short, there were no consistent anomalies in surface temperature or precipitation that
10
were statistically significant.
In Northern Africa, the initial conditions for vegetation differ considerably for 6kPI and 6k9k. This is illustrated by the vegetation cover, which has a mean value of 27.5% in the preindustrial “desert” state and 67.1% in the 9 ka “green” state (Table 1). In 200 years of simulation with 6 ka forcing, 6kPI and 6k9k converge at the 6 ka level of
15
6kTR (i.e. vegetation cover of about 54%, not shown). This is no surprise, as it was already noted that precipitation and temperature in 6k9k and 6kTR show no consistent statistical anomalies over Northern Africa compared to 6kPI. Consequently, it may be concluded that in our model only the “green” state is stable over Northern Africa at 6 ka and that initial conditions have no distinct impact on the 6 ka vegetation in this region.
20
It should be noted that this conclusion for Northern Africa is model-dependant. For instance, in an earlier model version (ECBilt-CLIO-VECODE version 2), both desert and green states were potentially stable in Northern Africa under 6 ka forcings (Renssen et al. 2003). In a transient experiment identical to 6kTR that was performed with this previous version, this bistability was revealed by abrupt centennial-scale shifts
25
between the desert and green states in the western part of Northern Africa (between 15◦W and 5◦E) during an unstable phase that lasted from 7.5 to 5.5 ka (Renssen et al., 2003, 2006). This instability is related to Charney’s biogeophysical feedback (Charney, 1975; Charney et al., 1975) between surface albedo, influenced by
vege-CPD
2, 315–326, 2006 Initial conditions in simulations of mid-Holocene climate H. Renssen et al. Title Page Abstract Introduction Conclusions References Tables Figures J I J I Back CloseFull Screen / Esc
Printer-friendly Version Interactive Discussion
EGU tation cover, and precipitation. Compared to the experiment with version 2, in 6kTR
the Holocene desertification in Northern Africa differs on two points. First, the largest change from “green” to desert takes place more to the east (i.e. in the central-eastern Sahara between 10◦E and 35◦E), and second, the unstable phase with accelerated desertification due to Charney’s biogeophysical feedback occurs later (i.e. between 5.2
5
to 3.2 ka). Consequently, at 6 ka the climate in 6kTR is still in the “green” state. In the ECHAM-BIOME model, the “green” state is also the only equilibrium that exists under 6 ka forcings (Brovkin et al., 1998)
The similarity between the 6 ka climates in 6kTR and the other experiments (6kPI and 6k9k) implies that the climate in 6kTR is in equilibrium with the 6 ka forcings,
sug-10
gesting that the annual changes in forcing are small enough for the system to adjust continuously during the mid-Holocene. In other words, assuming an adjustment time (or memory) of ∼600 years, the climate at 6.0 ka is still influenced by the forcings at 6.6 ka in 6kTR, but the changes in forcings between 6.6 ka and 6 ka are apparently not large enough to yield a statistically different climate compared to 6kPI and 6k9k. This is
15
good news for model-data comparisons as carried out for the 6 ka climate within PMIP (e.g., Joussaume et al., 1999), as one can expect that the climatic changes experi-enced in the “real world” (as registered in proxy data) are closer to the results of 6kTR than to those of the other experiments.
If we assume that our inferences about the indiscernible influence of initial conditions
20
are reasonable, it would imply that the PMIP protocol for 6 ka experiments is valid. An important requirement is that the integration time during spin-up allows for adjustment of deep oceans to the 6 ka forcings. Our simulations suggest that the spin-up phase should at least have a duration of 600 years (see Fig. 1a).
4 Concluding remarks
25
In our model, the initial conditions (either preindustrial or early Holocene) have no dis-cernible impact on the final 6 ka climate that is obtained after running our model for
CPD
2, 315–326, 2006 Initial conditions in simulations of mid-Holocene climate H. Renssen et al. Title Page Abstract Introduction Conclusions References Tables Figures J I J I Back CloseFull Screen / Esc
Printer-friendly Version Interactive Discussion
EGU 2100 years with constant forcings for 6 ka. After about 600 years, both 6kPI and 6k9k
have reached the final level of deep ocean temperature that is matching the 6 ka level in our transient experiment 6kTR. The vegetation in Northern Africa reaches the same 6 ka level after about 200 years in both the equilibrium experiments with different initial conditions, giving no indication for bistability of the vegetation-atmosphere system
un-5
der 6 ka forcings. Assuming that these conclusions are applicable to other models, our results suggest that the PMIP setup for 6 ka experiments is reasonable as long as the experiments have a long enough spin-up time (i.e. at least 600 years) to account for the relatively slow response of the deep ocean.
Acknowledgements. H. Renssen is supported by the Netherlands Organization for Scientific
10
Research (NWO). This study was carried out as part of the Belgian Second Multiannual Sci-entific Support Plan for a Sustainable Development Policy (Belgian Federal Science Policy, contract EV/10/9A), the Belgian Research Programme on Science for a Sustainable Devel-opment (Belgian Federal Science Policy, contract: SD/CS/01A) and the European Research Programme on Environment and Sustainable Development (European Commission, contract 15
EVK2-CT-2002-00153). V. Brovkin (Potsdam Institute for Climate Impact Research) kindly made VECODE available for this study. J. M. Campin (MIT) is thanked for programming the coupling of VECODE to ECBilt and for model testing.
References
Berger, A. L.: Long-term variations of daily insolation and Quaternary climatic changes, J. 20
Atmos. Sci., 35, 2363–2367, 1978.
Braconnot, P., Joussaume, S., de Noblet, N., and Ramstein, G.: Mid-Holocene and Last Glacial Maximum African monsoon changes as simulated within the Paleoclimate Modelling Inter-comparison Project, Global Planet. Change, 26, 51–66, 2000.
Brovkin, V., Claussen, M., Petoukhov, V., and Ganopolski, A.: On the stability of the 25
atmosphere-vegetation system in the Sahara/Sahel region, J. Geophys. Res., 103, 31 613– 31 624, 1998.
Brovkin, V., Bendtsen, J., Claussen, M., Ganopolski, A., Kubatzki, C., Petoukhov, V., and An-dreev, A.: Carbon cycle, vegetation and climate dynamics in the Holocene: experiments
CPD
2, 315–326, 2006 Initial conditions in simulations of mid-Holocene climate H. Renssen et al. Title Page Abstract Introduction Conclusions References Tables Figures J I J I Back CloseFull Screen / Esc
Printer-friendly Version Interactive Discussion
EGU
with the CLIMBER-2 model, Global Biogeochem. Cycles, 16, doi:10.1029/2001GB001662, 2002.
Charney, J. G.: Dyamics of deserts and droughts in the Sahel, Quarterly Journal of the Royal Meteorological Society, 101, 193–203, 1975.
Charney, J. G., Stone, P. H., and Quirk, W. J.: Drought in the Sahara: a biogeophysical feedback 5
mechanism, Science, 187, 434–435, 1975.
Crucifix, M., Braconnot, P., Harrison, S. P., and Otto-Bliesner, B.: Second phase of Paleoclimate Modelling Intercomparison Project, EOS, 86, No. 28, 12 July, 2005.
deMenocal, P., Ortiz, J., Guilderson, T., Adkins, J., Sarnthein, M., Baker, L., and Yarusinsky, M.: Abrupt onset and termination of the African humid period: rapid climate responses to 10
gradual insolation forcing, Quat. Sci. Rev., 19, 347–361, 2000.
Goosse, H. and Fichefet, T.: Importance of ice-ocean interactions for the global ocean circula-tion: a model study, J. Geophys. Res., 104, 23 337–23 355, 1999.
Hoelzmann, P., Jolly, D., Harrison, S. P., Laarif, F., Bonnefille, R., and Pachur, H.-J.: Mid-Holocene land-surface conditions in northern Africa and the Arabian peninsula: a data set 15
for the analysis of biogeographical feedbacks in the climate system, Global Biogeochem. Cycles, 12, 35–51, 1998.
Joussaume, S. and Taylor, K. E.: The Paleoclimate Modelling Intercomparison Project, in: PMIP, Paleoclimate Modeling Intercomparison Project (PMIP): proceedings of the third PMIP workshop, edited by: Braconnot, P., Canada, 4–8 October 1999, WCRP-111, WMO/TD-20
1007, p. 9–25, 2000.
Joussaume, S., Taylor, K. E., Braconnot, P., et al.: Monsoon changes for 6000 years ago: results of 18 simulations from the Paleoclimate Modeling Intercomparision Project (PMIP), Geophys. Res. Lett., 26, 859–862, 1999.
Opsteegh, J. D., Haarsma, R. J., Selten, F. M., and Kattenberg, A.: ECBILT: A dynamic alter-25
native to mixed boundary conditions in ocean models, Tellus, 50A, 348–367, 1998.
Prentice, I. C.: The climate and biomes of Europe at 6000 yr BP: comparison of model simula-tions and pollen-based reconstrucsimula-tions, Quat. Sci. Rev., 17, 659–668, 1998.
Prentice, I. C., Jolly, D., and BIOME 6000 participants: Mid-Holocene and glacial-maximum vegetation geography of the northern continents and Africa, J. Biogeogr., 27, 507–519, 30
2000.
Raynaud, D., Barnola, J.-M., Chappellaz, J., Blunier, T., Inderm ¨uhle, A., and Stauffer, B.: The ice record of greenhouse gases: a view in the context of future changes, Quat. Sci. Rev., 19,
CPD
2, 315–326, 2006 Initial conditions in simulations of mid-Holocene climate H. Renssen et al. Title Page Abstract Introduction Conclusions References Tables Figures J I J I Back CloseFull Screen / Esc
Printer-friendly Version Interactive Discussion
EGU
9–17, 2000.
Renssen, H., Brovkin, V., Fichefet, T., and Goosse, H.: Holocene climate instability during the termination of the African Humid Period, Geophys. Res. Lett., 30, 1184, doi:10.1029/2002GL016636, 2003.
Renssen, H., Goosse, H., Fichefet, T., Brovkin, V., Driesschaert, E., and Wolk, F.: Simulating 5
the Holocene climate evolution at northern high latitudes using a coupled atmosphere-sea ice-ocean-vegetation model, Clim. Dyn., 24, 23–43, 2005a.
Renssen, H., Goosse, H., Fichefet, T., Masson-Delmotte, V., and Koc¸, N.: The Holocene climate evolution in the high-latitude Southern Hemisphere simulated by a coupled atmosphere-sea ice-ocean-vegetation model, Holocene, 15, 951–964, 2005b.
10
Renssen, H., Goosse, H., and Fichefet, T.: Contrasting trends in North Atlantic deep-water formation in the Labrador Sea and Nordic Seas during the Holocene, Geophys. Res. Lett., 32, L08711, doi:10.1029/2005GL022462, 2005c.
Renssen, H., Brovkin, V., Fichefet, T., and Goosse, H.: Simulation of the Holocene climate evolution in Northern Africa: the termination of the Afican Humid Period, Quat. Int., 150, 15
CPD
2, 315–326, 2006 Initial conditions in simulations of mid-Holocene climate H. Renssen et al. Title Page Abstract Introduction Conclusions References Tables Figures J I J I Back CloseFull Screen / Esc
Printer-friendly Version Interactive Discussion
EGU
Table 1. Annual mean values for some key variables for the 6 ka climates simulated in the three
experiments. For 6kPI and 6k9k, the averages over the last 100 years of the 2100-year long simulations are shown, while for 6kTR the 100-year means for the 6050–5950 yr BP period are presented. The standard deviations for 6kPI are given between brackets for the 6 ka climate (i.e., the last 100 years of the simulation). For comparison, also the initial values for 6kPI and 6k9k are shown.
Experiments
6kPI 6k9k 6kTR init 6 ka Init 6 ka 6 ka
Global ocean variables
Global ocean temperature (◦C) 3.07 3.11 (0.001) 3.12 3.11 3.11 Sea-ice volume NH (103km3) 43.2 27.8 (1.7) 19.2 28.0 27.8 Sea-ice volume SH (103km3) 11.8 10.4 (0.7) 10.4 10.5 10.7 NADW exported at 20◦S (Sv) 13.7 13.6 (0.8) 13.5 13.7 13.6 Max. Meridional overturning in Southern Ocean (Sv) 19.2 18.9 (1.3) 19.7 19.0 19.1
North Africa (10◦W–35◦E, 15◦N–30◦N) Vegetation cover (%) 27.5 53.4 (1.9) 67.1 55.0 53.9 Surface albedo (%) 34.3 28.8 (0.4) 25.7 28.5 28.7 Temperature (◦C) 24.2 24.4 (0.1) 24.5 24.4 24.4 Precipitation (mm/yr) 269.9 452.9 (12.4) 567.9 463.2 456.7
CPD
2, 315–326, 2006 Initial conditions in simulations of mid-Holocene climate H. Renssen et al. Title Page Abstract Introduction Conclusions References Tables Figures J I J I Back CloseFull Screen / Esc
Printer-friendly Version Interactive Discussion
EGU
Global Ocean temperature
3.070 3.075 3.080 3.085 3.090 3.095 3.100 3.105 3.110 3.115 3.120 0 200 400 600 800 1000 1200 1400 1600 1800 2000 2200 Time (yr) °C 6kPI 6k9k 6kTR (a)
Northern Hemispheric sea-ice volume (10-yr running mean)
15 20 25 30 35 40 0 200 400 600 800 1000 1200 1400 1600 1800 2000 2200 Time (yr) 10 3km 3 6kPI 6k9k 6kTR (b)
Fig. 1. Simulated annual means of the globally averaged ocean temperature (a, top) and
sea-ice volume in the Northern Hemisphere (b, bottom). Note that the forcings for experiments 6kPI
and 6k9k are kept constant at 6 ka values, while the forcings for 6kTR are changing every year. The shown values for 6kTR represent the period 8050 yr BP (t=0) to 5950 yr BP (t=2100). The averages over the last 100 years are presented in Table 1.