HAL Id: hal-00296173
https://hal.archives-ouvertes.fr/hal-00296173
Submitted on 19 Mar 2007
HAL is a multi-disciplinary open access
archive for the deposit and dissemination of
sci-entific research documents, whether they are
pub-lished or not. The documents may come from
teaching and research institutions in France or
abroad, or from public or private research centers.
L’archive ouverte pluridisciplinaire HAL, est
destinée au dépôt et à la diffusion de documents
scientifiques de niveau recherche, publiés ou non,
émanant des établissements d’enseignement et de
recherche français ou étrangers, des laboratoires
publics ou privés.
Airborne measurements of nucleation mode particles I:
coastal nucleation and growth rates
C. D. O’Dowd, Y. J. Yoon, W. Junkerman, P. Aalto, M. Kulmala, H.
Lihavainen, Y. Viisanen
To cite this version:
C. D. O’Dowd, Y. J. Yoon, W. Junkerman, P. Aalto, M. Kulmala, et al.. Airborne measurements of
nucleation mode particles I: coastal nucleation and growth rates. Atmospheric Chemistry and Physics,
European Geosciences Union, 2007, 7 (6), pp.1491-1501. �hal-00296173�
www.atmos-chem-phys.net/7/1491/2007/ © Author(s) 2007. This work is licensed under a Creative Commons License.
Chemistry
and Physics
Airborne measurements of nucleation mode particles I:
coastal nucleation and growth rates
C. D. O’Dowd1, Y. J. Yoon1,2, W. Junkerman3, P. Aalto4, M. Kulmala4, H. Lihavainen5, and Y. Viisanen5
1Dept. of Physics & Environmental Change Institute, National Univ. of Ireland, Galway, University Road, Galway, Ireland 2Korea Polar Research Institute, KORDI, 7-50, Songdo-dong, Incheon 406-840, Korea
3Fraunhofer Inst. for Atmospheric Environmental Research, Kreuzeckbahnstr. 19, 82467 Garmisch-Partenkirchen, Germany 4Department of Physical Sciences, P.O.Box 64 (Gustaf H¨allstr¨omin katu 2) PL 64, 00014 University of Helsinki, Finland 5Finnish Meteorological Institute, Erik Palm´enin aukio, P.O.Box 503, 00101, Helsinki, Finland
Received: 26 April 2006 – Published in Atmos. Chem. Phys. Discuss.: 25 August 2006 Revised: 8 January 2007 – Accepted: 9 February 2007 – Published: 19 March 2007
Abstract. A light aircraft was equipped with a bank of Condensation Particle Counters (CPCs) (50% cut from 3– 5.4–9.6 nm) and a nano-Scanning Mobility Particle Sizer (nSMPS) and deployed along the west coast of Ireland, in the vicinity of Mace Head. The objective of the exercise was to provide high resolution micro-physical measurements of the coastal nucleation mode in order to map the spatial extent of new particle production regions and to evaluate the evolu-tion, and associated growth rates of the coastal nucleation-mode aerosol plume. Results indicate that coastal new par-ticle production is occurring over most areas along the land-sea interface with peak concentrations at the coastal plume-head in excess of 106cm−3. Pseudo-Lagrangian studies of
the coastal plume evolution illustrated significant growth of new particles to sizes in excess of 8 nm approximately 10 km downwind of the source region. Close to the plume head (<1 km) growth rates can be as high as 123–171 nm h−1,
de-creasing gradually to 53–72 nm h−1at 3 km. Further along
the plume, at distances up to 10 km, the growth rates are cal-culated to be 17–32 nm h−1. Growth rates of this magnitude
suggest that after a couple of hours, coastal nucleation mode particles can reach significant sizes where they can contribu-tion to the regional aerosol loading.
1 Introduction
The contribution of natural aerosol particle production to the global aerosol budget is important to quantify since aerosol radiative forcing provides the greatest uncertainty to cur-rent and future climate predictions (Houghton et. al., 2001).
Correspondence to: C. D. O’Dowd
Marine aerosol production and dispersion is of consider-able importance globally given the large oceanic coverage of the Earth’s surface and the underlying low albedo of the ocean surface. In particular, small changes in the availabil-ity of marine stratiform cloud nuclei availabilavailabil-ity can have profound impacts in cloud micro-physics and radiative prop-erties (Slingo, 1999). Various components of the marine aerosol have been implicated in natural feedback processes involving the marine biota, aerosol production and aerosol interactions with clouds and radiation (Charlson et al., 1987; O’Dowd et al., 2004). Despite significant effort, new particle production (via homogeneous nucleation) over the ocean is still a poorly understood phenomenon. Considerable focus in recent years has centred on the production of new par-ticles from the homogeneous nucleation of sulphuric acid, water vapour and ammonia with the sulphuric acid being de-rived from oxidation products of dimeythylsulphide (DMS). Although there is some evidence for DMS-derived sulphuric acid being involved in the particle production process (Clarke et al., 1998), the most robust modelling studies have shown that while nucleation of sulphuric acid can occur, there is insufficient sulphuric acid available to grow the nucleated clusters to detectable sizes at larger than 3 nm (Pirjola et al., 2001; O’Dowd et al, 2003).
The most intense and most frequent particle production events have been observed in coastal regions, presumably where biogenic emissions are enhanced. As far back as 1897, John Aitken (Aitken, 1897) reported elevated concentrations of small particles in coastal air along the Scottish coastline and attributed these to shoreline emissions. The phenomenon of coastal particles has been studied in detail with the aim of elucidating processes likely to be occurring over the open ocean since the strength and frequency of these events were
(a)
(b)
(c)
(d)
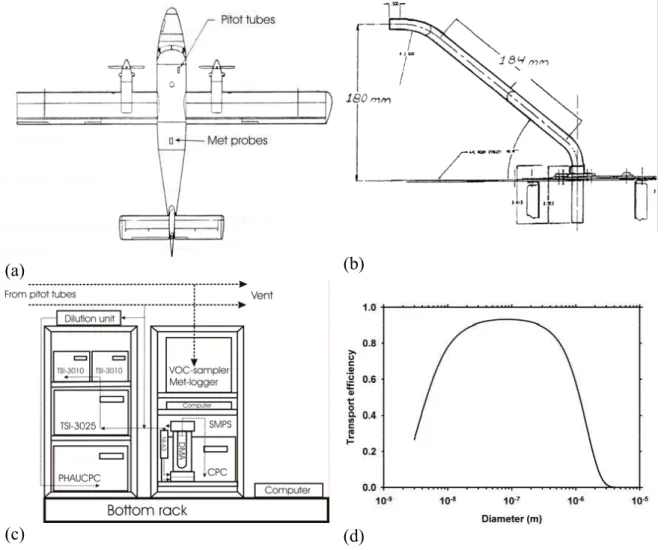
Fig. 1. Schematic of the GTK Twinn Ottor and location of Pitot and met-probe tubes; (b)
Fig. 1. Schematic of the GTK Twin otter and location of Pitot and met-probe tubes; (b) schematic of aerosol Pitot inlet tube; (c) schematic
of aerosol instrumentation rack; (d) calculated aerosol losses of air speed of 0.75×55 m s−1.
high. O’Dowd et al. (1998) linked the occurrence of par-ticle production events at Mace Head to enhanced biogenic emissions under low tide conditions and concluded that they were photochemically-driven (O’Dowd et al., 1999). It was postulated that biogenic iodine oxides were the most likely contributor to coastal nucleation events, although the ex-act mechanism still remains a topic for debate (McFiggans, 2005; O’Dowd et al., 2004).
The PARFORCE (Particle Formation and Fate in the Coastal Environment) project (O’Dowd et al., 2000) focused on the elucidation of the key processes driving coastal nucle-ation events and reported that peak particle concentrnucle-ations could exceed 106cm−3and that formation events could last
up to 8 hours under favourable conditions. The rate for for-mation of 3 nm particles was estimated to be of the order of 104cm−3s−1with nucleation rates being of the order of
106cm−3s−1. Dal Maso et al. (2002), calculated growth
rates of the order of 15–180 nm per hour for typical events
around Mace Head. Growth rates of this magnitude sug-gest that coastal particles could reach cloud condensation nuclei sizes (typically >100 nm) in a matter of hours. The aforementioned growth rates were typically calculated about 100 m from the tidal plume head with minimal dilution of the plume having taken place. To provide a more accurate esti-mate for the growth rates of new particles in coastal aerosol plumes, airborne measurements need to be applied. O’Dowd (2002) conducted airborne measurements in the vicinity of Mace Head onboard the UK Met. Office C-130. During that study, particle production events were observed along the Irish – Atlantic coastline and the coastal plume was ob-served to extend about 250 km downwind. During these stud-ies, both the scattering coefficient and the CCN concentra-tion was observed to increase in the plume; however, no growth rates were calculated. In this study, we present im-proved estimates of coastal aerosol growth rates in the early stages of the development of coastal aerosol plumes on the
North East Atlantic coastline using a light aircraft and an aerosol payload designed to capture microphysical changes in the aerosol size distribution at sizes below 10 nm.
2 Experimental
The project formed the 1st of a series of 3 QUEST inten-sive field studies aimed and quantification of nucleation in the European boundary layer (Laaksonen et al., 2003). The project was based at Mace Head on the Irish Atlantic coast-line. A complete summary of the station and facilities is found in Jennings et al. (2003). The station is subjected to regular clean marine air and many studies have shown that nucleation bursts occur regularly in this location (O’Dowd et al., 1998, 1999). The nucleation events have been linked to the increased emission of biogenic vapours released from macro algae exposed under low tide conditions (O’Dowd et al., 2002a, b).
2.1 Twin Otter
The measurement platform was a DHC-6/300 Twin Otter STOL fixed-wind, twin engine aircraft OH-KOG. The plane was manufactured in Canada by De Havilland Canada 1979. The aircraft is owned and maintained by Finnair and operated by a subsidiary of Finnair, Malmilento. The Geological Sur-vey of Finland is responsible for all the research flights of the aircraft. It has been mainly used for aerogeophysical mea-surements but for these studies, the payload was modified for aerosol and meteorological measurements. A schematic of the aircraft and location of the aerosol inlets and meteoro-logical probes are shown in Fig. 1. Typical air speed was of the order of 55 m s−1.
2.2 Aerosol measurements
The aerosol sample for the instruments was taken through a pitot tube made of Stainless Steel installed to the roof of the airplane, just behind the pilot’s seat on the right side of the plane. The pitot tube inner diameter was 10 mm and it ex-tended 20 cm out from the roof (see Fig. 1). Inside the plane the pitot tube was connected to the Stainless Steel sample line 10 mm of diameter with a straight-angle fitting. The sample line made again a straight angle turn and the sample for the aerosol instruments was taken from the main line through a T-fitting with a Stainless Steel tube of 4 mm inner diameter. The flow of the main sample line was generated using the dynamic pressure of the pitot tube. The outlet of the main sample line was located under the plane. The total length of the sample line was 2.8 m to a distribution point, following which, a further 2.5 m was used to provide flow to the furthest most instrument from the distribution point. The flow veloc-ity in the main sample line was of the order of 30–40 m s−1.
The aerosol setup consisted of three condensation par-ticle counters, one TSI model 3025 with cut off diameter
around three nanometers and two TSI model 3010 coun-ters with measured 50% lower cut-off diamecoun-ters of 5.4 and 9.6 nanometers, a SMPS (Scanning Mobility Particle Sizer) measuring particle size distribution between three and fifteen nanometers. A dilution system was applied for CPC mea-surements, with a ratio of 1 to 7.
The flow speed in the aerosol sampling duct was approx-imately 0.75 of the true air speed. Particle losses are cal-culated for the envelop of sample velocities corresponding to the aircrafts air speed and 50% of the air speed. In-cluded in the calculations were losses due to an-isokinetic sampling, diffusion losses, gravitational losses and impacts in duct bents. It was found that the air speed did not make significant differences to the calculated losses and that the flow was turbulent for the flow regimes used. Particle losses were minimal for sizes of 20 nm to 150 nm and increased to 65% at sizes of 3 nm compared to 30% at 10 nm (See Fig. 1). The concentration of the three CPCs were checked when no nucleation mode was presented and absolute concentra-tions were normalized to the 10 nm CPC. With this system we were able to record the total particle concentration us-ing the TSI model 3025 data and by subtractus-ing the readus-ings between the counters, we got an estimate of the ultrafine par-ticle concentration between 3 and 5.4 nm and 5.4 and 9.6 nm (i.e. the 50% cut-size for the three CPCs used). Since the de-tection efficiency curves are not descending sharply around the cutoff diameters, the calculated ultrafine particle concen-trations are just estimates for the concentration in each size class. The three particle counter readings were recorded once a second.
The SMPS system consisted of TSI model 3025 condensa-tion particle counter, Hauke-type DMA (Differential Mobil-ity Analyzer) and a 370 MBq Ni-63 aerosol neutralizer. The sheath flow rate of the DMA was 15 lpm and aerosol flow rate 1.7 lpm. The sheath flow rate was controlled with a crit-ical orifice and arranged as closed loop. The sheath flow rate was dried. A portable computer and a National Instrument NI DAQCard-6036E was used to scan the DMA voltage, record the voltage, time and particle count from the CPC with ten hertz frequency. Also temperature, humidity and pressure were recorded once during the scan. The scan time was typ-ically thirty seconds. The data was inverted online and both raw data and inverted data were saved to the disk. In the SMPS inversion the measured delay time (1.25 s) from the DMA to the CPC was taken into account but the time con-stant due to the sample “smearing” in the DMA, sampling lines and the CPC was not taken into account because the time constant was fairly small, some tenths of seconds.
2.3 Gas measurements
The gas sample was taken through a similar pitot tube that aerosol sample. The inlet was located behind the aerosol sample inlet and slightly off-shifted from the aerosol. In-side the plane, the pitot tube was connected to the Teflon
(a)
(b)
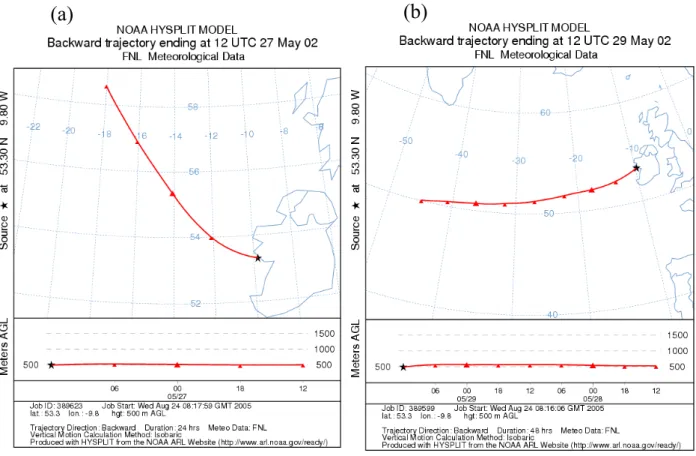
Fig. 2. Air mass back trajectories arriving at Mace Head for (a) on 27 May, 2002 and (b) on 29 May, 2002.
sample line 10 mm of diameter with a straight-angle fitting. The total length of the sample line prior gas samplers was 3 m. The flow of the main sample line was generated using the dynamic pressure of the pitot tube. The outlet of the main sample line was located under the plane. The flow rate in the main sample line was unknown.
A special holder unit was constructed for Tenax tube sam-pling. The Teflon sample line was connected to 12 mm outer diameter and about 35 cm long Stainless Steel tube. Ten 6 mm outer diameter and 2 cm long tubes were welded into this tube. Tenax sampling tubes were connected into these with stainless steel Swagelok fittings. Ozone remover grids were located in the fittings prior the Tenax tubes. Each tube had a valve after it. The valves were connected to same vac-uum line. The flow through the sample tube was controlled with a critical orifice. The flow rate through the Tenax tubes was 260 cm3/min. The holder unit was removable so that Tenax tubes could be changed in clean environment. Typical sampling time was about 10 min. From Tenax tubes monoter-penes and aromatic hydrocarbons were analysed with gas chromatograph with mass selective detector.
For flask samples a pump was connected into the main gas sample line with a Teflon tubing. Pump provided about 1 bar over pressure into to flasks. The time to fill a flask
was about 30 s. Light hydrocarbons (C2-C6) were analyzed
from flask samples. Unfortunately, the gaseous species were below detection on the Mace Head flights and results of these samples over the boreal forests are reported in Part II of these paper.
2.4 Meteorological measurements
Sensors for temperature, relative humidity and solar radia-tion intensity were located on the roof of the airplane, about in the middle of the whole plane. The pressure sensor was lo-cated inside the airplane. Temperature and relative humidity was measured with Vaisala HMP45 D probe. The probe was shielded against direct solar radiation. Pressure was mea-sured with Vaisala PTB101B analog barometer. Total solar radiation was measured with Licor, model LI-200 SZ, pyra-nometer sensor. Position of the airplane was recorded with Garmin GPS receiver with antenna on the roof of the air-plane. Temperature, relative humidity, solar radiation, pres-sure and position were recorded every second.
(a) (b)
Number concentration (cm-3)
1e+2 1e+3 1e+4 1e+5 1e+6
H e ig h t (m ) 0 200 400 600 800 1000 1200 1400 1600
Total particle concentration D > 3 nm
(c)
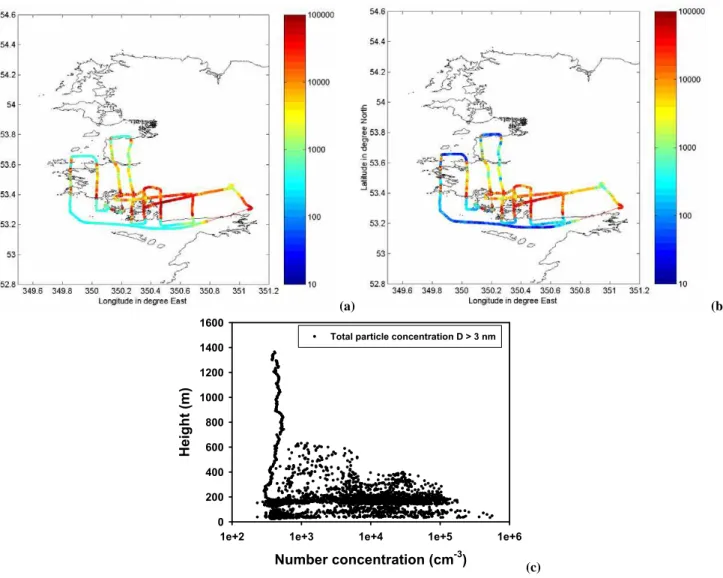
Fig. 3. (a) Total particle concentration for d>3 nm during flight on 27 May 2002. (b) same as (a) except for total particle concentration at
sizes 3<d<10 nm, and (c) Scatter plot of total particle number concentration (D>3 nm) versus height from the mapping flight on 27 May 2002. Concentrations units are particles cm−3.
3 Results
A combination of mapping flights and Lagrangian flights were conducted. The mapping flights focused on locating coastal hot-spots for aerosol production along the coastal zone while the Lagrangian flights were aimed at quantifying aerosol growth in plumes emerging from the hotspots. Two flights are presented in this study.
3.1 Mapping flight
The mapping flight was conducted around the coastal regions of Mace Head on the 27 May 2002. Air mass back trajecto-ries, calculated from HYSPLIT (Draxler et al., 2003), for this day indicate a clean westerly air flow arriving at the station (Fig. 2a).
The aircraft flight departed from Galway, and made way to the Mace Head region over the ocean and clear of any coastal aerosol sources (Fig. 3). The total aerosol concentra-tion was of the order of 500 cm−3in the regions of air flow
not advecting over tidal areas. During this leg, the maximum height the aircraft reached was 1500 m above sea-level (and in the free troposphere) where the total particle concentra-tion was less than 400 cm−3(Refer to Fig. 3c showing
scat-ter plot of total particle concentration for various heights). After reaching the western-most region of the coastline, the aircraft proceeded to map aerosol concentration distributions at 50 m above sea/ground-level. The mapping legs were con-ducted north-south and relocating east and downwind after each transect. Total particle concentration and the concen-tration of particles between 3 nm and 10 nm are shown in Fig. 3. A clear increase in particle concentration is seen
Table 1. Short range Lagrangian run scan information (time, geographical location, log-normal fit modal diameter standard deviation, and
modal concentration).
Time JD Location Mean Diameter (nm) Sigma Total
Production area 053.390 N, 009.798 W 1.0 – –
SD1 149.6189 053.395 N 009.789 W 4.49 1.122 41220
SD2 149.6187 053.401 N 009.780 W 5.44 1.123 12342
SD3 149.6184 053.409 N 009.766 W 6.52 1.128 8063
(a)
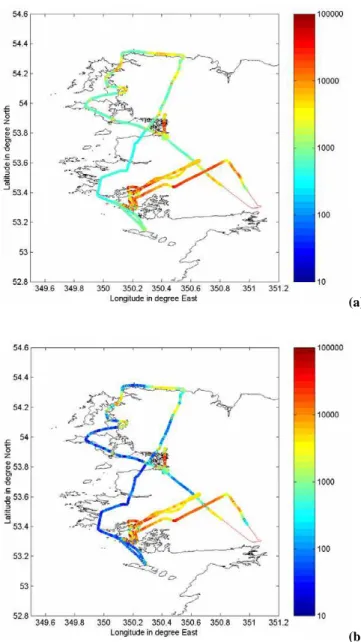
Fig. 4 (a). Total particle concentration for d>3 nm during flight on 29 same as 4(a) except for total particle concentration at sizes 3 < d < 10
(b) Fig. 4. (a) Total particle concentration for d>3 nm during flight
on 29 May 2002, and (b) same as (a) except for total particle con-centration at sizes 3<d<10 nm. Concon-centrations units are particles cm−3.
in all regions downwind of the coastline. Peak concen-trations reached 473 000 cm−3 (not accounting for particle
losses averaging approximately 50% at sizes less than 10 nm) with the strongest signal seen in the region to the south west (Mweenish area) and North (Roundstone area) of Mace Head. The concentrations of particles larger than 10 nm mea-sured from CPC 3010 over these regions remained less than 20 000 cm−3, indicating almost all particles detected are
re-cently formed. These results indicate that there are many sources of new particles along the coastline in the vicinity of Mace Head. In fact, significantly stronger regions other than Mace Head were identified, the strongest being Mweenish and Roundstone. A similar pattern was seen on other flights (see next section) and previously by O’Dowd (2002).
3.2 Lagrangian flights
During the 29 May, the air mass trajectories indicate a south westerly air flow, again in clean marine air (Fig. 2b). As stated above, the strongest source regions were identified as Roundstone and Mweenish. The Roundstone area, to the north-north west of Mace Head, was selected as the starting point of a Lagrangian flight to quantify growth rates of new particles in the coastal plume. The Langranian flight was ac-tually a combined mapping and Lagranigan flight with map-ping performed over a more extensive area compared to the first mapping flight.
At the Mace Head station, there was only very weak evi-dence of a nucleation burst with peak particle concentrations only briefly exceeding 10 000 cm−3. A similar pattern was
seen in the mapping component of the flight with only a few regions exhibiting elevated particle concentrations (Fig. 4). The intensity of nucleation events during this week was con-sidered considerably low by comparison to similar events at the same time of year (O’Dowd et al., 2002a) where particle concentrations were of the order of 106cm−3.
A strong formation of particles was detected over Round-stone area (53.39◦N, 9.80◦W) where seaweeds are widely
found. Meteorological wind conditions for this day were 220◦ direction and speed of 8 ms−1, respectively. The
air-craft flew towards the particle production location (Lag-run
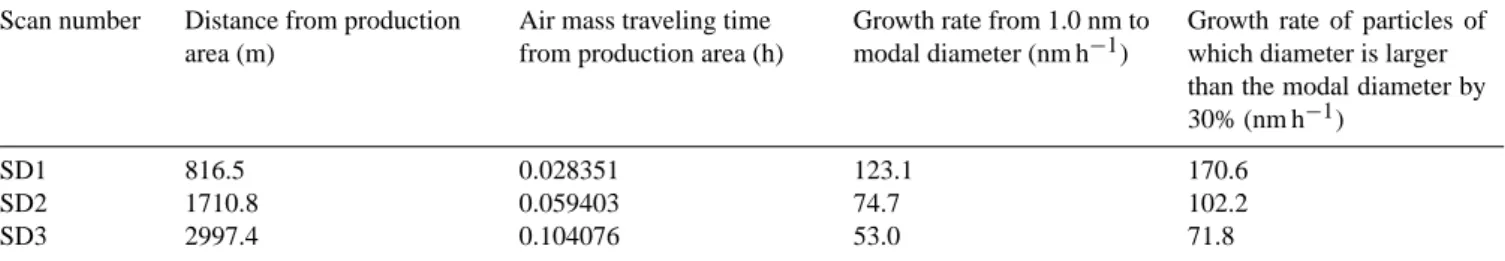
Table 2. Calculated aerosol growth rates from the short range Lagrangian run.
Scan number Distance from production area (m)
Air mass traveling time from production area (h)
Growth rate from 1.0 nm to modal diameter (nm h−1)
Growth rate of particles of which diameter is larger than the modal diameter by 30% (nm h−1) SD1 816.5 0.028351 123.1 170.6 SD2 1710.8 0.059403 74.7 102.2 SD3 2997.4 0.104076 53.0 71.8 (a) Diameter (nm) 4 6 8 10 12 14 16 d N /d lo g D (c m -3) 0 1e+5 2e+5 3e+5 4e+5 SD1: 149.6189 SD2: 149.6187 SD3: 149.6184 (b) Fig. 5. (a) Tajectory of Lag-run 1 to the particle formation region
(grey arrow). The selected particle formation regions are repre-sented in green lines. Blue (SD1), red (SD2), and yellow (SD3) lines correspond to the distance covered by each 20 seconds SMPS scan, with SD1 closest to the source region, and (b) SMPS size dis-tributions for scans over regions SD1, SD2 and SD3. For SD1, only the first modal diameter was used for growth rate analysis.
flew along the wind direction from the source location
(Lag-run 2).
3.2.1 Lag-run 1: short distance Lagrangian run
For Lag-run 1, three spectra were selected to extract growth rate of recently formed particles assuming that particles were formed at production location which is colored as green in Fig. 5. In this figure different colors represent the flying tra-jectory of the aircraft covering range of 3 individual SMPS scans and aerosol number size distributions are presented in Fig. 5. The scanning starting time and location, and log-normal fitting values for each scan are summarized in Ta-ble 1. This taTa-ble also includes location of source region. The mean nucleated particle, or cluster, diameter in the produc-tion zone was assumed to be 1.0 nm.
To calculate growth rates of the coastal nucleation mode, the distances from the production location to each of the scan area mid-points were calculated, then the time needed for the air mass to travel from the source region to each scan lo-cations was derived by assuming a wind speed of 8 ms−1.
Growth rates of the recently formed particles were calculated by assuming an initial diameter of 1.0 nm and then quantify-ing the modal diameter for the appropriate scans. The dis-tance from the production area, time travelled from the pro-duction area and the growth rates are presented in Table 2. Two growth rates are presented – one for the modal diameter growth and another for the growth rate of particles with di-ameter 30% larger that the modal didi-ameter. A bimodal size distribution was observed from the SD1 scan. The second size mode around 7 nm was not considered in the growth rate calculation, which is believed to grow into the larger sizes than the SMPS scanning rage.
Closest to the source (817 m), a growth rate of 123 nm h−1
was observed, reducing to 75 nm h−1 at 1710 m and to
53 nm h−1at 2997 m. From these results, it can be observed
that significant particle growth is observed close to the plume head, in agreement with previous ground based studies, and that this growth rates reduce with distance from the source in-dicating that gases responsible for condensation growth are diluted.
(a) Diameter (nm) 4 6 8 10 12 14 16 d N /d lo g D (c m -3) 0 1e+5 2e+5 3e+5 4e+5 LD1: 149.6285 LD2: 149.6287 LD3: 149.6290 LD4: 149.6292
Fig. 6 (a). Trajectory of Lag-run 2 from the particle f (b) Fig. 6. (a) Trajectory of Lag-run 2 from the particle formation
region (grey arrow). The selected particle formation regions are represented in green lines. Blue (LD1), red (LD2), yellow (LD3) and purple (LD4) lines correspond to the distance covered by each 20 seconds SMPS scan, with LD1 closest to the source region, (b) SMPS size distributions from scans corresponding to regions LD 1-4. Each scan has 2 modal diameters, so growth rates were separately calculated for 1st and 2nd modal diameters.
3.2.2 Lag-run 2: long distance Lagrangian run
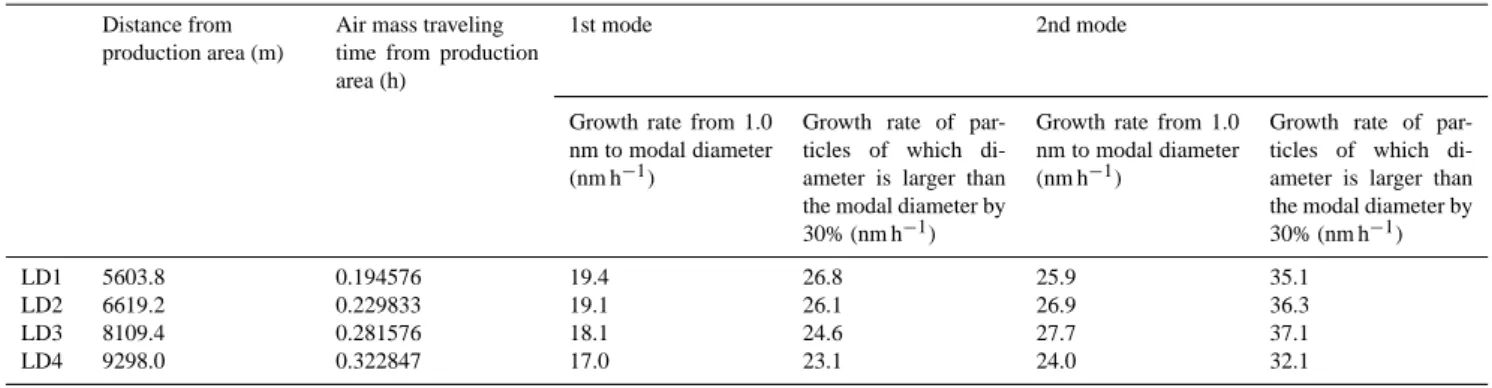
From Lag-run 2, four spectra were selected. The produc-tion locaproduc-tion was assumed to be same as Lag-run 1. As is seen in Fig. 6, four successive scans were done relatively far from the source location and size spectra posses 2 modes and 2 modal diameters, suggesting perhaps more than one source region along the trajectory or nearby plumes of dif-fering condensable vapour source strengths mixing. For the analysis presented here, the latter assumption is made. Ta-bles 3 and 4 summarize physical properties of each scan
(a) Time (minute) 0 2 4 6 8 10 12 14 16 18 20 22 G ro w th r a te (n m h -1) 0 20 40 60 80 100 120 140 (b) Particle diameter (nm) 4 5 6 7 8 9 10 G ro w th r a te ( n m h -1) 0 20 40 60 80 100 120 140
Fig. 7. Growth rates as a function of (a) air mass aging time and (b)
particle modal diameter.
and growth rate for 2 modal diameters, in a same manner as Lag-run 1. At a distance of 5600 m, the growth rate of mode 1 is 19.4 nm h−1while the growth rate for mode 2 is
25.9 nm h−1. For the growth rates of diameters 30% larger
than the modal diameter, the respective values are 26.8 and 35.1 nm h−1. The growth rates for both modes again
gradu-ally decrease with decreasing distance and the rate for mode 1 at a distance of 9298 m was 17.0 nm h−1, while for mode 2,
it was 24.0 nm h−1. These results illustrate that even at a
dis-tance of 10 km from the source, the nucleation mode growth rate is significant, despite dilution. Although a gradual de-cline of growth rate occurs with increasing distance, at these distances the reduction in the growth rates is becoming min-imal.
3.2.3 Combination of short and long distance Lagrangian run
Growth rates derived during the two types of Lagrangian run showed a decreasing pattern as the air mass age. The change of growth rate as a function of time and modal diameter in an
Table 3. Long range Lagrangian run scan information (time, geographical location, log-normal fit modal diameter standard deviation, and
modal concentration).
Time JD Location 1st mode 2nd mode
Mean Diameter (nm) Sigma Total Mean Diameter (nm) Sigma Total
Production area 053.390 N 009.798 W 0.5 – – – – –
LD1 149.6285 053.395 N 009.714 W 4.78 1.156 29766 6.03 1.248 40511
LD2 149.6287 053.401 N 009.700 W 5.38 1.130 12706 7.19 1.100 4143
LD3 149.6290 053.411 N 009.681 W 6.10 1.154 13198 8.80 1.092 2646
LD4 149.6292 053.418 N 009.666 W 6.50 1.128 7815 8.75 1.092 2620
Table 4. Calculated aerosol growth rates from the long range Lagrangian run.
Distance from production area (m)
Air mass traveling time from production area (h)
1st mode 2nd mode
Growth rate from 1.0 nm to modal diameter (nm h−1)
Growth rate of par-ticles of which di-ameter is larger than the modal diameter by 30% (nm h−1)
Growth rate from 1.0 nm to modal diameter (nm h−1)
Growth rate of par-ticles of which di-ameter is larger than the modal diameter by 30% (nm h−1)
LD1 5603.8 0.194576 19.4 26.8 25.9 35.1
LD2 6619.2 0.229833 19.1 26.1 26.9 36.3
LD3 8109.4 0.281576 18.1 24.6 27.7 37.1
LD4 9298.0 0.322847 17.0 23.1 24.0 32.1
air mass are shown in Fig. 7. The increasing 2nd modal diam-eters obtained during the long-range Lagrangian run were not taken into account because the source region of these modes cannot be defined as clearly as the first modes. It was found that growth rate of freshly formed particles decrease dramat-ically as the air mass ages. The growth rate of freshly formed particles was higher than 100 nm h−1, and this rate decrease
rapidly until the saturation point achieved in 12 min showing the rage of 20 nm h−1–40 nm h−1which is equivalent to 7 nm
diameter.
The decrease of the growth rate as a function of size seems to contradict with the recent observation by Kulmala et al. (2004b) showing that growth rate will increase as a func-tion of size. However, this is not the case, since here the di-lution will decrease both particle concentration (decreasing growth due to reduced coagulation) and vapor concentration (decreasing the growth due to reduced condensation).
There have been a number of works on the growth rates of freshly formed particles, and these results were summarized in Kumala et al. (2004). Kulmala et al. (2004) surveyed pub-lished data on the particle formation and reported that typi-cal particle growth rates range from 1 nm h−1to 20 nm h−1
depending on the place of particle formation and condens-ing vapour availabilities. Particle growth rates at rural and urban areas are typically smaller than 10 nm h−1(Shi et al.,
2001; Weber et al., 1997; Birmili et al., 2001; Kulmala et al., 1998; Aalto et al., 2001). Growth rates at polar regions usu-ally range from 0.1 to 2 nm h−1even under a polar coastal
environment due to low temperature and lack of condens-ing vapour gases (Gras, 1993; Park et al., 2003; Ito, 1993). Previous study by O’Dowd et al. (2002) and Dal Maso et al. (2002) reported growth rate of recently formed particles as 15–180 nm h−1at Mace Head based on the in-situ
mea-surements during PARFORCE campaign. It is mostly likely that particles formed at coastal environment can grow much faster than any other other locations due to the abundance of condensing vapours, and pseudo-Lagrangian study of our work also supports this hypothesis. Our Lagrangian study showed that freshly formed particles in a same air mass can grow rapidly when 3–4 nm particles occupy majority of num-ber concentrations. This rapid growth is hindered by the consumption of condensing or nucleating vapours, due to in-creasing particle surface area. Nevertheless, the growth rates for 7–8 nm diameter particles are still around 20–40 nm h−1,
showing significantly larger value than those observed in continental particle production event.
4 Conclusions
Two flights mapping particle formation along the Irish At-lantic coastline and studying aerosol evolution in the coastal plume are presented. It was found that formation is almost ubiquitous along the Irish coastline with particle concentra-tions exceeding 106cm−3in the coastal plume head where
the mean particle size is about 3 nm. The formation is ob-served inside the boundary layer. As the coastal plume ad-vects downwind (approximately 50 km), the mean size in-creases from 3 nm to >10 nm. Close to the plume head (<1 km) growth rates can be as high as 123–171 nm h−1,
de-creasing gradually to 53–72 nm h−1at 3 km. Further along
the plume, at distances up to 10 km, the growth rates are cal-culated to be 17–32 nm h−1. Growth rates of this magnitude
suggest that after a couple of hours, coastal nucleation mode particles can reach significant sizes where they can contribu-tion to the regional aerosol loading.
The observed growth rates in the coastal environment are significantly higher than in any other environments. How-ever, after couple of minutes (kilometers) the growth seems to reduce at the level of 20 nmh−1, which has been observed
also in other (mainly urban) conditions. This high growth rate indicates high concentration of condensable vapors typi-cally order of tens of ppt, and the reduction indicated dilution of condensable gases.
In future studies the coastal nucleation and subsequent growth should be parameterized to use this knowledge in air quality and global models. The further analysis would also include the analysis of condensation and coagulation sinks and the contribution of coagulation on growth processes.
Acknowledgements. This work was supported by the Eu-ropean Commission under Contract EVK2-CT2001-00127 (QUEST). The authors gratefully acknowledge the NOAA Air Resources Laboratory (ARL) for the provision of the HYS-PLIT transport and dispersion model and/or READY website (http://www.arl.noaa.gov/ready.html) used in this publication. Y. J. Yoon appreciate support from project PE06030 funded by the Korea Polar Research Institute.
Edited by: K. H¨ameri
References
Aalto, P., H¨ameri, K., Becker, E., Weber, R., Salm, J., M¨akel¨a, J. M., Hoell, D., O’Dowd, C. D., Karlsson, H., Hansson, H.-C., V¨akev¨a, M., Koponen, I. K., Buzorius, G., and Kulmala, M.: Physical characteristics of aerosol particles in boreal forests, Tel-lus B, 53, 344–358, 2001.
Aitken, J. A.: On some nucleiof cloudy condensation, Trans. R. Soc. Edinburgh, XXXIX, 1897.
Birmili, W., Galgon, D., Wiedensohler, A., M¨uller, K., Choularton, T. W., Bower, K. N., Frank, G., Karlsson, M., and Martinsson, B.: Evolution of the ine particle distribution in the outflow of a city, J. Aerosol Sci., 32, S193–194, 2001.
Charlson, R. J., Lovelock, J. E., Andreae, M. O., and Warren, S. G.: Oceanic Phytoplankton, Atmospheric Sulfur, Cloud Albedo And Climate, Nature, 326, 655–661, 1987.
Clarke, A. D., Davis, D., Kapustin, V. N., Eisele, F., Chen, G., Paluch, I., Lenschow, D., Bandy, A. R., Thornton, D., Moore, K., Mauldin, L., Tanner, D., Litchy, M., Carroll, M. A., Collins, J., and Albercook, C.: Particle nucleation in the tropical bound-ary layer and its coupling to marine sulfur sources, Science, 282, 89–92, 1998.
Dal Maso, M., Kulmala, M., M¨akel¨a, J., Aalto, P., and O’Dowd, C. D.: Condensation and coagulation sinks and the formation of nucleation mode particles in coastal and boreal forest boundary layers, J. Geophys. Res., 107, 8097, doi:10.1029/2001JD001053, 2002.
Draxler, R. R. and Rolph, G. D.: HYSPLIT (HYbrid Single-Particle Lagrangian Integrated Trajectory) Model access via NOAA ARL READY Website http://www.arl.noaa.gov/ready/hysplit4.html, NOAA Air Resources Laboratory, 2003.
Houghton, J. T., Ding, Y., Griggs, D. J., Noguer, M., van der Linden, P. J., and Xiaosu, D.: Climate Change 2001: The Scientific Basis, Cambridge University Press, UK, Cambridge, 944 pp., 2001. Ito, T.: Size distribution of Antarctic submicron aerosols, Tellus B,
45, 145–159, 1993.
Kulmala, M., Laakso, L., Lehtinen, K. E. J., Riipinen, I., Dal Maso, M., Anttila, T., Kerminen, V.-M., Horrak, U., Vana, M., and Tam-met, H.: Initial steps of aerosol growth, Atmos. Chem. Phys., 4, 2553–2560, 2004b.
Kulmala, M., Toivonen, A., M¨akel¨a, J. M., and Laaksonen, A.: Analysis of the growth of nucleation mode particles observed in Boreal forest, Tellus B, 50, 449–462, 1998.
Kulmala, M., Vehkam¨aki, H., Pet¨aj¨a, T., Dal Maso, M., Lauri, A., Kerminen, V.-M. Birmili, W., and McMurry, P. H.: Formation and growth rates of ultrafine atmospheric particles: a review of observation, J. Aerosol Sci., 35, 143–176, 2004.
Laaksonen, A, Kulmala, M, O’Dowd, C. D., Viisanen, Y, Nils-son, D, Facchini, M. C., Hoffmann, T, Arnold, F., Schell, B., and Junkermann, W.: Preliminary results from the Quest project (quantification of aerosol nucleation in the European boundary layer), in: Abstracts of the European Aerosol Conference 2003, Madrid, Spain, 31 August–5 September 2003, Vol. 2, p. S1337– S1338, 2003.
McFiggans, G.: Marine aerosols and iodine emissions, Nature, 433, doi:10.1038/nature03372, 2005.
O’Dowd, C. D., Geever, M., Hill, M. K., Jennings, S. G., and Smith, M. H.: New particle formation: Spatial scales and nucleation rates in the coastal environment, Geophys. Res. Lett., 25, 1661– 1664, 1998.
O’Dowd, C. D., McFiggens, G., Pirjola, L., Creasey, D. J., Hoell, C., Smith, M. H., Allen, B., Plane, J. M. C., Heard, D. E., Lee, J. D., Pilling, M. J., and Kulmala, M.: On the photochemical pro-duction of new particles in the coastal boundary layer, Geophys. Res. Lett., 26, 1707–1710, 1999.
O’Dowd, C. D., Jimenez, J. L., Bahreini, R., Flagan, R. C., Seinfeld, J. H., Pirjola, L., Kulmala, M., Jennings, S. G., and Hoffmann, T.: Marine particle formation from biogenic iodine emissions, Nature, 417, 632–636, 2002b.
O’Dowd, C. D., Jimenez, J. L., Bahreini, R., Flagan, R. C., Sein-feld, J. H., Pirjola, L., Kulmala, M., Jennings, S. G., and Hoff-mann, T.: Marine aerosols and iodine emissions, Nature, 433,
doi:10.1038/nature03373, 2005.
O’Dowd, C. D., H¨ameri, K., M¨akel¨a, J. M., Pirjola, L., Kulmala, M., Jennings, S. G., Berresheim, H., Hansson, H.-C., de Leeuw, G., Allen, A. G., Hewitt, C. N., Jackson, A., Viisanen, Y., and Hoffmann, T.: A dedicated study of new particle formation and fate in the coastal environment (PARFORCE): Overview of ob-jectives and initial achievements, J. Geophys. Res., 107, 8108, doi:10.1029/2001000555, 2002a.
O’Dowd, C. D.: On the spatial extent and evolution of coastal aerosol plumes, J. Geophys. Res., 107, 8105, doi:10.1029/2001JD000422, 2002.
Pirjola, L., O’Dowd, C. D., Brooks, I. M., and Kulmala, M.: Can new particle formation occur in the clean marine boundary layer?, J. Geophys. Res., 105, 26 531–26 546, 2000.
Shi, J. P., Evans, D. E., Khan, A. A., and Harrison, R. M.: Sources and concentration of nanoparticles (<10 nm in diameter) in the urban atmosphere, Atmos. Environ., 35, 1193–1202, 2001. Silver Spring, M. D. and Gras, K. J.: Condensation nucleus size
distribution at Mawson, Antarctica: Seasonal cycle, Atmos. En-viron. A, 27, 1417–1425, 1993.
Slingo, A.: Sensitivity of the Earth’s radiation budget to changes in low clouds, Nature, 343, 49–51, 1990.
Weber, R. J., Marti, J. J., McMurry, P. H., Eisele, F. L., Tanner, D. J., and Jefferson, A.: Measurements of new particle formation and ultrafine particle growth rates at a clean continental site, J. Geophys. Res., 102, 4375–4385, 1997.