HAL Id: hal-00302783
https://hal.archives-ouvertes.fr/hal-00302783
Submitted on 22 Sep 2006
HAL is a multi-disciplinary open access
archive for the deposit and dissemination of
sci-entific research documents, whether they are
pub-lished or not. The documents may come from
teaching and research institutions in France or
abroad, or from public or private research centers.
L’archive ouverte pluridisciplinaire HAL, est
destinée au dépôt et à la diffusion de documents
scientifiques de niveau recherche, publiés ou non,
émanant des établissements d’enseignement et de
recherche français ou étrangers, des laboratoires
publics ou privés.
Received: 20 December 2005 – Revised: 12 June 2006 – Accepted: 21 June 2006 – Published: 22 September 2006
Abstract. We study the formation of a very thin current sheet
(CS) and associated plasma electrodynamics using three-dimensional (3-D) particle-in-cell simulations with ion to electron mass ratio M/m=1836. The CS is driven by imposed anti-parallel magnetic fields. The noteworthy features of the temporal evolution of the CS are the following: (i) Steep-ening of the magnetic field profile Bx(z) in the central part
of the CS, (ii) Generation of three-peak current distribution with the largest peak in the CS center as Bx(z) steepens, (iii)
Generation of converging electric fields forming a potential well in the CS center in which ions are accelerated. (iv) Elec-tron and ion heating in the central part of the CS by
current-driven instabilities (CDI). (v) Re-broadening of the CS due
to increased kinetic plasma pressure in the CS center. (vi) Generation of electron temperature anisotropy with temper-ature perpendicular to the magnetic field being larger than the parallel one. (vii) Current disruption by electron trapping in an explosively growing electrostatic instability (EGEI) and electron tearing instability (ETI). (viii)The onset of EGEI co-incides with an increase in the electron temperature above the temperature of the initially hot ions as well as the appearance of new shear in the electron drift velocity. (ix) Bifurcation of the central CS by the current disruption. (x) Magnetic re-connection (MR) beginning near the null in Bxand
spread-ing outward. (xi) Generation of highly energized electrons reaching relativistic speeds and having isotropic pitch-angle distribution in the region of reconnected magnetic fields. We compare some of these features of the current sheet with re-sults from laboratory and space experiments.
1 Introduction
Formation of thin current sheets (TCS) of widths of the order of ion skin depth (λi)is now confirmed by satellite
observa-tions (Pulkkinnen et al., 1993, 1994; Sergeev et al., 2003, Correspondence to: N. Singh
(singh@ece.uah.edu)
1998; Hoshino et al., 1996; Runov et al., 2003a, b). The stability of such current sheets has been extensively stud-ied (e.g., see B¨uchner and Zelenyi, 1987; Pellat et al., 1991; Lakhina et al., 1993). It is becoming increasingly evident that the TCS might have current profiles significantly differ-ent from that in a Harris currdiffer-ent sheet (CS) (Harris, 1962). Bifurcated current sheets (BCS) have been observed from Geotail (Hoshino et al., 1996) and more recently from Clus-ter (Baumjohan and Nakamura, 2002; Runov et al., 2003a, b). The cluster satellites have also revealed CSs with triple peaks having a sharp peak in the center and two side peaks; rectangular and asymmetric shapes have been also observed (Nakamura et al., 2004; Zelenyi, 2004). In view of such ob-servations new theoretical studies on the formation of thin current sheets are appearing (Sitnov et al., 2003; Zelenyi et al., 2004). These studies construct one-dimensional solutions of relevant plasma equations for a steady-state CS including the anisotropy of electron and/or ion temperatures.
Besides TCSs having thickness of the order of λi, now
even thinner current sheets have been reported from satel-lite observations having thickness of the order of the electron skin depth. Wygant et al. (2005) recently reported observa-tions from Cluster that extremely thin current sheets (ETCS) of widths as thin as few times the electron skin depth (λe)
are embedded within the TCSs of scale size λi. The TCSs
perhaps are embedded in even wider current sheets. Wygant et al. (2005) reported the following features of ETCSs in the magneto-tail: (i) the widths of ETCSs are a few electron skin depth (∼3λe)and they are embedded in a wider CS of thick-ness (∼40λe); (ii) the ETCSs are bifurcated with a current disruption in the middle; (iii) the embedded ETCSs are co-located with a deep negative potential well and (iv) the un-magnetized ions in the CS are accelerated into the potential well. We have previously reported such features of ETCSs from 3-D kinetic simulations (Singh, 2004) including its for-mation and subsequent bifurcation due to current disruption by current-driven instabilities.
al., 1998, 1999, 2002; Shay et al., 1998, 2003; Rogers et al., 2001). Major results of such 2-DPIC simulations are the real-ization that electron pressure anisotropy (Hesse et al., 1998; 1999), whistler waves and kinetic Alfv´en waves play key role in mediating reconnection in thin current sheets with scale size less than ∼λi (Rogers et al., 2001; Shay et al., 1998).
Another set of 2-D simulations have shown that, in an ini-tialized current sheet lower hybrid drift instability (LHDI) first occurs in the outer regions where the density gradients are large. The LHDI triggers drift kinetic instability (DKI) in the central part of the CS affecting magnetic reconnection (Ozaki et al., 1996; Silin and B¨uchner, 2003a, b; Horiuchi and Sato, 1999). 3DPIC simulations of current sheets are reported by Horiuchi and Sato (1999), Zeiler et al. (2002), Drake et al. (2003), Singh (2004) and Pritchett and Coroniti (2004). Horiuchi and Sato compared the reconnection with and without a convection electric field showing that when the convection electric field penetrates into the neutral sheet region reconnection might occur, otherwise the LHDI fol-lowed by DKI triggers reconnection. In the work of Zeiler et al. (2002), Drake et al. (2003) and Pritchett and Coroniti (2004) the nonlinear evolution of the magnetic reconnection was studied in response to initialized magnetic field pertur-bations reconnecting the anti-parallel magnetic field lines. These simulations with guide fields revealed interesting non-linear features of plasma and fields as the initialized recon-nection progressed; some of the noteworthy features are the generation of parallel electric fields, parallel acceleration of electrons, electron hole turbulence and density cavity forma-tion. Cattell et al. (2005) have shown that in 2-D PIC simula-tions electron holes also form if the size of the simulation box is sufficiently long along the anti-parallel magnetic fields. Scholer et al. (2003) reported 3-D simulations with and with-out a guide field demonstrating that in a CS of scale size λi
reconnection processes are driven by lower hybrid drift insta-bilities (LHDI) without the help of DKI; for this purpose they used a sufficiently high ion to electron mass ratio M/m=150. The nonlinear processes associated with LHDI were further studied by Doughton et al. (2004) in a 2-D simulation with a mass ratio M/m=1836, showing that LHDI introduces sub-structures in the current distribution due to the electron dy-namics in the CS. The substructure includes bifurcation of the CS by enhancement of the current near the current sheet edges.
tures of ETCSs reported from Cluster (Wygant et al., 2005); the observed bifurcated CS of scale size ∼λehave nearly zero
current at the center and not nearly the initial maximum cur-rent as determined without the effect of LHDI in the 2-D sim-ulation of Doughton et al. (2004). The Cluster observation of bifurcated ETCSs with zero current at the center having sim-ilarity with our previous simulation has prompted us to do similar simulations with certain improvements as discussed below.
In our previous simulation we used an artificially low ion to electron mass ratio M/m=16. We point out that most of the recent 3-D simulations of reconnection use artificially low mass ratio. For example, Horiuchi and Sato (1999), Zeiler et al. (2002), Drake at al. (2003) and Pritchett and Coroniti (2004) used M/m=100. This lowering of the ion mass signif-icantly reduces the ion cyclotron period and introduces the ion-cyclotron dynamics in the simulation at a much faster time scale than might occur in real situations. This might shorten the time when only the electron-cyclotron dynam-ics might dominate in the formation and evolution of current sheets. Thus, electron-MHD (EMHD) type of flows consist-ing of magnetized electrons and un-magnetized ions in cur-rent sheets could be relevant for a longer time period even on spatial scales comparable to the ion Larmor radius after the introduction of the magnetic perturbations, which initiate magnetic reconnection. Consequences of such limitations of artificially low ion to electron mass ratio remain largely unexplored. We have performed a new set of simulations with M/m=1836 and also with different scale sizes of the ex-ternal anti-parallel magnetic field, which drives the simula-tions. The purpose of this paper is to present results from these new simulations focusing on the following points: (i) Thinning of a CS forming ETCS, (ii) Formation of multiple peaks in the current distribution, (iii) Generation of electric fields normal to the CS plane, (iii) Ion acceleration by the normal electric fields, (iv) The nature of the current-driven electrostatic instabilities inside the CS, (v) Onset of electron tearing mode and magnetic reconnection (MR) near the mag-netic field null, (vi) Outward expansion of the MR-associated electromagnetic plasma turbulence, and (vii) Electron and ion acceleration including production of relativistic isotropic electron population in the CS. We point out that the first three items mentioned here are essentially the features of EMHD flows. We compare the features of the current sheets seen in
Fig. 1. Temporal evolution of the distribution of (a) current Jy(z) and (b) electron density ne. Times are labeled in units of ω−po1. The dotted
horizontal lines are separated by 2Jthin the current panel and 2noin the density panel. Initial normalized density is unity.
the simulations with those observed from Cluster (Wygant et al., 2005).
2 Simulation method
Our simulation method is described in detail in Singh (2004). We simulate a 3-D volume of plasma of size Lx×Ly×Lz. We
impose anti-parallel magnetic field
Bxo=Botanh[(z − Lz/2)/L]ax. (1) Initially at time t =0, the simulation box is filled with a uni-form plasma with Maxwellian electrons and ions having ion and electron temperatures Ti=2Te and Te=To, respectively.
This initial condition allows us to study the processes in-volved in the formation of a current sheet. In many theo-retical and simulation studies, it is common to use an initial equilibrium with pressure balance across the CS. This initial equilibrium is either unstable due to some inherent instability processes due to the structure of the current sheet and elec-tron and ion drifts in it or it is made unstable by artificially introducing perturbations. The initial conditions used in this paper presents a continuum of processes occurring both dur-ing and after the CS formation includdur-ing magnetic reconnec-tion. In this paper we have limited to extremely thin cur-rent sheets of scale size L of the order of a few electron skin depth λe.
In previously reported simulations using a 3-D electro-magnetic particle-in-cell (3-D EMPIC) code, we had chosen L=λeand studied the instabilities in such a thin current sheet
(Singh, 2004) with ion to electron mass M/m=16. In the sim-ulations presented here we have varied L from λeto 4λein a
proton plasma having ion to electron mass ratio M/m=1836. The simulation with the largest value of L in (Eq. 1) revealed interesting plasma processes affecting the dynamical evolu-tion of a thin CS from one form of current distribuevolu-tion to an-other. Since recent Cluster observations have begun to reveal
CS with scale size of few times λe (Nakamura et al., 2004;
Wygant et al., 2005) in the Earth’s magnetotail, we believe the physics revealed by our simulations is relevant to space plasma physics dealing with the complex MR problem. We used Lx=Ly=32λdoand Lz=256λdo, where λdois the Debye
length in the initial plasma. The magnetic field Boin Eq. (1)
is chosen to yield maximum electron cyclotron frequency
eo=0.5ωpo, where ωpo is the electron plasma frequency
with the initial density no. The numerical grid size in all three
dimensions is λdo(1x=1y=1z=λdo)and each cubic cell of
this size contains 25 pairs of electrons and ions as macro-particles. We treat the evolution of the plasma and fields by solving the equations of motions of the macro-particles and Maxwell equations using particle-in-cell method (PIC) (Birdsall and Langdon, 1985).
For future reference, we point out the following spatial and temporal scales in the simulation: electron skin depth
λe=10λdo, ion skin depth λi=428λdo, electron Larmor radius ρe≥2λdo, ion Larmor radius ρi≥120λdo, electron plasma
pe-riod τpe=6.28 ω−po1, electron cyclotron period τce=12.5ω−po1,
ion plasma period τpi=270ω−po1 and ion cyclotron period τci=22950ω−po1. Simulation is advanced in time with a time
step 1t=0.02ω−po1. The ion-acoustic and Alfv´en speeds are Cs=0.06 Vteoand VA=0.12 Vteo, where Vteois the electron
thermal velocity with electron temperature Toin the initial
plasma.
3 Numerical results
We performed three simulations with (i) L=12λdo=1.2λe,
(ii) L=24λdo=2.4λe and (iii) L=36λdo=3.6λe and all have
M/m=1836. The simulation with L=12λdo yielded results
quite similar to that reported previously in Singh (2004), ex-cept that evolution was slowed down by the large ion mass. We mainly discuss here the results from the third run with L=36λdo=3.6λe, which reveals the thinning of the current
Fig. 2. Evolution of current distribution Jy(z) is shown by surface plots at some selected times as labeled. Note that Jy(z) first grows, then its
distribution thins, develops secondary peaks as indicated by arrows. At even later times it re-broadens and the central peak bifurcates.
sheet and associated processes more clearly than the other two runs with already thin current sheets.
3.1 Current sheet formation and thinning
We first summarize the salient features of the evolution of the current distribution in a current sheet in response to the magnetic field being imposed on the plasma at t=0. This is followed by a detailed discussion on the plasma processes involved in the evolution and their effects on the plasma in the CS. Figure 1a shows the evolution of the current distri-bution over a time period up to t=900ω−po1. The correspond-ing evolution of the density profile is shown in Fig. 1b. Fig-ure 1a shows Jy(z) averaged over the x-y plane. As early
as t=50ω−1
po a current sheet has developed with peak current
density Jym∼1.5 Jth, where Jth=noeVteo, the thermal current
density in the plasma with initial density noand electron
ther-mal velocity Vteo. Since initially we have Jy=0, it is natural
to ask how does this current arise? In the simulation, the main cause for the initiation of the current is the generation of an electric field Ey, given by the Maxwell equation ∂Ey/∂t = (µoεo)−1(∂Bx/∂z) − εo−1Jy. (2)
When Jy∼0, the magnetic field gradient generates Ey,
which accelerates electrons especially in the region of low B and large electron cyclotron periods. As soon as the electrons begin to accelerate in -y direction, they feel J×B force caus-ing the generation of Hall electric field Ez pointing toward
the CS center as explained later in detail. Then the Ez×Bx drift maintains the current. The electric field Ey initiating
the current is seen to last until t∼200ω−po1. This transient Ey
plays the same role in the simulation as the induced electric fields in the experiments of Syrovatskii et al. (1973, 1981) and Stenzel and Gekelman (1981).
By the time t=100ω−po1, Jymhas grown to ∼2.2Jth(Fig. 1a)
and the current distribution has a single peak. The plots at t=300ω−po1and 500ω−po1show that the main peak in the current distribution has considerably thinned. The thinning of the CS is more clearly seen in Fig. 2, which is a surface plot of Jy(x,
y=16, z) in the x-z plane. We see that the current sheet is the thinnest at t∼400ω−po1and it is beginning to develop ad-ditional weaker peaks on both sides of the large-amplitude main peak. The additional secondary peaks, as indicated by the arrows, are well developed at t=600 and 800ω−1
po with
amplitudes ∼20% of the main central peak. The three-peak feature of the composite CS continues until the main central peak bifurcates after t ≥900ωpo−1. Note that before the bifur-cation of the main peak, it widens for t ≥600ωpo−1. Also note the growth of the large-amplitude spatial oscillations in Jy(z)
for t>400ω−po1.
Figure 1b shows the evolution of electron density ne(z).
The curves in this figure correspond to Jy(z) in Fig. 1a. Ion
density, ni(z), follows ne(z) except when large-amplitude
os-cillations set in the fields and the current Jy(z) at late times
as seen in Fig. 2. Note the increase in the plasma density by nearly a factor of two in the central region while the den-sity has decreased in the outer region after t∼400ω−po1. This readjustment of the density distribution implies transport of plasma from the outer to the inner regions of the CS; the mechanism of the transport is discussed later.
Fig. 3. (a) Evolution of Bx(z) corresponding to the evolution of
Jy(z) in Fig. 1. Note the steepening of Bx(z) in the CS central
re-gion. (b) The steepened Bx(z) at t=500ω−po1and a fit of Harris
dis-tribution shown by the red line. (c) The magnetic field perturbation bx(z) affecting Bx(z) in (a).
Figure 3a shows the evolution of the CS as manifested in the magnetic field distribution Bx(z), which is plotted at
selected times. The curve (black) at t=100ω−1
po is nearly
the same as the initial profile given in (1). The subsequent profiles from t=300ω−1
po to 700ω−po1 (blue to red) show that
Bx(z) is progressively steepened in the central region over
80<z/λdo<176, which is about δz∼9.6λe wide, where λe
is the electron skin depth (λe∼10λdo). The steepening is
achieved by the increase in Bxin the immediate
neighbor-hood of the central line z=128 and decreases further away near the boundaries z=0 and 256λdo. The increased slope
of Bx(z) in the central part and the decreased slopes in the
Fig. 4. Electric field Ez(z) (solid line), steepened Bx(z) (dotted line)
and initial Bx(z) (long-dashed line).
outer regions represents the three-peak current sheet in Fig. 2 for 600ωpo−1<t<800ω−po1. We have fitted a Harris distribu-tion given by B=0.4 tanh[(z–Lz/2)/Lt) to the steepened cen-tral part of the profile as shown in Fig. 3b; we find that scale size Lt∼24λdo gives a nice fit in contrast to L=36λdo
in the imposed field profile in Eq. (1). The steepened pro-file in the center yields a maximum current density Jymax = µ−o1∇×B|max=2Jthas seen in Fig. 1a, in contrast to the
max-imum current J=1.39 Jthwith L=36λdoin Eq. (1).
The steepened profile Bx(z) in Fig. 3b is the sum of the
imposed field Bxo(z) in Eq. (1) and magnetic field
perturba-tions bx, that is, Bx(z)=Bxo(z)+bx(z). Temporal evolution of
bx(z) is shown in Fig. 3c. Note that until t∼700ω−po1the signs
of the perturbations are such that, the total field decreases in the outer regions but very close to the center, on either side of it, the field is enhanced. It appears that magnetic flux is transported from outer regions to the region near the center. At t=800ω−1
po the inner perturbations in bx(z) near the
cen-ter vanish and the current sheet is then re-widening. At lacen-ter times shown in Fig. 3c, the perturbation bxhas become
bipo-lar and it cancels the imposed field yielding Bx(z)∼0 and
Jy(z)∼0 over an extended part of the central CS, as
appar-ent from the bifurcation of the currappar-ent seen at t=900ωpo−1 in Figs. 1a and 2.
Why does the thinning occur? We find that the Jy×B
force on the magnetized electrons drives the thinning. This force facilitates the transport of plasma toward the CS cen-ter, as mentioned earlier in connection with the evolution of the plasma density in Fig. 1b. The possibility of this plasma transport is easily seen from the momentum equations for the electrons and ions. If we ignore the electron inertia in the electron momentum equation it gives the z-component of the electric field
Fig. 5. Ions’ inflow: (a) Evolution of the average flow velocity U(z)
is shown from t=200ω−po1to t=900ωpo−1as labeled. Ion phase space
in z-Vzplane at (b) t=400ω−po1and (c) t=900ω−po1.
In the initial stages the pressure term in Eq. (3) is insignif-icant and the Jy×B force determines Ez. For the magnetic
field in Eq. (1) Ezrepresents converging electric fields
point-ing toward the CS center. Figure 4 shows Ez(z) at t=400 ω−po1
along with Bx(z). Ezaccelerates the un-magnetized ions
to-ward the CS center; this acceleration is given by
M(∂Uz/∂t + Uz∂Uz/∂z) ≈ eEz−(1/ni)∂(niTiz)/∂z . (4)
In Eqs. (3) and (4) Tizand Tezare the ion and electron
tem-peratures associated with their motions in the z direction, respectively. The evolution of the average ion flow veloc-ity Uz is shown in Fig. 5a; Uz reaches a maximum value
Umax∼0.04 Vteo=1.7 Vtio, where Vtio is the initial ion
ther-mal velocity. The transport of the plasma towards the center increases the plasma density as shown in Fig. 1b. Another consequence of the ion acceleration by Ez is that the ions
stream in the central region of the CS. The counter-streaming begins during the early stage of the thinning and continues even after the reconnection sets-in the CS. Fig-ures 5b and c show ion phase space in the z-Vzplane; at an
early time t=400ωpo−1the flows of the accelerated ions origi-nating from top and bottom parts of the CS have just begun to overlap while at a late time t=900ω−po1the flows are over-lapping over an extended central region.
Fig. 6. Evolution of pressure distribution: from left to right the
pan-els show magnetic Pm(z) (dotted line), kinetic Pk(z) (dashed line)
and total pressure Pt(z) (solid line) at t= 200ωpo−1, t=500ω−po1and
t=700ω−po1, respectively. Pk(z) is the sum of electron and ion
pres-sures.
Since the ions accelerated into the central region by Ez
merge with the preexisting ions there, the average velocity Uz
in Fig. 5a is much lower than that expected from the falling of the ions in the potential well associated with Ez. Integrating
Ez in Eq. (3) by ignoring the pressure term, the maximum
potential drop associated with Ezis
ϕax ∼(1/eno)(Bo2/2µo) =12.5 To/e (5)
From the simulation we find that ϕmax∼17To/e, which is
larger than the above theoretical value. The difference is attributed to space charges developing in the simulation, which yield Ez larger than that expected from Eq. (3),
es-pecially near the boundaries. Maximum velocity of ions falling into a potential well of magnitude ϕmax∼17To/e is
Vimax=0.136Vteo, which is also seen from Fig. 5b. Wygant et
al. (2005) reported acceleration of ions scaling with the po-tential drop in Eq. (5) from Cluster observations. However, it is important to note that Wygant et al. noted the entire ion populations accelerated to the energy level in Eq. (5); this could be possible when the neutral region of the CS is deeply depleted of plasma before the CS formed. We find that Vimax
is approximately the same as the magnetosonic wave propa-gation velocity VF=(C2s+V2A)1/2and the thinning time τthinis
about the transit time of ions across the half of the total width of the CS, namely,
τthin∼5λe/VF ∼50λdo/0.13Vteo∼400ω −1
po . (6)
3.2 Pressure balance and stoppage of the thinning
One of the consequences of the formation of the thin current sheet is the energization of both electrons and ions. We just discussed that the ions are energized in the z direction by the bipolar electric field Ez(Fig. 4). Furthermore,
current-driven instabilities (CDIs) also heat both the electrons and ions, but with the electron heating being dominant as it oc-curs starting at an early phase of the CS evolution. We will
kinetic pressure Pk=Pki+Pkewith Pki= niTizand Pke= neTez,
and the total pressure Pt=Pm+Pk, respectively. Note that Tiz
and Tezare the ion and electron temperatures associated with
their motion in the z direction. The curves in blue near the bottoms of the panels in Fig. 6 show the dynamic pressure associated with the average flow velocity Ui(z) as shown in
Fig. 5a. The dynamic pressure remains small due to the av-eraging including the background ions as explained earlier. Pm(z) has a maximum value of Pm=12.5 noToat the
bound-aries z=0 and 256λdo as determined by Boin Eq. (1) , and
it is zero at the center z=128λdo. We notice that Pm(z)
pro-gressively decreases in the outer regions near the boundaries while it steepens on either side of the central region devel-oping a shock-like ledge, in conformity of the evolution of Bx(z) in Fig. 3a. Pk is seen to increase dramatically in the central region peaking near z∼128λdo. Note that in
calculat-ing Pk, effective temperatures of electrons and ions are used
and they are given by the second moment of their velocity distribution functions. We find that by the time t=500ω−po1the peak kinetic pressure near the center becomes nearly equal to the total pressure Pt=Pm+Pknear the edges of the simulation
box. However, by this time the plasma instabilities in the central CS begin to produce fine structures in the Pkprofile.
The second moment of the electron and ion veloc-ity distributions inside the current sheet yield the follow-ing effective temperatures at t=500ω−po1: Tez/To=2.5To and
Tiz=4.8To. With such temperatures and the enhanced
density n(z=128)∼=2 (Fig. 1b), the kinetic pressure at the CS center is Pk=(5+9.6) noTo=14.6. The magnetic
pres-sure Pm(z=0)=Pm(z=256)=B2o/2µo∼12.5 noTo and the
ki-netic pressure Pkat z=0 and 256 is ∼2.5 noTo, giving total
pressure at the boundaries Pt=15, which is nearly the same
as Pkat the center. When this pressure balance occurs the CS
thinning stops.
We point out that the enhanced ion pressure, Pki=9.6 noTo,
contributes significantly more than the electron pressure, Pke=5 noTo, to the pressure balance near the center at the
time of the stoppage of the thinning. As mentioned earlier, the ion pressure enhancement is due to the ion acceleration by the normal electric field Ez (Fig. 4) and the merging of
the ion streams as shown in Fig. 5. However, as the CDI
Fig. 7. Evolution of the fluctuations in (a) Ex(z), (b) Ey(z) and (c)
Ez(z) from t=300ω−po1to t=ω−po1as labeled. Note that the
fluctua-tions are confined in the central region of the current sheet.
continues to heat the electrons, the pressure Pkecontinues to
increase and then the central peak in the CS broadens before it bifurcates due to current disruption.
3.3 Electrostatic plasma turbulence
We now examine the temporal and spatial behavior of the plasma instability, which drastically affects the CS and also leads to fast reconnection. Figures 7a–c show the temporal evolution of electric fields Ex(z), Ey(z) and Ez(z) over the
time interval from t=300ω−po1to t∼700ω−po1. We find that the instability in the current sheet starts out as purely electro-static (ES) and remains so until t∼850ω−po1 when magnetic reconnection and electron tearing instability begin to occur. Comparing the phases of the growing fluctuations in the elec-tric field components at the successive times shown in Fig. 7, we find that the ES instability is nearly purely growing; spa-tially static (non-propagating) structures in the fields and the plasma density grow in time.
The spatial structure of the instability is shown in Figs. 8a– c, in which Ex, Ey, and Ezare plotted in the x-z (y=16) (top)
and x-y (z=128) (bottom) planes, respectively. As already noted from Fig. 7, the growing ES oscillations are confined in the central region of the CS over 112<z/λdo<144 as seen
from the top panels in Fig. 8. The wavelength along z is
λz∼8λdo, giving a wave number kz=2π /λz=0.7. The wave structure in the x-y plane is more complicated; it spears to be superposition of different modes.
The evolution of the electrostatic instability in the wave number plane kx–kyis shown in Fig. 9, in which 2-D Fourier
transform |Ey(kx, ky)|is plotted in the m-n plane. Note that kx=m×2π /Lxand ky=n×2π /Ly,where m and n are the mode
numbers. The noteworthy features of Fig. 9 are the follow-ing. The panel for t=200ω−po1 reveals that power in Ey is
Fig. 8. Spatial structure of the fluctuations in Ex(left column), Ey(middle column) and Ez(right column) are shown in the x-z plan (top
row) and in the x-y plane (bottom row). Fluctuations are confined within the narrow current sheet as seen in the top row. In the x-y plane they are superposition of a few wave modes.
Fig. 9. Temporal evolution of the wave number spectrum of the fluctuations in Eyin the m-n plane, where m and n give the mode numbers
according to kx=m(2π /Lx)and ky=n(2π /Ly). At times earlier than t=800ω−po1, the spectrum consists of narrow peaks near discrete values of
do
already noted that the wavelength λz∼8λdoand kzλdo∼0.7.
Such wave numbers for the dominant modes are compara-ble with the wave numbers expected for the Buneman and ion acoustic instabilities given by ky∼ωpo/Vdewhen electron
drift velocity Vde∼Vteo (Fried and Gould, 1961). We note
from Figs. 1a and b that in the central CS Vde ∼Jy/ne∼Vteo
over 200<tωpo<600 as Jymax∼2Jthand nemax∼2no.
Figure 9 shows a sudden characteristic change in wave structure at t∼800ωpo−1; the wave number spectrum consid-erably broadens in both kx and ky, the fluctuations in Ex,
Eyand Ez become spiky. The corresponding spatial
distri-butions of electrons and ions in the x-y plane near the CS center (z∼128λdo)become highly bunched as shown in the top and bottom panels of Fig. 10, respectively. We inter-pret the bunching by trapping of the charged particles in potential well of the large-amplitude electrostatic instabil-ity. In a previously reported simulation with mass ration M/m=16 (Singh, 2004), we found the trapping, but it was not certain that in a plasma with real heavy mass this type of trapping could occur affecting both electrons and ions. Fig-ure 10 shows that the trapping does occur with M/m=1836, but is delayed. However, the delay does not scale either with the ion-acoustic time scale as (M/m)1/2 or the Bune-man instability time scale as (M/m)1/3. The deep trapping with M/m=16 occurs at t∼600 ωpo−1 while for M/m=1836 it does at t∼900ω−po1. This suggests that CDI in CS is affected by the non-uniformity in the sheet parameters across the z direction. We have suggested that shear in the drift velocity, Vde(z), of the current-carrying electrons might enhance the
growth of the CDI, especially when additional shear begins to develop near the CS center when CDI begins to reduce the current density and the drift velocity profile Vde(z) becomes
concave in the central CS (Singh, 2004). Figure 11 shows the evolution of Vde(z) from the run with M/m=1836. Until
t∼600ω−po1Vde(z) has a maximum value of Vdemax∼Vteonear
z∼128λdo. We note that this velocity is below the threshold
for the Buneman instability because of the enhanced electron temperature Tey. After t∼700 a minimum begins to develop
near the center and soon the depth at the minimum reaches Vde∼0 by the time t∼900ωpo−1. How this new shear affects
Fig. 10. Spatial distribution of electrons in the x-y plane near z=128,
showing bunching of the electrons; the bunches are the consequence of the trapping of the current-carrying electrons in the growing ES oscillations.
the CDI is not well understood. However, our simulations show that the escalation in the growth of the ES instability is accompanied by the onset of this newly sheared drift of the current carrying electrons. In addition to the developing shear in the CS center, heated electrons in the CS begin to have temperature Teywell above the ion temperature Tiy(see
Fig. 15). The resulting escalating growth of the ES instabil-ities and current disruption leads to magnetic reconnection. The exact mechanism causing the CDI and its evolution, in-cluding the evolution of the shear in the drift velocity of the current carriers, remains to be determined.
3.4 Magnetic reconnection
Figures 12a–d show the vector plots of the magnetic field in the x-z plane. Prior to t=700ω−po1, B vectors are aligned with
Fig. 11. Temporal evolution of the average drift of the electrons
Vdey(z), showing that it develops a minimum in the central CS after
t∼700ω−po1. Before this time Vdey(z) has a maximum at the center.
the x-axis all over the x-z plane. However, we do notice that at t=700ωpo−1, bzis beginning to develop along the central line z=128λdo, but it is quite weak. At t=800ω−po1we see the
for-mation of x line, which is stretched over 8<x/λdo<24. At t=850ω−po1 the reconnected field lines are spread (Fig. 12c) over a wider range of z and there are formation of O-shaped structures in the reconnected region. At an even later time t=900ω−1
po, the central region of reconnection continually
spreads and it becomes a carpet of electromagnetic turbu-lence as shown in Fig. 12d. Since our simulation region is limited, we stop the simulation at t=1000ωpo−1. However, we find that the magnetic reconnection begins along the neutral line and spreads outward. We examine the spatial structure of the bzcomponent of the magnetic perturbation, which af-fects the reconnection. Figure 13a shows the evolution of bz(x, y=16, z=128); curves corresponds to the four times of the vector plots in Fig. 12. Note that the amplitude of the spatial oscillations in bz grows until t∼900ω−po1. The
2D-Fourier spectrum of bz(x,y, z=128), namely, bz(kx, ky), is plotted in Figs. 13b and c at t=850 and 900ωpo−1. Note that m (kx=m×2π /Lx)and n (ky=n×2π /Ly)are the mode numbers
along the x and y directions, respectively. The spectra show that dominant mode has m=1 and n=0. The mode number n=0 implies that bzdoes not vary significantly with y, the di-rection of the current flow. This suggests that in the midst of the three dimensional nature of the electrostatic CDI, the de-veloping reconnection shows 2-D behavior in the x-z plane. However, the broadness of the peak at n=0 in the spectrum indicates that bzmight vary with y to some extent. The mode m=1 implies that the electromagnetic (EM) mode facilitat-ing the MR has one wavelength fittfacilitat-ing in the box in the x direction parallel to the anti-parallel magnetic field, and it is
Fig. 12. Vector plots of B(x, z) in the x-z plane at (a) t=700ω−po1, (b)
800ω−po1, (c) 850ωpo−1and t=900ω−po1, showing the onset of magnetic
reconnection at t∼800ωpo−1. At times earlier than t=700ωpo−1the B
vectors are like the initial anti-parallel fields. At the later times when reconnection sets in, the magnetic field configuration in the central part of the current sheet undergoes a rapid change.
about 3λe long. The nature of the EM instability affecting
the reconnection is examined in Sect. 3.5 on electron tearing instability (ETI).
Figure 12d shows that after the onset of the magnetic re-connection, the central part of the CS is highly turbulent. We examine the effect of the turbulent magnetic fields on the CS structure and compare it with the structure at early times be-fore the MR. Figure 14 shows a plot of Bx(z) at t=900ω−po1
along a cut at x=16λdoin Fig. 12d. The corresponding plots
of Bx(z) at early times can be seen in Figs. 3a and b. The
tur-bulent magnetic field (Fig. 12d) has transformed the smooth variation of Bx(z) at early times into a series of steps as seen
from Fig. 14. The steps appear as extremely narrow current sheets stacked together. The total width of an individual su-perfine current sheet is λe. Such steps in the profile of the
magnetic field in a reconnecting CS are clearly seen from Cluster data reported by Wygant et al. (2005).
Fig. 13. (a) Temporal evolution of bz(x) at z=128 and y=16; the curves are for t=700, 800, 850 and 900ω−po1from bottom to top; note the
growing amplitude of the spatial oscillation in bx(z) with increasing time. The wave number spectrum |bz(kx, ky)|: (b) t=850ω−po1and (c)
t=900ω−po1.
3.5 Electron tearing mode
The onset of reconnection seen in Fig. 12, and the growth of the wave-like magnetic field perturbation bz(x) in Fig. 13a suggest that in our simulation electron tearing mode (ETM) begins to grow suddenly at t∼850ω−1
po. The growth time of
ETM is given by (Coppi et al., 1966)
τ ∼ π−1/2(2L/ρe)3/2(L/Vte) . (7)
We find that at t∼850ωpo−1the CS scale size L=24λdo. The
electron Larmor radius ρe greatly varies across the CS, but we estimate that in a narrow region where reconnection be-gins (|Bx|<0.1) ρe∼15λdo. Thus we find that the growth
time τ ∼75ωpo−1. This is approximately the time scale of the growth seen in Fig. 13a. As suggested by Coppi et al. (1966), the instability is purely growing and it occurs explosively in the simulation. The wavelength of the ETM is ∼L, and our limited simulation size in x contains only one wavelength of the dominant ETM as seen from Figs. 13a–c. It is known that ETM growth rate is enhanced by the electron tempera-ture anisotropy (Chen and Palmadesso, 1984). As we show in the next section perpendicular temperature of the electrons steadily increases over the parallel temperature until the on-set of the reconnection. This might be a factor in making the growth explosive near t∼850 ω−po1.
3.6 Electron and ion acceleration/heating
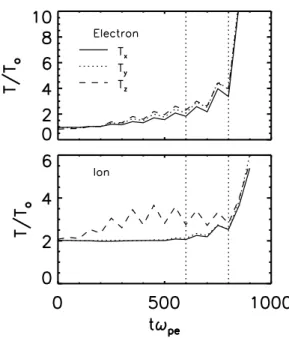
The panels in Fig. 15 show the evolution of Tx, Tyand Tz,
the temperatures of electrons (top) and ions (bottom) associ-ated with their x, y and z motions. The noteworthy features of Fig. 15 are the following. The ions develop a pitch angle anisotropy in their temperature with Tizbeing more than
dou-ble of Tixand Tiy, which remain nearly at the initial value of
2To until CDI generates large-amplitude waves and begins
to affect the ions for t>600ωpo−1. This thermal anisotropy
Fig. 14. Bx(z) along a cut at x=16λdoin Fig. 13d (t=900ωpo−1)is
plotted to show that the EM turbulence generates step-like struc-tures in the current sheet. The arrows show some of the steps form-ing superfine current sheets of total thickness ∼λe.
at the early times is the consequence of ions being acceler-ated in the electric field Ez (Fig. 4) during the time frame
of the thinning of the current sheet for t<500ω−po1 (Figs. 1 and 2). Electron temperatures show a different type of ther-mal anisotropy with parallel temperature Tex<Tey∼Tez, the
perpendicular temperatures. Here parallel and perpendicular directions refer to the direction of magnetic field Bx. We
see that Tex, Tey and Tez steadily but slowly increase with
time beginning at t∼200ω−1
po; which is nearly the time when
CDI begins in the simulation. The CDI preferentially heats the electrons increasing Tey, but the cyclotron motion keeps
Tey∼Tez. In contrast, since ions remain un-magnetized over
the time scale of the simulation Tiz remains quite different
from Tiy until t∼800ωpo−1 when the electrostatic instability
becomes explosive and reconnection sets in. After the on-set of reconnection (t∼800ω−po1), the ions in the current sheet
Fig. 15. Evolution of the electron (top) and ion (bottom)
tempera-tures: The x, y and z components of the temperatures are shown in the units of the normalizing temperature To.
again become almost thermally isotropic with Tix∼Tiy∼Tiz,
but with enhanced temperatures. The electron temperatures are also seen to reach isotropy with even larger temperatures after the onset of reconnection.
We find that the electron velocity distribution function fe(vx,vy,,vz)in the current sheet develops a complex
struc-ture after the onset of the reconnection. Figure 16 shows the evolution of the electron phase space in the α-V plane, where pitch angle α is measured from the direction of Bx
and V=(v2x+v2y+v2z)1/2. In Fig. 16 we have plotted fe(α,V) on a relative scale with red and blue showing large and small fe, respectively. The contours of constant fe show that the electrons are continually heated near α=90◦. This proceeds until t∼900ω−po1, after which an energetic population begins to appear at very large velocities with a broad pitch-angle distribution. Thus the fein the current sheet becomes dumb-bell shaped and the top of the dumbdumb-bell is quickly populated with large number of electrons with relativistic speeds. Oe-rioset et al. (2002) have reported observations from Wind on electron acceleration in geo-tail that the most energetic elec-trons in the dissipation region have energies up to as high as 300 keV and their pitch-angle distribution becomes increas-ingly isotropic with increasing energy. The top part of the dumbbell in Fig. 16 represents this feature of the observation from Wind.
Our primary conclusion from the discussion in this section is the following. Both electrons and ions are energized in the current sheet. A major acceleration of ions occurs during the thinning phase of the CS by the electric fields normal to the CS plane. Electrons are continually heated by CDI. However,
laboratory experiments.
(i) In response to an externally imposed anti-parallel
mag-netic field on a initially uniform and current-free plasma, a current sheet formation is triggered by the electric field Ey
given by Ampere’s law. The electric field accelerates the electrons, which begin to carry the current.
(ii) The current carrying-electrons feel J×B force, which
transport electrons toward the center of the current sheet. This creates space charge and electric field Ez, which
con-verges toward the center and accelerates un-magnetized ions. Ez accelerates the un-magnetized ions toward the CS
cen-ter generating councen-ter-streaming ion flow. This enhances the plasma density in the central part and reduces in the outer regions. Wygant et al. (2005) have reported that normal elec-tric fields and ions accelerated by this field are significant features of ETCSs having scale size ∼λe as detected in the
magnetotail by Cluster.
(iii) Under the influence of the converging ion flows, the
current sheet thins and the thinning continues until the ki-netic pressure at its center becomes as large as the sum of the magnetic and kinetic pressure near the boundaries. Ini-tially the kinetic pressure is constant across the CS and it is Pk=neTez+niTiz=3 noToand the magnetic pressure near the
boundaries is Pm(z=0) = Pm(z=256) = 12.5Toand at the
cen-ter Pm(z=0)=0. As the CS evolves, three factors contribute to
the increase of Pkin the central CS. They are the increase in
the plasma density, increase in ion temperature Tizdue to the
merging of the accelerated ion streams into the central part, and the increase in Tezdue to CDIs.
(iv) During the course of the thinning of the CS,
mag-netic field distribution Bx(z) steepens in the central part of
the CS. The resulting Bx(z) develops three regions of
dis-tinct slopes forming three-peaked current distribution. In all three peaks current carriers are electrons. We note that these features occur at time scales (<1000ωpo−1)much shorter than the ion cyclotron period τci>23 060ω−po1. The time scale
of the steepening of Bx(z) and thinning of Jy(z) seems to
occur at the speed of the fast magneto-sonic shock given by Vf=(C2s+V2A)1/2= 0.134 Vteo. Syrovatskii et al. (1973)
measured the steepening of the magnetic field distribution forming a current sheet at a time scale shorter than the ion cyclotron period in a laboratory experiment and they explained it in terms of the propagation of magneto-sonic
Fig. 16. Evolution of the electron velocity distribution function fe(α, V). The times are labeled on the top of the panels. Note the formation
of dumbbell shaped distribution after t=900ω−po1when magnetic reconnection is set-in inside the current sheet. The top part of the dumbbell
is an energetic isotropic electron population reaching relativistic speeds.
waves. Wygant et al. (2005) explained the ETCS detected by Cluster in terms of standing magneto-sonic shock waves.
(v) We find that as the current sheet begins to re-broaden
due to increased kinetic pressure at the CS center and the electron temperature Tey begins to exceed ion temperature
Tiy at t∼700ω−po1, the growth in the ES oscillations driven
by the CDI escalates. This disrupts the current in the cen-tral part of the CS by trapping the current-carrying electrons in large-amplitude oscillations. The localized current disrup-tion causes the bifurcadisrup-tion of the CS. Very thin bifurcated current sheets having scale size of a few λe were detected by Cluster (Wygant et al., 2005). We point out that the bifur-cated CS seen in the 2-D simulation of Doughton et al. (2004) have structural features quite different from the Cluster data. In this 2-D simulation bifurcation is the result of current en-hancement near the CS edges over the background current of the initially assumed equilibrium. On the other hand, in the Cluster data the current is nearly zero at the CS center like
in our 3-D simulation (Fig. 1a); the nearly complete current disruption is caused by an explosive instability in the recon-nection region.
(vi) The reconnection appears to be affected by ETI in the
explosive phase of the ES instability. We find that region of the reconnected field lines spreads and becomes a carpet of electromagnetic turbulence. An interesting feature of the tur-bulence is that it consists of stacks of very thin current sheets of scale size λe. It is interesting to point out that such stacks
appear as steps in the magnetic field profiles of bifurcated currents in the Cluster data (Wygant et al., 2005).
(vii) Ion heating and acceleration occur at different stages
of the evolution of the current sheet. It seems that ion ac-celeration by the normal electric field Ez in the converging
EMHD flows toward the CS center is a significant feature of a ETCS. This produces pitch-angle anisotropy in the ions’ ther-mal structure. Besides the acceleration in the EMHD flows, ions are nearly isotropically heated in the electromagnetic
energetic population in conjunction with a low energy pop-ulation gives the appearance of a dumbbell type of veloc-ity distribution function in the pitch-angle-velocveloc-ity phase space. Oieroset et al. (2002) have reported that electrons in the diffusion region detected by Wind became increasingly isotropic with increasing energy up to ∼300 keV.
In this study we have assumed that extremely thin current sheets do form in plasmas. There are observational evidence of such current sheets both from Cluster (Wygant et al., 2005; Nakamura et al., 2004). New observations of electron diffu-sion region reported by Mozer et al. (2005) clearly point to the existence of extremely thin current sheets. If such cur-rents have thickness of a few times the electron skin depth, the results presented in this paper are relevant to them. For the micro-instabilities discussed here, the size of our simula-tion is sufficient. In simulasimula-tions with longer dimensions, it is quite possible that instabilities with longer wavelengths and slower time scales might appear. Finally we point out that forthcoming NASA’s Magnetospheric Multi-scale Mission, which focuses on magnetic reconnection, will provide op-portunities to critically examine many of the issues discussed in this paper ranging from formation of extremely thin cur-rent sheets to plasma turbulence and magnetic reconnection in them.
Acknowledgements. This work was performed under a support
from NASA grant NAG513489.
Edited by: J. B¨uchner Reviewed by: G. S. Lakhina
References
Baumjohan, W. and Nakamura, R.: What is Cluster telling us about magnetotail dynamics, Proceedings of the 34th COSPAR scien-tific assembly, Houston, TX, USA, 10-19 Oct 2003, Proc. D3.1-0027-02, 1–9, 2002.
Birdsall, C. K. and Langdon, A B.: Plasma Physics via Computer Simulations, NY, McGraw- Hill, 1985.
B¨uchner, J. and Zelenyi, L. M.: Chaotization of electron motion as the cause of an internal magnetotail instability and substorm onset, J. Geophys. Res., 92, 13 456–13 466, 1987.
Buneman, O.: Dissipation of current in ionized media, Phys. Rev., 115, 503–517, 1959.
and Zeiler, A.: Formation of Electron Holes and Particle Ener-gization During Magnetic Reconnection, Science, 299, 873–877, 2003.
Fried, B. D. and Gould, R. W.: Longitudinal ion oscillations in hot plasmas, Phys. Fluids, 4, 139–147, 1961.
Harris, E. G.: On a plasma sheath separating regions of oppositely directed magnetic fields, Nuovo Chimento, 23, 115–121, 1962. Hesse, M. and Winske, D.: Electron dissipation in collisionless
magnetic reconnection, J. Geophys. Res. 103, 26 479–26 486, 1998.
Hesse, M., Schindler, K., Birn, J., and Kuznetsova, M.: The dif-fusion region in collisionless magnetic reconnection, Phys. Plas-mas, 6, 1781–1795, 1999.
Hesse, M., Kuznetsova, M., and Hoshino, M.: The struc-ture of the dissipation region for component reconnection: Particle simulations, Geophys. Res. Lett., 29(12), 1563, doi:10.1029/2001GL014714, 2002.
Horiuchi, R. and Sato, T.: Three-dimensional particle simulation of plasma instabilities and collisionless reconnection in a current sheet, Phys. Plasmas, 6, 4565–4574, 1999.
Hoshino, M., Nishida, A., Mukai, T., Saito, Y., and Yamamoto, T.: Structure of plasma sheet in magnetotail: double-peaked electric current sheet, J. Geophys. Res., 101, 24 775–24 786, 1996. Lakhina, G. S.: On the ion tearing instability of forced current
sheets, J. Gephys. Res., 98, 17 409–17 414, 1993.
Mozer, F. S., Bale, S. D., McFadden, J. P., and Torbert, R. B.: New features of electron diffusion regions observed at subpolar mag-netic field reconnection sites, Geophys. Res. Lett., 32, L24102, doi:10.1029/2005GL024092, 2005.
Nakamura, R., Runov, A., Baumjohan, W., Truemann, R. A., et al.: Thin current sheets measured by Cluster at 200 km tetra-hedron scale, http:www.glue.umd.edu/∼sitnov/TCS/tcs 1 files/
online.htm, 2004.
Oieroset, M., Lin, R. P., Ohan, T. D., Larson, D. E., and Bale, S. D.: Evidence of Electron Acceleration up to ∼300 keV in the magnetic reconnection diffusion region of Earth’s magnetotail, Phys. Rev. Lett., 89, doi:10.1103/physRevLett.89.195001, 1–4, 2002.
Ozaki, M., Sato, T., Horiuchi, R., et al.: Electromagnetic instabil-ity and anomalous resistivinstabil-ity in a magnetic neutral sheet, Phys. Plasmas, 3, 2265–2274, 1996.
Pellat, R., Coroniti, F. V., and Pritchett, P. L.: Does ion tearing exit?, Geophys. Res. Lett., 18, 143–146, 1991.
Pritchett, P. L. and Coroniti, F. V.: Three-dimensional collision-less magnetic reconnection in the presence of a guide field, J. Geophys. Res., 109, A01220, 1–22, doi:10.1029/2003JA009999, 2004.
Runov, A., Nakamura, R., Baumjohann, W., et al.: Current sheet structure near magnetic X-line observed by Cluster, Geophys. Res. Lett., 30(11), 1579, doi:10.1029/2002GL016730, 2003b. Scholer, M., Sidorenko, I., Jaroschek, C. H., et al.: Onset of
col-lisionless magnetic reconnection in thin current sheets: Three-dimensional particle simulations, Phys. Plasmas, 10, 3521–3527, 2003.
Sergeev, V., Runov, A., Baumjohann, W., et al.: Current sheet flap-ping motion and structure observed by Cluster, Geophys. Res. Lett., 30, 1327, doi:10.1029/2002GL016500, 2003.
Silin, I. and B¨uchner, J.: Kinetic Instabilities of thin current sheets of thin current sheets: Results of two-and- one-half-dimensional Vlasov code simulations, Phys. Plasmas, 10, 1299–1307, 2003a. Silin, I. and B¨uchner, J.: Nonlinear instability of thin current sheets in antiparallel and guided magnetic fields, Phys. Plasmas, 10, 3561–3570, 2003b.
Sitnov, M. I., Guzdar, P. N., and Swisdak, M.: A model of bifurcated current sheet, Geophys. Res. Lett., 30, 13, doi:10.1029/2003GL017218, 2003.
bution near the null line of magnetic field and turbulent plasma resistance, Sov. Phys. Tech. Phys., Engl. Transl., 18, 580–586, 1973.
Ugai, M.: Global dynamics and rapid collapse of an isolated current-sheet system enclosed by free boundaries, Phys. Fluids, 29(11), 3659–3667, 1986.
Wygant, T. J., Cattell, C. A., Lysak, R., et al.: Cluster Observations of an intense normal component of the electric field at a thin reconnecting current sheet in the tail and its role in the shock-like acceleration of the ion fluid into the separatix region, J. Geophys. Res., 110, A09206, 1–30, doi:10.1029/2004JA010708, 2005. Zeiler, A., Bishkamp, D., Drake, J. F., Rogers, B. N., and Shay,
M. A.: Three dimensional particle simulations of collisionless magnetic reconnection, J. Geophys. Res., 107, 1230–1239, 2002. Zelenyi, L. M., Malova, H. V., Popov, Yu. V., et al.: Nonlinear equilibrium structure of thin current sheets: influence of electron pressure anisotropy, Nonlin. Processes Geophys., 11, 579–587, 2004.