HAL Id: hal-02975098
https://hal.archives-ouvertes.fr/hal-02975098
Submitted on 22 Oct 2020
HAL is a multi-disciplinary open access
archive for the deposit and dissemination of
sci-entific research documents, whether they are
pub-lished or not. The documents may come from
teaching and research institutions in France or
abroad, or from public or private research centers.
L’archive ouverte pluridisciplinaire HAL, est
destinée au dépôt et à la diffusion de documents
scientifiques de niveau recherche, publiés ou non,
émanant des établissements d’enseignement et de
recherche français ou étrangers, des laboratoires
publics ou privés.
Lagrangian-based Simulations of Hypervelocity Impact
Experiments on Mars Regolith Proxy
M. Froment, E. Rougier, C. Larmat, Z. Lei, B. Euser, S. Kedar, J.
Richardson, T. Kawamura, P. Lognonné
To cite this version:
M. Froment, E. Rougier, C. Larmat, Z. Lei, B. Euser, et al.. Lagrangian-based Simulations of
Hy-pervelocity Impact Experiments on Mars Regolith Proxy. Geophysical Research Letters, American
Geophysical Union, 2020, 47 (13), pp.e2020GL087393. �10.1029/2020GL087393�. �hal-02975098�
1 2 3 4 5 6 7 8
Lagrangian-based simulations of hypervelocity impact
experiments on Mars regolith proxy
M. Froment1,2, E. Rougier2, C. Larmat2, Z. Lei2, B. Euser2, S. Kedar4, J. E.
Richardson3, T. Kawamura5, and P. Lognonne´5
1´Ecole Normale Sup´erieure Paris-Saclay, Cachan, France
2Earth and Environmental Division, Los Alamos National Laboratory, New Mexico, USA 3Planetary Science Institute, Tucson, Arizona, USA
4Jet Propulsion Laboratory, California Institute of Technology, Pasadena, California, USA5Universite´
de Paris, Institut de physique du globe de Paris, CNRS, F-75005 Paris, France
9
Key Points:
10
• We conduct a parametric study of a novel Lagrangian numerical model of shock 11
waves in granular media, with application to Mars regolith.
12
• We validate this model with a laboratory experiment in pumice sand with an im-13
pact velocity of 0.98 km/s.
14
• Amplitude of shock waves and transition to di↵erent regimes is explained by the 15
model for the sensors placed vertically from the impact.
16
17 18 19 20 21 22 23 24 25 26 27 28 29 30 31 32 33 34 35 36 37 38 39 40 41 42 43 44 45 46 47 Abstract
Most of the surface of Mars is covered with unconsolidated rocky material, known as re-golith. High-fidelity models of the dynamics of impacts in such material are needed to help with the interpretation of seismic signals that are now recorded by SEIS, the seis-mometer of InSight.
We developed a numerical model for impacts on regolith, using the novel Hybrid Optimization Software Suite (HOSS) which is a Lagrangian code mixing finite and dis-crete element formulations. We use data from hypervelocity impact experiments performed on pumice sand at the NASA Ames Vertical Gun Range to identify and calibrate key model parameters. The model provides insight into the plastic-elastic transition observed in the data and it also demonstrates that gravity plays a key role in the material response. Waveforms for receivers situated vertically below the impact point are correctly mod-eled, while more research is needed to explain the shallow receivers’ signals.
Plain Language Summary
The generation of seismic waves by meteorite impacts in unconsolidated materi-als, such as Mars regolith, is a complex dynamic process. We present a numerical model based on a novel method and show its potential to explain the main characteristics of shock and seismic waves generated by impacts at laboratory scales. Our goal is to use this model to help with the analysis of data recorded during the InSight mission.
1 Introduction
InSight landed on Mars on November 26, 2018. Since then, the lander’s robotic arm has placed a seismometer, the SEIS experiment, for the first time on the direct surface
of the planet (Lognonne´ et al., 2019). SEIS is a single seismic station completed by pres-sure and wind sensors (Banfield et al., 2019). The absence of other stations to form a network can make the assessment of source distance and azimuth sometimes
challeng-ing based on the first SEIS observations (Lognonne´ et al., 2020; Giardini et al., 2020). Bechalleng-ing able to identify signals produced by impacts would thus prove relevant to the mis-sion, as fresh craters can potentially be located by satellite imagery and provide a strong constraint on the source position (Daubar et al., 2018). Current estimations and mea-sures of impact rates on Mars show a higher frequency of craters smaller than 10m di-ameter, with 10 times more craters in the range of [3.9, 5.5] m diameter created every
48 49 50 51 52 53 54 55 56 57 58 59 60 61 62 63 64 65 66 67 68 69 70 71 72 73 74 75 76 77 78 79 80
year compared to craters of [11, 15.6] m diameter (Teanby, 2015; Daubar et al., 2013; Ma-lin et al., 2006). The expected rate of detection is estimated to about 8 impacts per year for the SEIS VBB (Banerdt et al., 2020), close to the pre-launch proposed rate (Lognonne´ & Johnson, 2007; Daubar et al., 2018). The generation of seismic signals by such small events is dominated by the response of Mars regolith, a layer of unconsolidated rocky material covering the bedrock, which is supposedly desiccated at the InSight landing site close to Mars equator (Morgan et al., 2018). First analyses have confirmed low seismic velocities, which might even be as low as 120 m/s for P waves at 0.5 m depth (Lognonne´ et al., 2020). Physic-based shock propagation codes allow high-fidelity modeling of the shock waves generated by meteorite impacts, which transition to seismic waves at fur-ther distances and thus control the shape and amplitude of the seismic signal that could be recorded by SEIS. Such modeling requires the codes to be able to track discontinu-ous features in time and space, like material fractures and phase transitions caused by the shock. Moreover, small impacts are expected to happen mostly in a solid regime of high viscosity, making the capture of non-isotropic processes an important requirement for simulation softwares.
Another challenge of modeling impacts in Mars regolith is its granular nature: fric-tion and grain displacement processes in the material are important and grain interac-tion can lead to non-linear behaviors that manifest as “force-chains” (Sun et al., 2009; Gao et al., 2019) and “fairy-castle” structures (Hapke & van Hoen, 1963; Carrier et al., 1991) depending on the confining stress on the grains. Moreover, the material is porous, which leads to an enhanced attenuation of shocks compared to bulk materials (Collins et al., 2019). Only now numerical methods to model impacts are starting to implement realistic, geologic materials as their target (G¨uldemeister & W¨unnemann, 2017; Pierazzo et al., 2008; W¨unnemann et al., 2006). Here, we use the novel Lagrangian mechanical software HOSS, based on a finite-discrete element formulation (Munjiza, 2004; Munjiza et al., 2011, 2014, 2013; Lei et al., 2014), to create a new numerical model of impacts in regolith. The lagrangian framework is appropriately tackling all modeling challenges stated above, as it allows for a straightforward description of discontinuities in unconsolidated materials and deviatoric stresses. Consequently, a better description of shear waves and surface processes is possible as well as non-isotropic impact processes.
In the following, we present the laboratory experiments we use to validate the nu-merical model, as well as the nunu-merical method and the material model used to describe
Pressure
"el "f c= ↵ Volumetric
Pel
elastic pore crush f ull crush
Kel Ktrans Kf c Strain m Strength PSmax Smax Mean Stress yield curve frict ion Sc
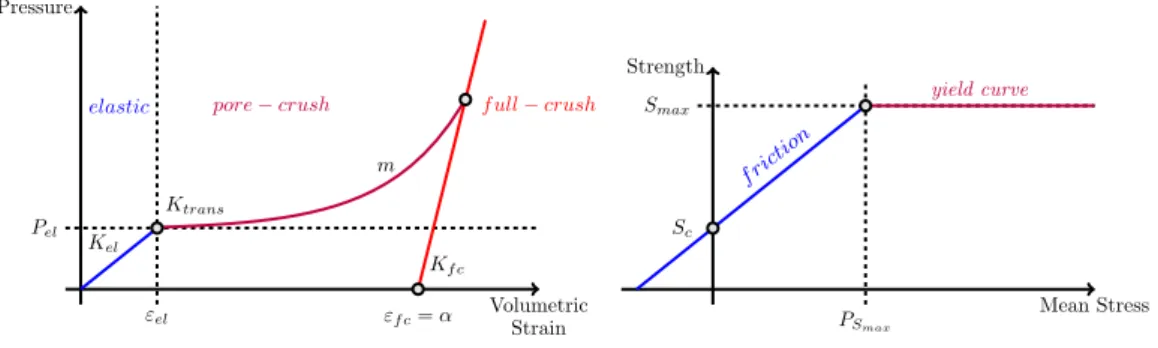
Figure 1. Simplified representation of the Equation of State (left) and the Strength Equation (right) and their key parameters.
Mars regolith. We present results of a parametric study of the model where we identify
81
which parameters control the transition to the di↵erent regimes of impacts, meaning from
82
shock to plastic to elastic response of the material. We then present a comparison of the
83
model predictions to the laboratory data, before finishing with discussions and
conclu-84
sions.
85
2 Laboratory experiments and model.
86
2.1 Experiments
87
The validation of the novel numerical model presented in this paper is done with
88
data from a series of laboratory impact experiments conducted at the NASA/AVGR
fa-89
cility (Richardson & Kedar, 2013). The experimental setup is composed of a
cylindri-90
cal tank, 1 meter in radius and in height, filled with a target bed and placed inside a
cham-91
ber with a controlled atmosphere. Tests were monitored by 15 accelerometers buried into
92
the target at di↵erent positions. Sampling rate is 10 5 s.
93
We focus on two experiments performed in an Earth atmosphere at Martian
pres-94
sure of 5 to 10 torr, and on a target bed of pumice sand. This sand has a grain size of
95
0.1 to 0.2 mm, a porosity of 62%, and a composition and density similar to the
John-96
son Space Center (JSC) Mars-1 Regolith Simulant (Allen et al., 1997). In this study, the
97
impactor is a 6.3 mm diameter bead with a mass of 0.29g made of Pyrex, and an impact
98
velocity of 0.98 km/s.
2.2 Numerical model
100
The numerical model is based on a finite-discrete element representation (FDEM)
101
used to handle the unconsolidated nature of Mars regolith. FDEM merges continuum
102
solutions for the calculation of stresses as a function of deformation with the discrete
el-103
ement method for the resolution of fracture, fragmentation and contact interaction (Munjiza,
104
2004; Munjiza et al., 2011, 2014, 2013; Lei et al., 2014; Lei, Rougier, Knight, Munjiza,
105
& Viswanathan, 2016; Lei, Rougier, Knight, Frash, et al., 2016).
106
We generate meshes of tetrahedral elements covering a 30 sector of the experiment
107
tank. The numerical volume is 90cm deep and wide and contains around 1,000,000
el-108
ements. Each Lagrangian finite element (FE) contains from approximatively 1000 grains
109
of sand for the smallest ones close to the impactor (tetrahedrons of 1mm edges) and 1,000,000
110
grains of sand for the largest ones (tetrahedrons of 1cm edges), allowing for a mesoscale
111
representation of the sand properties.
112
To simulate the grain displacements involved in impacts in unconsolidated
mate-113
rial, HOSS treats the tetrahedral FEs as an unconsolidated heap where the elements
in-114
teract only through frictional contact, with a Coulomb coefficient of friction of 0.75 for
115
this study. Inside each FE, the material model is governed by two equations, depicted
116
in Figure 1. One describes the volumetric response, or Equation of State (EOS), and the
117
other the deviatoric response, or Strength Equation (SE). The EOS is a function of
pres-118
sure with volumetric strain and has three di↵erent domains. The first one is elastic, with
119
pressure increasing linearly with strain, given a bulk modulus Kel, as P (") = Kel".
Af-120
ter a limit pressure Pel is reached, the porous material undergoes grain displacement and
121
grain crushing. This domain starts with a break of slope from Kel to Ktrans and is
fol-122
lowed by an exponential increase of pressure with deformation. The equation of this curve
123 is : 124 P (") = Pel+ Ktrans m· ln(10)(10 m(" "el) 1) for " " el. (1)
where " is the strain, "el is the upper strain limit of the elastic regime and m is a
pa-125
rameter describing the exponent of the curve. Ktrans drives the slope of the pore-crush
126
curve at the beginning of the crushing processes. Given two values of Ktrans, a lower value
127
means that the material is easier to crush, because a lower amount of pressure is
suffi-128
cient to obtain the same amount of deformation as with a higher value. m is the
nent of the pore-crush curve and the same reasoning applies, i.e., a low m results in an
130
easily crushable material.
131
Finally, when the material is fully crushed and all the porosity ↵ of the material
132
disappears, the exponential curve morphs into a straight line with bulk modulus Kf c of
133
a non-porous rock of the same composition.
134
The SE (Figure 1, right) sets the limit deviatoric stress (i.e., yield stress) that can
135
be sustained by the material for any given mean stress. In this simplified model, the yield
136
curve first increases linearly with mean stress and upon reaching the yield limit (PSmax, Smax), 137
it becomes constant, transitioning to a more viscous behavior. In the case of a
granu-138
lar material like sand, the cohesion Sc of the material is zero.
139
The response of the impactor’s material is represented using the Munjiza’s
elas-140
tic model (Munjiza et al., 2014; Lei, Rougier, Knight, Frash, et al., 2016). The FE size
141
and impact speed result in an integration time step of a few nanoseconds. Given the time
142
scale of the experimental signals, the simulation need to be run up to a few milliseconds.
143
3 Results
144
3.1 Parametric study
145
This work focuses on the parameters Kel, Ktrans, m, Pel and PSmax. For each of 146
these parameters, between 3 and 4 simulations are run to explore the e↵ect of their change
147
on the shock wave properties. This first set of analysis is conducted without including
148
Earth gravity to the simulation. The e↵ects of this additional force are discussed in
sec-149
tion 3.2.
150
Literature on sand mechanical properties provide ranges of values for some of these
151
parameters. The parameter m thus seems to be between 3 and 6 for the sand studied
152
in (Luo et al., 2011; Yamamuro et al., 1996, 2011). The elastic p-wave velocities
mea-153
sured on Mars regolith simulants (Morgan et al., 2018) range between 80 m/s and 250
154
m/s and the Poisson’s ratio is around 0.2, leading to Kel roughly between 5MPa and 60MPa
155
for a bulk density of 880 kg/m3. In many experiments (Berney IV & Smith, 2008;
Hy-156
odo et al., 2002), the shear response of sands tends to remain in the domain of Coulomb
157
friction even above a few MPa of pressure, leading to PSmax> 10
6 Pa.
(b)
(c)
(a)
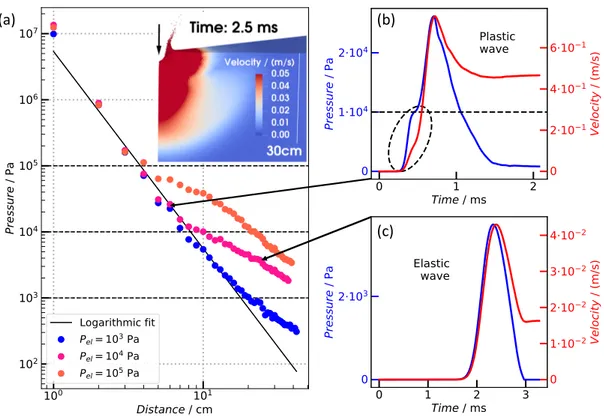
Figure 2. Evidence of an elastic and plastic regimes. (a) Shows the maximum modeled pres-sure recorded with distance for three di↵erent values of Pel. In inset, a snapshot of a HOSS
simulation of the 0.98 km/s shot, showing the amplitude of the velocity and the ejected sand elements 2.5ms after the impact. (b) Waveform in an area where P exceeds Pel = 104 Pa. The
dashed circle indicates the elastic precursor followed by the plastic wave. (c) Waveform in an area further away from the impact with only an elastic wave. Pelappears to be an important
159 160 161 162 163 164 165 166 167 168 169 170 171 172 173 174 175 176 177 178 179 180 181 182 183
ulus G, the velocity of a purely acoustic wave is vaccoustic =
In a first test, PSmax has been varied between 10
6 Pa down to 103 Pa. For P Smax>
105Pa, the seismic waves show no visible change of amplitude, shape or velocity away
from the impactor. Indeed, the stress values reached with these low-energy impacts are typically around 104 Pa. Only a few elements within 5cm of the impact undergo
pres-sures higher than 106Pa. Therefore, the yield strength has to be lowered to very low
val-ues of 104or 103 Pa to produce a visible e↵ect on the shock wave away from the source.
These values are far from typical values of yield strength measured for sand (Berney IV & Smith, 2008) and can be considered unphysical, therefore the plastic wave is essen-tially una↵ected by realistic yield strengths.
Consequently, we focus on the transition between elastic and plastic domain. It is known in shock physics that a deflection in the Shock-Hugoniot curve at the onset of plas-ticity results in the generation of two waves: the elastic precursor, which travels at elas-tic speed in the medium, and a plaselas-tic wave with slower propagation velocity and higher attenuation. These features are generated by the elastic-plastic transition in the EOS model, if Ktrans < Kel. This change of regime is evident on Figure 2 as a change of
the slope of the evolution of the maximum pressure with distance. The break corresponds to the distance at which the maximum pressure falls below Pel. Modeled signals for which
the pressure exceeds Pel show an elastic precursor followed by a plastic wave, but
con-tain only an elastic wave in the other case.
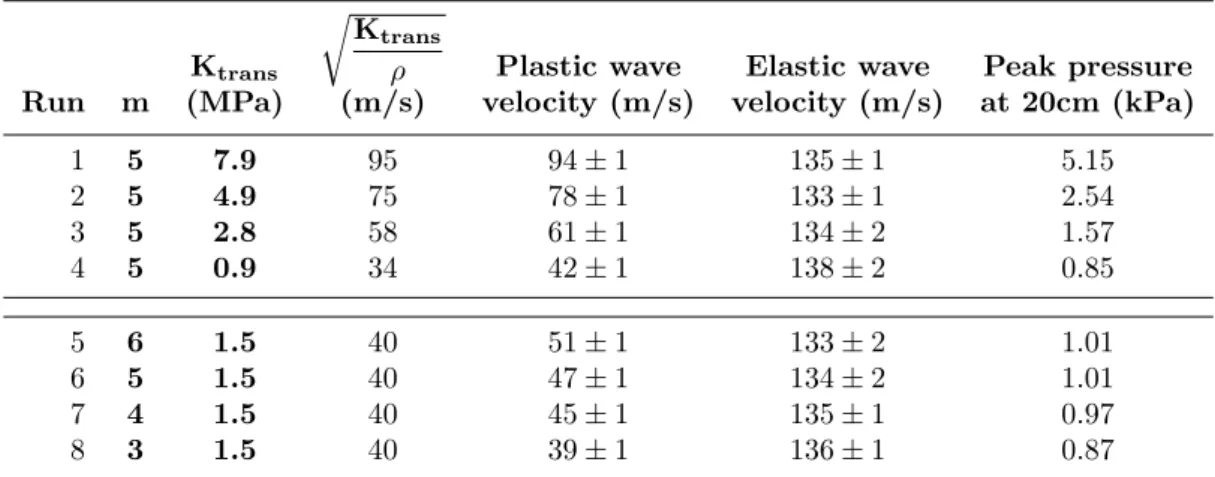
Table 1 gathers a series of measures on the e↵ect of Kel and Ktranson the impact
shock wave. Four experiments were ran with Kel = G = 10 MPa and Ktransvarying
between⇠ 1 and ⇠ 8 MPa. The velocity of the generated elastic wave was measured by picking the acceleration arrival times. As Kel > Ktrans, a plastic wave is also
cre-ated, whose move-out velocity can be computed using the peak time of the pressure wave between sensors placed every 1cm. For our value of bulk mo
r
dulus Kel and shear
mod-Kel
⇢ = 107 m/s, and
184
the velocity of a solid P-wave is vsolid=
s
Kel+43G
⇢ = 162 m/s. The measured
elastic-185
wave velocity in the granular material is vaccoustic< 133 m/s < vsolid. Results show
186
that the plastic wave itself propagates with a velocity slightly above r
Ktrans
⇢ , but still
187
slower than the measured elastic wave velocity. It also appears that, at a specific point
188
in the tank, the ratio of pressure amplitude with the square root of Ktranshas a
Table 1. Parametric study of Ktrans (Runs 1 to 4) and m (Runs 5 to 8). Plastic wave
veloc-ities have been measured by recording the time at which pressure peaks as a function of range. Elastic wave velocities have been measured by picking the acceleration wave arrival time with a threshold as a function of range. The theoretical value for this elastic wave velocity is between 107 and 162 m/s, as explained below. Peak pressure is also given at 20cm.
Run m Ktrans (MPa) r Ktrans ⇢ (m/s) Plastic wave velocity (m/s) Elastic wave velocity (m/s) Peak pressure at 20cm (kPa) 1 5 7.9 95 94± 1 135± 1 5.15 2 5 4.9 75 78± 1 133± 1 2.54 3 5 2.8 58 61± 1 134± 2 1.57 4 5 0.9 34 42± 1 138± 2 0.85 5 6 1.5 40 51± 1 133± 2 1.01 6 5 1.5 40 47± 1 134± 2 1.01 7 4 1.5 40 45± 1 135± 1 0.97 8 3 1.5 40 39± 1 136± 1 0.87
ilar value for each experiment, suggesting a good agreement with a rough linear
Hugo-190
niot model of P ⇠ VimpactpK⇢.
191
To further analyse the e↵ect of the crush regime, the exponent m of the
pore-192
crush curve is varied between 3 and 6, while the parameter Ktrans is fixed to a value of
193
1.5 MPa, and we repeat the same measurement as before. In Table 1, our results show
194
that, at the scale of these experiments, m has only a moderate influence on the plastic
195
wave velocity, as well as on the amplitude of the generated wave.
196
3.2 Volumetric Response of Pumice Sand
197
From the parametric study reported previously, it is possible to infer appropriate
198
parameters to fit the experimental signals. To match the wave velocity measured on the
199
vertical accelerometers of the AVGR shot, Kel is set to 10 MPa. The elastic precursor
200
being visible up to 42cm below the impact point in the experiments, Pel must be lower
201
than the maximum pressure reached at this point, which leads to Pel= 1kPa. To match
202
the amplitudes of the wave on each of the sensors, Ktrans is set to 6 MPa. The
exper-203
imental data could not provide enough constraints on m or the parameters from the SE.
204
We thus set the exponent m to 5, a number found in some high-pressure experiments
205
in several types of sands (Yamamuro et al., 1996, 2011; Luo et al., 2011). The SE yield
206
point is set to a value of 1 MPa, too high to create any visible yield in our sand, and the
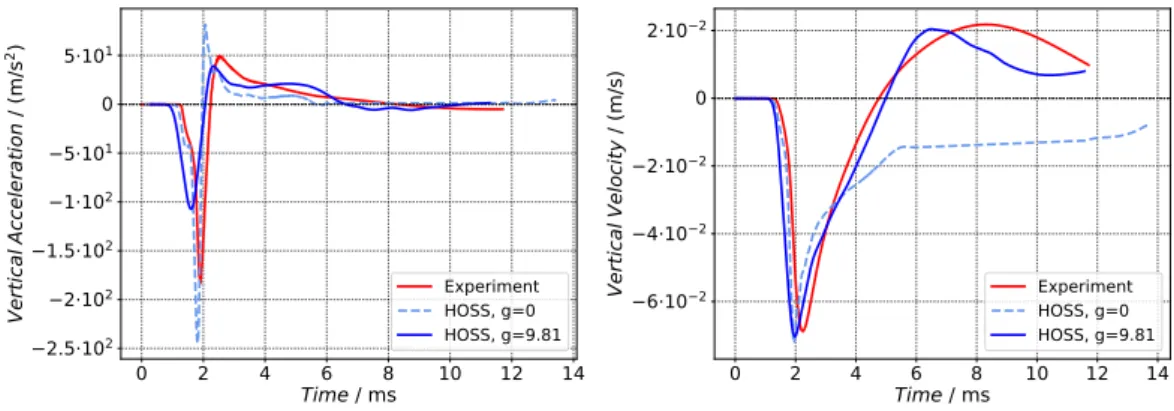
Figure 3. Compared numerical and experimental vertical acceleration (left) and velocity (right) signals for the 0.98 km/s impact velocity shot, recorded at a sensor 21cm directly below the impact point. The solid blue line and the dashed light-blue line correspond to simulations performed with and without earth gravity, respectively. The simulation better matches the exper-iment when gravity is considered.
friction coefficient is kept at 0.75. To study the e↵ects of gravity on the results, we
in-208
clude an initial acceleration of -9.81 m/s2 to one simulation, letting the sand relax to an
209
equilibrium over a few 100ms before the impact. Another simulation is run without
grav-210
ity, but both use the same material model parameters as listed above. The resulting
nu-211
merical and experimental waveforms are compared 21cm directly below the impact point
212
on Figure 3 and 30cm horizontally from the impact point on Figure 4, both with and
213
without the gravitational constraint.
214
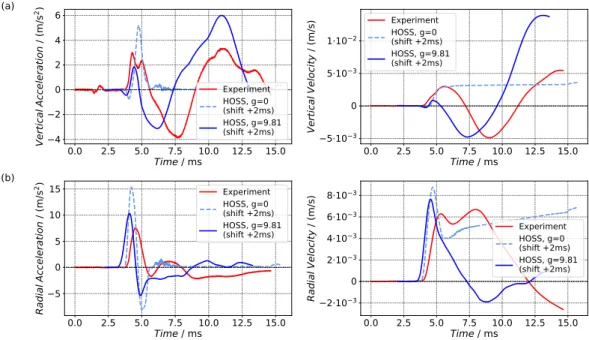
On Figures 3 and 4, the modeled acceleration wave has an amplitude 40% lower
215
and 33% higher than the experimental signal for the vertical sensor with and without
216
gravity, respectively; and up to 100% higher for the horizontal sensor with no gravity.
217
The velocity wave, however, ranges closer to the experimental signal. The arrival times
218
at the vertical sensors match each other, in accordance with a measured vertical
move-219
out velocity of 150 m/s. For the shallow sensors, we measure a horizontal moout
ve-220
locity closer to 80 m/s, while the modeled waves keep the same move-out velocity as for
221
the vertical sensors, thus being ahead of time.
222
4 Discussion, Conclusions and Future Work
223
The presence of gravity improves significantly the modeled material response to the
224
main shock. In the model without gravity, this response is weak enough so that the
ve-225
locity of the vertical sensor remains negative after 5ms (Figure 3). On the shallow
Figure 4. Compared numerical and experimental vertical (a) and radial (b) signals for the 0.98 km/s impact velocity shot. Both accelerations and velocities are shown for the sensor 30 cm radially away from the impact point. The solid blue line and the dashed light-blue line corre-spond to simulations performed with and without earth gravity, respectively. Note that modeled signals have been shifted in time to obtain a better match (see text for details).
sor, the modeled velocity reaches a constant positive value after 4ms when the
acceler-227
ation vanishes (Figure 4). This indicates that the element attached to this sensor is in
228
a non-accelerated motion, a ”free-flight”. The modeled signal with Earth gravity di↵er
229
greatly. On Figure 3, we can see that the counter-response of the material to the impact
230
is now strong enough to create a positive velocity on the vertical sensor, reproducing the
231
behavior of pumice sand of the experiment. Acceleration on the shallow sensor displayed
232
on Figure 4 doesn’t show any longer evidence of free-flight but starts a cycle of falling
233
down and rebounding as seen on the experimental data.
234
The parametric study suggests that the plastic yield, PSmax, has little influence on 235
the shock wave. This is due to the fact that the stress level in our modeling reaches at
236
most the order of 10 kPa, way lower than any documented plastic yield. The modeled
237
material thus remains in a regime where the SE can be approximated by a simple
Mohr-238
Coulomb surface. On the contrary, some questions remain on the e↵ect of the elastic shear
239
modulus G of the material. In this study, G, which a↵ects both the shear wave and Rayleigh
240
wave speed of an elastic material, was fixed once it became clear that the main shock
is mostly driven by the EOS parameters, but shear- or Rayleigh waves might still be an
242
explanation for the late-time discrepancies between the modeled and experimental waves
243
that are not caused by gravity. Moreover, this study shows that the wave moout
ve-244
locity is not completely determined by the elastic bulk modulus Kel, but rather lies
be-245
tween the expected speed of sound in a fluid vaccousticand the P-wave velocity in a solid
246
vsolid. A more thorough study of the influence of G could shed some light on the
elas-247
tic speed of waves in granular media, which can neither be considered as a fluid nor as
248
a traditional elastic solid, and will help calibrating the model with respect to the
exper-249
iments.
250
The study of the pore-crush curve suggests that plastic processes in sand, such as
251
pore collapse and grain displacement are particularly efficient in the shock attenuation,
252
and that the slope of the pore-crush curve of the EOS is key in capturing this
attenu-253
ation. Still, trade-o↵s exist between the model parameters analyzed. For example,
pa-254
rameters Ktrans and m, that define the pore-crush curve, play a role in the amplitude
255
and peak time of the plastic wave. An increase in m could thus compensate for a decrease
256
in Ktrans.The low pressure part of the curve is easier to constrain with the available data,
257
but the scale of the experiments does not allow for a proper determination of the
high-258
pressure response. The high-pressure EOS and SE will be of higher importance in the
259
case of real planetary impacts, where the energy involved is several orders of magnitude
260
higher. For example, the impact velocity distributions computed for Mars from observed
261
asteroid populations yield a mean impact velocity of 9.6 km/s (Ivanov, 2001). For
bet-262
ter model accuracy at high pressures, other types of high-stress laboratory data or
the-263
oretical models should be considered in the future.
264
In conclusion, the final model captures the vertical wave’s shape and amplitude for
265
an impact velocity of 0.98 km/s. This proves that HOSS can reproduce the main
char-266
acteristics of an impact shock wave in granular media. The results have shown to be more
267
sensitive to variations on the EOS parameters than to variation on the SE parameters.
268
Gravity has proved to be a key parameter in the later stages of wave simulation by
pro-269
viding a more realistic material response. However, the arrival times and amplitudes recorded
270
at the shallow sensors cannot be reproduced by this model. Understanding this
discrep-271
ancy requires further study, as a non-spherical wavefront needs to be modeled. Future
272
works will investigate the e↵ect of shear waves on the signal and the hypothesis of
depth-273
dependant elastic properties created by the constraint of sand by gravity, as it has
275 276 277 278 279 280 281 282 283 284 285 286 287 288 289 290 291 292 293 294
ready been reported in literature (Morgan et al., 2018; van den Wildenberg et al., 2013). This non linear constraint creates a dependance of the bulk modulus with pressure in the elastic domain. Improving the fidelity of HOSS’ model to the experimental truth will bring more insight into the physics of shocks in granular, highly porous media and a new definition of equivalent seismic sources for impacts. Such new validated modeling capa-bility will help predict the signal of small planetary impacts, for which surface porous regolith endures most of the shock. These small impact might be recorded by InSight, if close enough, and provide new information on the crustal seismic properties of Mars.
Acknowledgments
This work is InSight contribution number 119 and LA-UR-19-32642. We thank the LANL-HPC environment for providing and maintaining the Los Alamos High-Performance Com-puting facilities and the NASA/AVGR facility for conducting the impact experiments. We also thank the reviewers whose comments helped improve and clarify this manuscript. Experimental data are in the process of being transferred to an online repository. More details on the parametric study can be found in the Master thesis of the author (Froment, 2020). This work is funded by the LANL Center for Space and Earth Science (CSES) project XWPB00 and the ARPE student program of the ´Ecole Normale Sup´erieure Paris-Saclay. The French co-authors are acknowledging the support of CNES and ANR (un-der contract MAGIS ANR-19-CE31-0008-08).
References
Allen, C. C., Morris, R. V., Lindstrom, D. J., Lindstrom, M., & Lockwood, J.
295
(1997). JSC Mars-1-Martian regolith simulant. In Proceedings of the
296
28th lunar and planetary science conference. Retrieved from https://
297
www.lpi.usra.edu/meetings/lpsc97/pdf/1797.PDF
298
Banerdt, W. B., Smrekar, S. E., Banfield, D., Giardini, D., Golombek, M., Johnson,
299
C. L., . . . Wieczorek, M. (2020). Initial results from the InSight mission on
300
Mars. Nature Geoscience. doi: https://doi.org/10.1038/s41561-020-0544-y
301
Banfield, D., Rodriguez-Manfredi, J. A., Russell, C. T., Rowe, K. M., Leneman, D.,
302
Lai, H. R., . . . Banerdt, W. B. (2019). InSight Auxiliary Payload Sensor Suite
303
(APSS). Space Science Reviews, 215 (1), 4.
304
Berney IV, E. S., & Smith, D. M. (2008). Mechanical and Physical Properties of
305
ASTM C33 Sand (Tech. Rep.). US Army Engineer Research and Development
306
Center, Geotechnical and Structures Laboratory.
307
Carrier, W. D., Olhoeft, G. R., & Mendell, W. (1991). Physical properties of the
lu-308
nar surface. Lunar sourcebook , 475–594.
309
Collins, G. S., Housen, K. R., Jutzi, M., & Nakamura, A. M. (2019). Planetary
310
impact processes in porous materials. In Shock phenomena in granular and
311
porous materials (pp. 103–136). Springer.
312
Daubar, I., Lognonn´e, P., Teanby, N. A., Miljkovic, K., Stevanovi´c, J., Vaubaillon,
J., . . . Banerdt, B. W. (2018). Impact-seismic investigations of the InSight
314
mission. Space Science Reviews, 214 (8), 132.
315
Daubar, I., McEwen, A. S., Byrne, S., Kennedy, M., & Ivanov, B. (2013). The
cur-316
rent martian cratering rate. Icarus, 225 (1), 506–516.
317
Froment, M. (2020). Internship Report: Numerical modelling of impact seismic
sig-318
nals on regolith. Office of Scientific and Technical Information. doi: https://
319
doi.org/10.2172/1593106
320
Gao, K., Guyer, R., Rougier, E., Ren, C. X., & Johnson, P. A. (2019). From stress
321
chains to acoustic emission. Physical review letters, 123 (4), 048003.
322
Giardini, D., Lognonn´e, P., Banerdt, W. B., Pike, W. T., Christensen, U., Ceylan,
323
S., . . . Yana, C. (2020). The seismicity of Mars. Nature Geoscience. doi:
324
https://doi.org/10.1038/s41561-020-0539-8
325
G¨uldemeister, N., & W¨unnemann, K. (2017). Quantitative analysis of
impact-326
induced seismic signals by numerical modeling. Icarus, 296 , 15 - 27.
327
Hapke, B., & van Hoen, H. (1963). Photometric studies of complex surfaces, with
328
applications to the moon. Journal of Geophysical Research, 68 (15), 4545–
329
4570.
330
Hyodo, M., Hyde, A. F., Aramaki, N., & Nakata, Y. (2002). Undrained monotonic
331
and cyclic shear behaviour of sand under low and high confining stresses. Soils
332
and Foundations, 42 (3), 63–76.
333
Ivanov, B. A. (2001). Mars/Moon cratering rate ratio estimates. Space Science
Re-334
views, 96 (1-4), 87–104.
335
Lei, Z., Rougier, E., Knight, E., & Munjiza, A. (2014). A framework for grand scale
336
parallelization of the combined finite discrete element method in 2d.
Computa-337
tional Particle Mechanics, 1 (3), 307–319.
338
Lei, Z., Rougier, E., Knight, E. E., Frash, L., Carey, J. W., & Viswanathan, H.
339
(2016). A non-locking composite tetrahedron element for the combined finite
340
discrete element method. Engineering Computations.
341
Lei, Z., Rougier, E., Knight, E. E., Munjiza, A., & Viswanathan, H. (2016). A
gen-342
eralized anisotropic deformation formulation for geomaterials. Computational
343
Particle Mechanics, 3 (2), 215–228.
344
Lognonn´e, P., Banerdt, W., Pike, W., Giardini, D., Christensen, U., Garcia, R.,
345
. . . Zweifel, P. (2020). Constraints on the shallow elastic and
anelas-346
tic structure of Mars from InSight seismic data. Nature geoscience. doi:
347
http://doi.org/10.1038/s41561-020-0536-y
348
Lognonn´e, P., Banerdt, W. B., Giardini, D., Pike, W. T., Christensen, U., Laudet,
349
P., . . . Wookey, J. (2019). SEIS: Insight’s Seismic Experiment for Internal
350
Structure of Mars. Space Science Reviews, 215 (1), 12.
351
Lognonn´e, P., & Johnson, C. L. (2007). Planetary seismology. Treatise on
Geo-352
physics, 10 , 69–122.
353
Luo, H., Lu, H., Cooper, W. L., & Komanduri, R. (2011). E↵ect of mass density on
354
the compressive behavior of dry sand under confinement at high strain rates.
355
Experimental mechanics, 51 (9), 1499–1510.
356
Malin, M. C., Edgett, K. S., Posiolova, L. V., McColley, S. M., & Dobrea, E. Z. N.
357
(2006). Present-day impact cratering rate and contemporary gully activity on
358
mars. science, 314 (5805), 1573–1577.
359
Morgan, P., Grott, M., Knapmeyer-Endrun, B., Golombek, M., Delage, P.,
360
Lognonn´e, P., . . . Kedar, S. (2018). A pre-landing assessment of regolith
361
properties at the InSight landing site. Space Science Reviews, 214 (6), 104.
362
Munjiza, A. (2004). The combined finite-discrete element method. John Wiley &
363
Sons.
364
Munjiza, A., Knight, E. E., & Rougier, E. (2011). Computational mechanics of
dis-365
continua. John Wiley & Sons.
366
Munjiza, A., Knight, E. E., & Rougier, E. (2014). Large Strain Finite Element
367
Method: A Practical Course. John Wiley & Sons.
Munjiza, A., Rougier, E., Knight, E. E., & Lei, Z. (2013). HOSS: An integrated
369
platform for discontinua simulations. In G. Chen, Y. Ohnishi, L. Zheng, &
370
T. Sasaki (Eds.), Frontiers of discontinuous numerical methods and practical
371
simulations in engineering and disaster prevention (pp. 97–104). CRC Press.
372
Retrieved from https://doi.org/10.1201/b15791-12
373
Pierazzo, E., Artemieva, N., Asphaug, E., Baldwin, E. C., Cazamias, J., Coker, R.,
374
. . . W¨unnemann, K. (2008). Validation of numerical codes for impact and
375
explosion cratering: Impacts on strengthless and metal targets. Meteoritics &
376
Planetary Science, 43 (12), 1917-1938.
377
Richardson, J., & Kedar, S. (2013). An experimental investigation of the seismic
sig-378
nal produced by hypervelocity impacts. In Lunar and planetary science
confer-379
ence (Vol. 44, p. 2863).
380
Sun, Q., Wang, G., & Hu, K. (2009, 05). Some open problems in granular matter
381
mechanics. Progress in Natural Science - PROG NAT SCI , 19 . doi: 10.1016/
382
j.pnsc.2008.06.023
383
Teanby, N. (2015). Predicted detection rates of regional-scale meteorite impacts on
384
Mars with the InSight short-period seismometer. Icarus, 256 , 49–62.
385
van den Wildenberg, S., van Loo, R., & van Hecke, M. (2013). Shock waves in
386
weakly compressed granular media. Physical review letters, 111 (21), 218003.
387
W¨unnemann, K., Collins, G., & Melosh, H. (2006). A strain-based porosity model
388
for use in hydrocode simulations of impacts and implications for transient
389
crater growth in porous targets. Icarus, 180 (2), 514–527.
390
Yamamuro, J. A., Abrantes, A. E., & Lade, P. V. (2011). E↵ect of strain rate on the
391
stress-strain behavior of sand. Journal of Geotechnical and Geoenvironmental
392
Engineering, 137 (12), 1169–1178.
393
Yamamuro, J. A., Bopp, P. A., & Lade, P. V. (1996). One-dimensional compression
394
of sands at high pressures. Journal of geotechnical engineering, 122 (2), 147–
395
154.
396