HAL Id: insu-00783032
https://hal-insu.archives-ouvertes.fr/insu-00783032
Submitted on 27 Mar 2013HAL is a multi-disciplinary open access archive for the deposit and dissemination of sci-entific research documents, whether they are pub-lished or not. The documents may come from teaching and research institutions in France or abroad, or from public or private research centers.
L’archive ouverte pluridisciplinaire HAL, est destinée au dépôt et à la diffusion de documents scientifiques de niveau recherche, publiés ou non, émanant des établissements d’enseignement et de recherche français ou étrangers, des laboratoires publics ou privés.
Application of neural network model for the prediction
of Chromium concentration in phytoremediated
contaminated soils
Nour Hattab, Ridha Hambli, Mikael Motelica-Heino, Xavier Bourrat
To cite this version:
Nour Hattab, Ridha Hambli, Mikael Motelica-Heino, Xavier Bourrat. Application of neural network model for the prediction of Chromium concentration in phytoremediated contaminated soils. Journal of Geochemical Exploration, Elsevier, 2013, 128, pp.25-34. �10.1016/j.gexplo.2013.01.005�. �insu-00783032�
1
Application of neural network model for the prediction of Chromium
concentration in phytoremediated contaminated soils
Nour HATTABa*, Ridha HAMBLIb, Mikael MOTELICA-HEINOa, Xavier BOURRATa, Michel MENCHC
a ISTO
UMR 7327 - CNRS/Université d'Orléans
Campus Géosciences, 1A, rue de la Férollerie, 45071 Orléans cedex 2, France mail : [email protected]
b
Prisme Institute – MMH
8, Rue Léonard de Vinci, 45072 Orléans cedex 2, France mail : [email protected]
c
UMR BIOGECO INRA 1202, Ecologie des communautés, Université Bordeaux 1, Bat B8 RDC Est, Avenue des facultés, F-33405 Talence, France
Abstract
The assessment of chromium concentrations in plants requires the quantification of a large
number of soil factors that affect their potential availability and subsequent toxicity and a
mathematical model that predicts their relative concentrations. Many soil characteristics can
change the availability of chromium (Cr) to plants in soils. However, accurate, rapid and simple
predictive models of metal concentrations are still lacking in soil and plant analysis. In the
present work a novel artificial neural network (ANN) model was developed as an alternative
rapid and accurate tool for the prediction of Cr concentration in dwarf bean leaves grown in the
laboratory on phytoremediated contaminated soils treated with different amendments. First,
sixteen (4x4) soil samples were harvested from a phytoremediated contaminated site located in
south-western France. Second, a series of measurements were performed on the soil samples.
The inputs are the soil amendment, the soil pH, the soil electrical conductivity and the
2 leaves. Third, an ANN model was developed and its performance was evaluated using a test
data set and then applied to predict the exposition of the bean leaves to the Cr concentration
versus the soil inputs. The performance of the ANN method was compared with the traditional
multi linear regressions method using the training and test data sets. The results of this study
show that the ANN model trained on experimental measurements can be successfully applied
to the rapid prediction of plant exposition to Cr.
Key words: Artificial neural networks (ANN), Soil contamination, Chromium prediction, pH, EC, DOC
1. Introduction
Chromium in plants has received relatively little attention from researchers in
comparison with other trace elements such as Cu, Cd, Ni, Al and As. Soils contaminated with
Cr have serious consequences for terrestrial ecosystems, agricultural production and human
health (Adriano, 2001). Chromium has been considered as the 16th most toxic pollutant and it
has become a serious health concern because of its carcinogenic and teratogenic effects
(Kowalski, 1994). Chromium is also considered a serious environmental pollutant (Kotas and
Stasicka, 2000), due to its widespread use in the metallurgical and chemical industries.
Improper disposal, poor storage and leakage of Cr from waste discharge through the soil can
release Cr to the environment, causing contamination of groundwater and adverse biological
and ecological effects.
Chromium is present in the environment in the form of Cr(III) and Cr(VI). These two
forms show different chemical, physico-chemical and biochemical properties. Species of
3 al., 1989; Katz and Salem, 1994; Fendorf, 1995; James et al., 1997). This may be due to the
fact that Cr(VI) penetrates mammalian cells more readily than Cr(III) (Wetterhahn and
Hamilton, 1989). Compounds of Cr(VI) are toxic at low concentrations for both plants and
animals. The presence of Cr(VI) in water, soil and wastewater has, therefore, been of great
concern. Many factors can influence its migration process, such as pH (McLean and Bledsoe,
1992), dissolved organic carbon or DOC (Heijerick et al., 2003), electrical conductivity or EC
(Förstner. 1985) and soil characteristics such as cation exchange capacity, clay content and
competition from other metal ions (Sauerbeck and Hein, 1991; Smith, 1994). Soluble
chromates are converted to insoluble Cr(III) salts and the subsequent availability for plants
decreases (Wetterhahn and Hamilton, 1989). However, soil amendments such as pH
(Kabata-Pendias et al.. 2000; Jackson et al., 2000), DOC (Hsu et al., 2000), and EC (Laing et al., 2009;
Hatje et al., 2003) can be used to change the soil condition and reduce the high concentration of
Cr in contaminated soils (Mench and Bes, 2009; Bes and Mench, 2008). Amendments that
induce solubility can be used to clean polluted sites by leaching the contaminating trace
elements or by facilitating their uptake by plants (phytoextraction) (Kolbas et al., 2011).
Quantifying Cr mobility in a given soil is a critical aspect of predicting its toxicity.
Since performing experimental measurements to investigate the relationship between soil
parameters and Cr mobility in soil is time-consuming, difficult and expensive, the development
of models simulating soil processes has increased rapidly in recent years (Minasny and
McBratney, 2002). Generally two common methods are used to develop prediction models,
regression methods and artificial neural networks (ANN). Several multiple linear regression
(MLR) models have been developed over the past 20 years to predict the sorption of trace
metals in soils (van der Zee and van Riemsdijk, 1987; Andersen and Christensen, 1988; Reinds
et al., 1995; Streck and Richter, 1997; Römkens and Salomons, 1998; Tiktak et al., 1998;
4 inputs (properties) and soil output characteristics have to be stated a priori in the regression
models. An alternative to MLR is the application of ANN models where such relationships do
not need to be formulated beforehand (Anagu et al., 2009; Sarmadian and Taghizadeh
Mehrjardi, 2008; Schaap and Leij, 1998; Hambli et al., 2006; Hambli, 2009; Minasny et al.,
2004; McBratney et al., 2003; Behrens et al., 2005; Buszewski and Kowalkowski, 2006;
Gandhimathi and Meenambal, 2012).
It has been reported that ANNs provide superior predictive performance compared to
conventional mathematical methods including MLR models (van der Zee and van Riemsdijk,
1987; Andersen and Christensen, 1988; Streck and Richter, 1997; Römkens and Salomons,
1998; Tiktak et al., 1998; Schaap and Lei, 1998; Elzinga et al., 1999; Sarmadian and
Taghizadeh Mehrjardi, 2008). In regression models in many soil engineering situations, the
input-output relationships are highly complex and are not well understood. The lack of physical
understanding and of a powerful general tool for mathematical modeling leads to either
simplifying the problem or incorporating several assumptions into mathematical models.
Consequently, many mathematical models fail to simulate the complex behavior of most soil
engineering problems.
ANNs have been widely used in the field of soil science for prediction of soil hydraulic
properties (Schaap et al., 1998; Minasny et al., 2004) generation of digital soil maps
(McBratney et al., 2003; Behrens et al., 2005) and modeling of the behavior of trace metals
(Buszewski and Kowalkowski, 2006; Anagu et al., 2009; Gandhimathi and Meenambal, 2012).
In the cases, ANN are trained to find model input-output relations using an iterative calibration
process (training phase). Moreover, ANNs have the advantage of not imposing restrictions on
inputs and outputs and can be easily applied to carry out inverse calculation (Jenkins, 1997;
5 In the present study, a novel ANN model was developed as an alternative rapid and
accurate tool for the prediction of Cr concentration in dwarf bean leaves (BL) grown in the
laboratory on phytostabilized contaminated soils treated with different amendments. The inputs
are soil amendment, soil pH, soil EC and soil DOC, whereas the output is Cr concentration in
the dwarf BL. The performance of the ANN method was compared with a traditional MLR
method using the same training and test data sets. The comparative study revealed that ANN
provided a better performance than MLR method in predicting soil properties. Results showed
that the neural network model led to a very rapid and accurate prediction of the soil outputs.
2. Material and Methods
2.1. Site, soil sampling and soil characterization
Soil samples were collected from southwestern France, Gironde County (44°43’N;
0°30’W). This site has been contaminated with high concentrations of copper sulfate and chromated copper arsenate. The history of the site and the origin of these pollutants are
described in detail by Mench and Bes (2009).
The study site is divided into 15 sub-sites labeled A to E and P1 to P10 depending on
total topsoil Cu concentration (Fig. 1a) (Mench and Bes, 2009; Bes et al, 2010). Long-term
phytostabilization experiments have been established at the P3 and P7 sub-sites by Bes et al.
(2008); Mench and Bes (2009). Plant communities in the zone of the field trial included
Agrostis capillaris, Elytrigia repens, Rumex acetosella, Portulaca oleracea, Hypericum
perforatum, Hypochaeris radicata, Euphorbia chamaescyce, Echium vulgare, Agrostis
stolonifera, Lotus corniculatus, Cerastium glomeratum, and Populus nigra (Bes et al. 2010).
The field trial zone (150 m²) was established at site P3, which consists of two plots; that were
6 amendments were applied, one per subplot (Latin square design) and carefully mixed in the top
soil (0-0.30 m) with a stainless steel spade with four replicates: untreated soil (UNT), 0.2% of
dolomite limestone (DL), 5% of compost of poultry manure and pine bark (CPM), and a
mixture of 0.2% DL and 5% CPM (DLX CPM). Sixteen soil samples (four replicates) were
collected from the four plots treated with the different amendments (4X (UNT), 4X (DL), 4X (OM) and 4X (DLX OM)) to a depth of 0.25 m (Fig. 1b).
Soil pH (7.0 ± 0.23) was measured in a 1:1 soil:water suspension using a glass
electrode pH meter (Jackson, 1967). Total nitrogen (0.534 mg kg-1) was determined at the
INRA Laboratoire d’Analyses des sols (LAS), Arras, France using standard methods (INRA LAS, 2007). The organic matter content was determined by a modified Walkely-Blak method:
0.5 g soil was placed in a 500 ml conical flask and mixed with 10 ml of 0.17 M K2Cr2O7,
followed by addition of 20 ml of H2SO4, 200 ml of water, 10 ml of H3PO4 and 1 ml of
diphenylamine indicator. Finally, the contents were titrated with 0.5 M FeSO4.7H20. The main
characteristics of site P3 (0-0.25 m soil layer) are given in Table 1. The cation exchange
capacity (CEC) (3.49 Cmol+/kg) was determined using cobaltihexamine chloride (Ciesielski
and Sterckeman, 1997). Total metal content in P3 site was determined by ICP-AES after wet
digestion with HF and HCIO4 (AFNOR NF X 31-147; Ciesielski et al., 1997) (Table 1, column
2). Total soil metal concentrations were in the common range of French sandy soil for Cr, As
and Zn, but total soil Cu was in excess for these coarse sandy soils (Table 1, column 3). Total
Cr concentrations in each of the 16 potted soil samples were measured by laser ablation
inductively coupled plasma-mass spectrometry (LA-ICP-MS). Prior to metal content
measurements, the accuracy of the metals determination was checked by performing
calibrations with a homogeneous combination of certified reference materials such as
NIST-610 (artificial glass), GOR-128-G (komatiite natural glass) and NIST-361 (steel). Little
LA-ICP-7 MS measurements produced an averaged error in the range of -1.2% to 1.17%. After the
calibration phase, 4 repeated measurements were performed for each soil generating 64 testing
results (4 soils
4 amendments
4 replicates). The precision of the metal content measurement was assessed by the standard deviation (SD) and the coefficient of variation (COV) (Table 2).Fig. 1. a) Location of studied sites from A to E. The arrows indicate the studied site P3 (adapted from Mench and Bes, 2009). b) The two plots of soil with the different types of amendment (adapted from
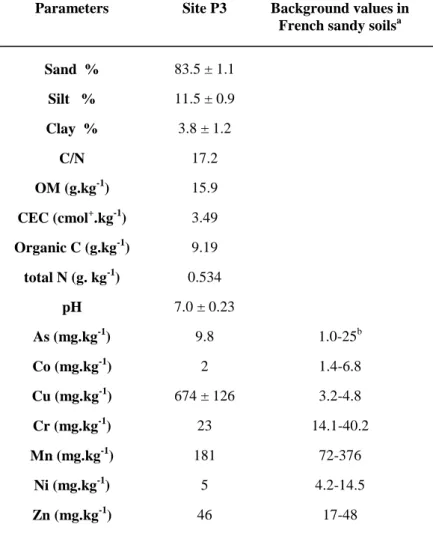
8 Table 1. Main characteristics of site P3 (0–0.25 m soil layer).
Parameters Site P3 Background values in French sandy soilsa Sand % 83.5 ± 1.1 Silt % 11.5 ± 0.9 Clay % 3.8 ± 1.2 C/N 17.2 OM (g kg− 1) 15.9 CEC (cmol+ kg− 1) 3.49 Organic C (g kg− 1)9.19 total N (g kg− 1) 0.534 pH 7.0 ± 0.23 As (mg kg− 1) 9.8 1.0–25b Co (mg kg− 1) 2 1.4–6.8 Cu (mg kg− 1) 674 ± 1263.2–4.8 Cr (mg kg− 1) 23 14.1–40.2 Mn (mg kg− 1) 181 72–376 Ni (mg kg− 1) 5 4.2–14.5 Zn (mg kg− 1) 46 17–48
A : Median and high vibrissae values except for As (Baize, 1997 and Baize and Tercé, 2002). B : Common As mean values for all French soil types (Baize and Tercé, 2002)
9 Table 2. The experimental values (pH, EC, DOC and Cr). Four replications were
performed for each measurement generating 64 testing results (4 soils × 4
amendments × 4 replicates) allowing for the determination of the mean values, standard deviations (SD) and coefficient of variations (COV).
Soil referenceAmendments Mean pH SD-COV (%) Mean EC (μS cm− 1) SD-COV (%) Mean DOC (mg l− 1) SD-COV (%) Mean Cr concentration in the soil (mg kg− 1) SD-COV (%) B1-1 UNT 7.12 NS 0.15– 2.08% 1114 NS 214.7– 18.31% 15.93⁎ 4.01– 7.75% 15.97⁎⁎ 0.98– 6.30% B2-8 UNT 7.31 NS 1230 NS 14.34 ⁎ 16.21⁎⁎ B3-15 UNT 7.28 NS 917 NS 21.74 ⁎ 15.81⁎⁎ B4-10 UNT 6.99 NS 1430 NS 24.32 ⁎ 14.07⁎⁎ B1-2 CPM 6.98 NS 0.27– 3.67% 1018 NS 122– 14.24% 27.08⁎ 4.50– 5.44% 14.67⁎⁎ 0.34– 2.31% B2-5 CPM 7.60 NS 884 NS 20.64 ⁎ 15.03⁎⁎ B3-16 CPM 7.46 NS 771 NS 25.85 ⁎ 15.15⁎⁎ B4-11 CPM 7.26 NS 754 NS 33.99 ⁎ 14.40⁎⁎ B1-4 DL 7.49 NS 0.14– 1.87% 1654 NS 308.3– 24.79% 26.34⁎ 4.14– 6.96% 17.16⁎⁎ 0.11– 0.66% B2-7 DL 7.67 NS 1000 NS 25.76 ⁎ 16.98⁎⁎ B3-14 DL 7.43 NS 1013 NS 26.52 ⁎ 17.13⁎⁎
10 Soil referenceAmendments Mean pH SD-COV (%) Mean EC (μS cm− 1) SD-COV (%) Mean DOC (mg l− 1) SD-COV (%) Mean Cr concentration in the soil (mg kg− 1) SD-COV (%) B4-9 DL 7.34 NS 1308 NS 38.46 ⁎ 16.93⁎⁎ B1-3 DLX CPM 7.45 NS 0.32– 4.46% 1192 NS 152.2– 11.90% 33.12⁎ 2.50– 7.02% 16.09⁎⁎ 0.2– 1.27% B2-6 DLX CPM 7.00 NS 1347 NS 34.26 ⁎ 15.91⁎⁎ B3-13 DLX CPM 7.07 NS 1457 NS 29.16 ⁎ 15.93⁎⁎ B4-12 DLX CPM 7.59 NS 1119 NS 29.75 ⁎ 16.35⁎⁎ NS (non significant). ⁎ Significant for p < 0.05. ⁎⁎
Highly significant for p < 0.001.
2.2. Germination tests
A phyto-toxicological test was applied to the 16 soil samples to assess whether the use
of amendments on the field trial zone, assisted by phytostabilisation, is able to reduce the
concentrations of bioavailable fractions of Cr for plants. To achieve this objective, one kilo of
11 mm). Then, four seeds of dwarf beans (Phaseolus vulgaris) were sowed in each potted soil and
cultivated for 18 days in controlled conditions (16 h light/8 h darkness). Soil moisture was
maintained at around 50% of the field water capacity with additions of deionized water after
weighing. Then, the soil moisture was raised to 80% (11-13% of air-dried soil mass) at the
beginning of the germination stage of the grains. At the end of the growing period, the plants
were harvested and then the dry weights of roots, shoots, and primary leaves were determined
after drying at 70 C°.
The dwarf beans were weighed (35-150 mg) directly into Savillex
polytetrafluoroethylene PTFE 50 ml vessels. To each vessel 2 ml H2O and 2 ml supra-pure 14
M HNO3 were added and the vessels were heated open at 65 °C for 2 h. Then, the vessel caps
were closed and the containers were left overnight at 65 °C (12-14 h). After that they were
opened, 0.5 ml of H2O2 (30%) was added to each sample and left at 75 °C open for 3 h. Then,
1.5 0.5 ml of fluorhydric acid HF (48%) was added to each sample, vessel caps were closed
and the samples were left at 100 °C overnight. Then, vessels were opened and kept at 120 °C
for 4-5 h evaporating to dryness, taken off heat, 1 ml HNO3 + 5 ml H2O + 0.1 ml H2O2 were
added to each vessel, gently warmed up and after cooling down made up to 50 ml. Trace
element concentrations in digests were determined by ICP-MS (Varian 810-MS) using standard
solution of measured trace elements, in our case, Reference Standard Solution of Chromium
(1000ppm ±1%/Certified) was used. The accuracy of the metals determination was checked by
performing calibrations with standard reference solution. Strong correlation was found between
the measured and the reference results (R2=0.998). After the calibration phase, 4 repeated
measurements were performed for each digest generating 64 testing results (4 repeated
16 digests). The precision of the metal content measurement was assessed by the standard12 mineral masses (g per pot) were determined by multiplying Cr concentration in the BL
(mg.kg−1) in dry weight of BL (g DW) (Table 4).
2.3. Characterization of soil solution
After harvesting the dwarf beans, the soils were watered with distilled water, and
maintained daily at 80% of field capacity (11-13% of air-dried soil mass) for 15 days. After 15
days, three Rhizon soil-moisture samplers from Rhizosphere Research Products (Wageningen,
Holland) were inserted for 24 h with a 45o angle into each potted soil (4
16 soil) to collect (30 ml) of soil solution from each pot. DOC was analyzed in the solution of soils by a Shimadzu©TOC 5000A analyzer. Before DOC measurements, the accuracy of the analyzer was checked
by performing calibration with standard reference solution (potassium hydrogen phthalate
(KHP) (1000 mg C/L)). In our case, the measurements produced an R²=0.999. After the
calibration, 4 repeated measurements of DOC were performed for each soil solution. The
precision of the DOC measurement was assessed by the SD and the COV (Table 2). Soil pH
and EC were determined in the same soil solutions by pH meter and the EC meter (Table 2).
Measured soil variables included soil pH, soil EC, DOC and Cr concentration in the BL
with 4 replications for each measurement (4
4 measurements) for the ANN training. Then, a neural network model was developed and trained to predict the exposition of the BL to the highCr concentration in the soil. The inputs are the soil amendment, soil pH, soil EC and DOC. The
output is Cr concentration in the BL.
13 The mobility of trace elements plays a major role in the behavior and transfer of metals
in soils. Mobility, availability and/or bioavailability of metals is controlled by several factors
such as the soil's chemical and physical properties (pH, EC, DOC, temperature, ion charges,
etc.), plant species and their related factors (Soon and Bates, 1982; Sauerbeck and Hein, 1991;
Davies, 1992, Smith, Fisher, 2002; Weng et al., 2002; Kerndorff, and Schnitzer; 1980; Vogeler
et al., 2009). It has been reported that the relationships between the mobility of metal
concentrations in plants and a given soil are mainly influenced by the soil properties related to
the ion charges (Fisher, 2002; Weng et al., 2002; Kerndorffand Schnitzer; 1980; Vogeler et al.,
2009). Therefore, in the current preliminary study, the soil inputs for the ANN model were
limited to the three measurable factors considered to be the most influential (pH, DOC and EC)
on the mobility and availability of metals in the soil.
Kabata-Pendias et al., (2000) and Jackson et al., (2000) reported that the addition of
amendments to soil increased the soil pH compared to the untreated soil, leading to a
reduction in the mobility and the availability of metals to plants. The second variable used in
our work was DOC. Hsu et al. (2000) noted that the addition of amendment to the soil
increased the soil DOC compared to that of untreated soil, which led to increasing plant mass,
reducing the bioavailability of metals by forming ligands with dissolved organic matter. The
third parameter was EC. Du Laing et al. (2008, 2009) and Hatje et al. (2003) found that an
increase in conductivity (salinity) led to increasing the mobility of some metals such as Cd
and Zn, thereby increasing the availability and bioavailability of these metals to plants.
To prepare the training data for the ANN, 64 different measurements (4 soils
4 amendments
4 replicates) were performed on the four different soils subjected to four different treatments (UNT, DL, CPM and DLX CPM). Because of the noise (uncertainty)14 input data, the 64 experiments were used for the training phase instead of 16 (the total number
of experimental replicates) to ensure a more robust processing of the scattered measurements
(Table 2).
The 64 experiments were used for the training phase instead of 16 (the total number of
experimental replicates) to ensure a more robust processing of the scattered measurements.
Presenting the entire patterns (64) ensured the reduction of the ANN prediction sensitivity to
noise related to inputs (Velleman, 1980; Kafadar, 1994; Hambli, 2009). The inputs and their
minimum/maximum levels are given in Table 3.
Table 3. Selected inputs and output for ANN training (UNT = #1, CPM = #2, DL = #3, DLX CPM = #4).
Inputs Level Min value Max value
Soil treatment 4 #1 #4
pH 4 6.98 7.6
EC (μS cm− 1) 4 754 1654 DOC (mg l− 1) 4 14.337 34.260 Output
Cr concentration in the bean leaves (mg kg− 1)
2.5. Statistical analysis
The total soil solution concentrations of Cr, pH, DOC, EC, foliar elemental concentrations,
foliar mineral masses of elements and leaf dry weight (DW) yields were statistically analyzed
by ANOVA (Statistica) to evaluate the influence of the treatment and the different effects of
soil variables on each other. All analytical determinations were performed in four replicates.
15 2.6. Artificial neural network
The ANN architecture is composed of an input layer, a certain number of hidden layers
and an output layer in forward connections. Each neuron in the input layer represents a single
input parameter. These values are directly transmitted to the subsequent neurons of the hidden
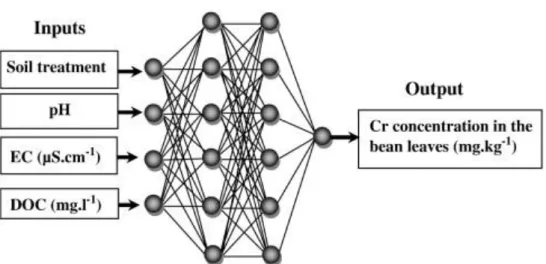
layers. The neurons of the last layer represent the ANN outputs (Fig. 2).
Fig. 2. Neural network architecture composed of four input layers, two hidden layers and one output layer.
The output m i
y of neuron i in a layer m is calculated by (Jenkins, 1997; Rafiq et al.,
2001; Hambli et al., 2006):
m i m i f v y (1)
L j m i m j m ji m i w y b v 1 1 1 (2)16 where 0
i
y are the model inputs, m i
v are the outputs of the layer m, f is the activation function, L
is the number of connections to the previous layer, wmji1 corresponds to the weights of each
connection and m i
b is the bias, representing the constant part of the activation function.
Among activation functions, the sigmoid (logistic) function is the one most usually
employed in ANN applications. It is given by (Jenkins, 1997; Rafiq et al., 2001; Hambli et al.,
2006):
m
i m i v v f exp 1 1 (3)where
is a parameter defining the slope of the function (
0.9).The training process in ANNs involves presenting a set of examples (input patterns)
with known outputs (target output) (Jenkins, 1997; Rafiq et al., 2001; Hambli et al., 2006;
Hambli, 2009). The system adjusts the
w
mji1 of the internal connections to minimize errors between the network output and target output (Levenberg-Marquardt back-propagation or BPtraining algorithm in the current work). The knowledge is represented and stored by the
strength (weights) of the connections between the neurons.
In the present work, an in-house ANN program called Neuromod written in Fortran
(Hambli et al., 2006; Hambli, 2009) was applied. The basic ANN configuration employed in this
study has a double hidden layer with six neurons of each layer with a learning rate factor
0
.
1
and momentum coefficient
0.1 (Fig. 2). The learning rate coefficient and the momentumterm are two user-defined BP algorithm training parameters that affect the learning procedure of the ANN. The training is sensitive to the choice of these net parameters. The learning rate
coefficient, employed during the adjustment of wmji1, was used to speed up or slow down the
17 are taken towards the global minimum of error level, while smaller learning coefficients increase
the number of steps taken to reach the desired error level. Tests performed for more than two
hidden layers and different and parameters showed no significant improvement in the obtained results.
A total of 64 measurements were performed. The proportion of ANN training set from
the available data ranged generally from 25% to 80%. The proportion of ANN testing set from
the available data is about 15 to 20% and the proportion of the validation data set is about (5 to
15%) (Haykin, 2009). In the current work, the experimental data (64 cases) were subdivided in
three sets: 62.5% of the data were used for training (40), 25% for testing (16) and 12.5% for
validation (8) covering a wide range of the experiments for validation (2 samples from every
experiment variant). The testing data were not used for training. The testing data provided cross
validation during the ANN training for verification of the network prediction accuracy. The
validation data were used to measure the performance of the predictive capability of the ANN
after complete training.
In order to avoid data saturation and artifacts related mainly to the coding of the
amendments (non-numeric data), the input and output variables were normalized between 0 and
1 using: min max min i i i i norm i x x x x x (4) where xi , ximin, max i
x and xinorm denote, respectively, values of input (output) variables i,
minimum value of input (output) variable, maximum value of input (output) variable and the
normalized value of i.
The de-normalized value of the ANN was computed using:
max min
min y y y y yt norm (5)18 wherey ,t
y
min, ymax and ynorm are, respectively, real-valued output variable, minimum andmaximum values of real-valued output and the normalized output value from the neural- ANN
model.
2.6.1. Coding of the amendments
The amendments are model independent inputs, therefore, they can be represented using
sequential codes (integer) as a non-numeric indexes from 1 to 4 (UNT=#1, CPM=#2, DL=#3,
DLX CPM=#4). Such non-numeric data encoding is common when applying ANN models
(Haykin, 2009). An alternative approach is to use the one-of-N encoding technique, which
consists of transforming a many-state variable (four states in our case) into several binary
variables (one for each state) to represent a single nominal variable. The number of numeric
variables equals the number of possible values; one of the N variables is set to one, and the
others are set to zero. In the current case, the input variable ―amendment‖ was replaced by 4
binary variables, (e.g., UNT= 1000, DL= 0100, CPM= 0010, DLX CPM= 0001; where 0
denotes to inactive and 1 active (Ruggiero, 1997)).
In certain cases, a nominal variable with a large number of states would require a
prohibitive number of numeric variables for one-of-N encoding, which can increase
considerably the ANN size and making the training difficult. If such is the case, it is possible to
model the nominal variable using a single numeric sequential encoding if these non-numeric
data are inputs. These sequential codes are not quantities or values related to the treatments or
any classification of them. In the current ANN model, these codes are treated by the ANN
algorithm in the following general form:
o In case #1 (UNT amendment), the prediction model is determined by the ANN learning phase related to the case 1 representing the UNT treatment.
19 o In case #2 (CPM amendment), the prediction model is determined by the ANN
learning phase related to the case 2 representing the CPM treatment.
o In case #3 (DL amendment), the prediction model is determined by the ANN learning
phase related to the case 3 representing the DL treatment.
o In case #4 (DLX CPM amendment), the prediction model is determined by the ANN
learning phase related to the case 4 representing the DLX CPM treatment.
In addition, during the training phase the assigned codes for the amendments [1, 4]
are converted in the normalized range [0, 1] using Eq. (4) to avoid coding artificial effects and
de-normalized after prediction in the range of [1, 4] using Eq. (5).
2.7. Multiple linear regression model
The most common method used to quantify relationships between inputs and outputs is
to employ multiple linear regressions in the form:
n j i i i i X Y 1 (6)where Y is the output variable i, i Xi are the input variables related to the sample, i,
i andi
are the model regression coefficients determined by a fitting procedure using generally least squares method.
3. Results and Discussion 3.1 Experimental results
20 3.1.1 Soil solution characteristics
Table 2 shows the physico-chemical parameters (i.e., pH, DOC and EC) of the 16 soil solutions
and the total soil Cr concentration measured in the 16 contaminated soils. These measurements
concerned the 16 pots containing the 16 types of soils: 4X UNT, 4X DL, 4X CPM, and 4X
DLX CPM. Amendment incorporation into the soil increased soil pH slightly in the treated soil
compared to the untreated one. This effect was in decreasing order based on mean values from
4 replicates): DL (7.5±0.14) > CPM (7.4±0.27) > DLX CPM (7.3±0.29) > UNT (7.2±0.15).
The organic matter added to the soil (i.e., CPM) resulted in reduction of EC (856.75±122.00
µS.cm-1) compared to the DL (1243.75±308.27 µS.cm-1), DLX CPM (1278.75±152.18 µS.cm
-1
) and the UNT (1172.75±214.72 µS.cm-1). The soil amendments had no significant effect on
the pH and EC of the four types of soil. In contrast, the addition of amendments significantly
increased the DOC in the soil solution compared to the untreated soil (p= 0.019). This effect
was in the following order: DLX CPM (34.6±2.50 mg.l-1) > DL (29.2±6.14 mg.l-1) > CPM
(26.8±5.49 mg.l-1) > UNT (19.0±4.72 mg.l-1). The amendments also had a significant effect on
the total Cr concentration in the soils (p= 0.000501). A good correlation was observed between
soil pH and DOC (R² = 0.589), but poorer or lack of correlations were observed between the
other variables used in our experiment.
3.1.2. Concentration and Mineral mass of Cr in the bean leaves
Table 4 shows that the measured Cr concentrations in the BL were less than the toxic
concentrations measured in the tops of plants reported by Kitagishi and Yamane (1981), Gough
et al. (1979) and Davis et al. (1978). The mean value of foliar Cr concentrations in the beans
21 0.588±0.17 in the soil amended with DL and to 0.652±0.012 in the soil amended with DLX
CPM. However, the soil amendments (CPM, DL, DLX CPM) had no significant effects on the
Cr concentrations in the BL (p= 0.436) (Table 4).
Leaf Cr mineral mass (g.ha−1) was computed with foliar Cr concentrations (mg.kg−1 DW) and
foliar biomass (g DW per pot). We can clearly note in Table that soil amendments decreased
the mineral mass of Cr in the BL compared to the UNT plants (0.094±0.03 g per pot). The
lowest Cr mineral masses were observed for the DLX CPM plants (0.067±0.01 g per pot). This
difference in the mineral masses is notably driven by the lower foliar Cr concentrations and dry
weight in the DLX CPM plants. The DL and DLX CPM additions decreased the Cr mineral
masses more than those for CPM and UNT. While amendments added to soil had a significant
effect on the total Cr concentration (p=0.000501) in the four soils UNT (15.52 mg.kg-1),
CPM(14.81 mg.kg-1), DL(17.05 mg.kg-1) and DLX CPM(16.07 mg.kg-1), there was no
significant effect of soil amendments on the concentration and the mineral masses of Cr in the
plants.
Table 4. Dry weight (g), concentration (mg kg− 1) and mineral mass of Cr (g per pot) measured in the BL.
Soil amendments
Dry weight (g)
Cr concentration in the plant (mg kg− 1)
Mineral mass (g per pot)
UNT 0.087 ± 0.04 1.438 ± 1.23 0.094 ± 0.03
CPM 0.112 ± 0.02 0.733 ± 0.08 0.083 ± 0.01
DL 0.122 ± 0.02 0.588 ± 0.17 0.069 ± 0.00
DLX CPM 0.103 ± 0.00 0.652 ± 0.012 0.067 ± 0.01
22 The ANN was trained with 3 x 10⁴ epochs (number of training cycles). The training performance was assessed by the root mean square error (RMSE). At the end of the training
phase, the RMSE convergence value was 1 x 10⁻⁵. Table 5 shows the experimental and ANN predicted values of Cr concentration in the BL for the four soil groups (four different
amendments) and their corresponding correlation coefficients.
Table 5. Comparison between averaged measured and ANN predicted values of Cr concentration in the bean leaves for the four soil groups. The determination coefficient R2 is based on the eight experimental samples kept for validation.
Soil (UNT) Soil (CPM) Soil (DL) Soil (DLX CPM) Measured NN Measured NN Measured NN Measured NN
3.29 3.285 0.762 0.764 0.519 0.519 0.524 0.523
0.748 0.746 0.709 0.710 0.775 0.773 0.819 0.820
0.601 0.600 0.392 0.391 0.892 0.890 0.805 0.804
0.661 0.662 0.498 0.496 0.618 0.616 0.781 0.780
R2 = 0.9998 R2 = 0.9986 R2 = 0.9989 R2 = 0.9991
An average correlation coefficient of 0.9998 between the measured and ANN predicted
values as found. This indicates that the ANN model was able to predict the Cr concentration in
the BL rapidly and accurately. In order to investigate the effects of the soil amendments, soil
pH, soil EC and DOC inputs on the Cr concentration in the BL, a parametric study of the ANN
output with respect to the inputs was performed for each soil treatment with the trained ANN.
For each input factor, four values in the interval between the minimum and maximum values of
each input were applied here to capture the non-linear response (Table 6). Full factorial design
generated 256 ( ) combinations to study the effect of each input on the Cr response.
23 Table 6. Selected four inputs for the ANN prediction. Full factorial combinations
generate 256 (4 × 4 × 4 × 4) data to investigate their effects on soil response.
Inputs Min Max Level 1 Level 2 Level 3 Level 4
Soil treatment #1 #4 UNT CPM DL DLX CPM
pH 6.98 7.6 7.0 7.2 7.4 7.6
EC (μS cm− 1) 754 1654 800 1100 1400 1600 DOC (mg l− 1) 14.337 34.260 14 20 28 34
To explore the relationships between the inputs and the output, several response
surfaces (RS) were plotted consisting of 3D graphical representation of a response between two
independent variables (inputs) and the output. The 3D RS plots provide insight into the
behavior of the system and enable investigation of the parametric Cr concentration results
versus the levels of the effecting factors predicted by the ANN model. Figure 3 shows the
coupled effects of the pH and EC on the Cr concentration in BL for two different values of
24 Fig. 3. Chromium concentration in BL in mg kg− 1: effects of soil pH and EC for two different limit values
25 The predicated Cr concentration depends strongly on the soil factors and the type of
amendments. It can be seen in the left-hand column of Figure 3 that soil amendments (CPM,
DL and DLX CPM) and other factors such as pH, EC and low DOC (DOC=14 mg.l-1)
decreased the Cr concentration in the BL to 1, 1.2 and 1.4 mg.kg-1, respectively, compared to
the untreated soil which presents a reference Cr concentration of about 2.4 mg.kg-1. The same
effect of soil amendments can be observed when the DOC value increased to 34 mg.l-1 (Fig. 3
right-hand column). If we compare the right and left columns of Figure 3, we can see that the
increase in DOC concentration from 14 to 34 mg.l-1 in the soil slightly increased the availability
of Cr to plants in the treated (CPM, DL, DLX CPM) and UNT soils by 0.3, 0.2, 0.2, 0.4
mg.kg1,respectively.
Barcelona and Holm (1991), Pantsar-Kallio et al. (2001) and Seaman et al. (2001)
reported that oxidation and reduction reactions are important in the fate, transport, and toxicity
of Cr in the soil. These reactions are governed by many factors including organic matter, pH,
aeration, soil moisture content, wetting and drying, microbial activity, the content in clay
minerals and availability of electron donors and acceptors. Moreover, the amendments added to
the soil have the capacity to change the Cr from Cr(VI), which has a high mobility and toxicity
and facilitates leaching, to Cr(III), which is relatively insoluble and resistant to leaching (James
et al., 1997). Fendorf (1995) also reported that the reduction of Cr in soils is accelerated by the
presence of organic matter and divalent iron. If Cr in the soil is converted to trivalent oxide or
co-precipitated with Fe hydrous oxide or organic matter, it is likely to remain stable for a long
time. Our results agree with those of Hsu et al. (2000), who reported that the high affinity of
metals for CPM had two-sided consequences. The first is that in the presence of DOC the
mobility of trace elements increases by forming complexes with the humic acid and fulvic acid,
26 molecular weight organic acids can retain significant concentrations of trace metals in soil upon
soil acidification, thus decreasing their mobility (Chirenje et al., 1999).
The concurrent effect of the three studied factors can be observed clearly in the soil
treated with CPM (Fig. 3- right-hand column), where it can be seen that the increase in the
DOC value (34 mg.l-1) led to an increase in the Cr availability to the plant from 1.2-1.4 mg.kg-1
in the case of DOC=34 mg.l-1compared to soil treated with CPM containing less DOC (14 mg.l
-1
) where it decreased from 1.2 to 0.8 mg.kg-1. The increase in pH leads to a slight decrease in
Cr concentration in plants, whereas the decrease in EC leads to a strong increase in Cr
concentration in the BL from 0.2 at EC=1100 mg.kg-1 to1.3 at EC=800 mg.kg-1 in the case of
DOC=34 mg.l-1. This result can be explained by the fact that in the case of anions (Cr(VI)), the
decrease in pH promotes the release of HO-ions. This then leads to a decrease in competition
between anions and HO-ions, which then accelerates the formation of new phases. Thus, the
solubility of Cr anions decreases when pH decreases. Dzombak and Morel (1990) reported that
when soil pH increases, the mobility of metals decreases, thereby decreasing the uptake of Cr
by living species as in the case of soil treated with DL, CPM at DOC=14 mg.l-1. Another
important factor that has a major effect on the bioavailability of Cr is EC. Increases in chloride,
sulfate, carbonate, bicarbonate, nitrate and phosphate concentrations in solution lead to the
formation of metallic salts, which increase the EC of the soil solution. An increase in salinity is
associated with an increase in the concentration of major elements (Na, K, Ca, Mg), which
compete with trace metals for sorption sites (Tam and Wong, 1999). This is different from our
results where we found that the increase in DOC and pH and decrease in EC lead to an increase
in Cr concentration in plants.
The predicted findings suggest that due to the large variation of Cr concentration in the
BL with different treatments, the best amendment for reducing soil Cr toxicity is the (CPM)
27 (case of DOC=14 mg.l-1) and from 2.8 mg.kg-1 in the untreated soil to 1.2 mg.kg-1 (case of
DOC=34 mg.l-1). These two DOC values result in non-linear Cr variation versus pH and EC.
However, the DL and DLX CPM treatments generated intermediate Cr concentration levels but
with a more stable (linear) variation compared to that of the CPM treatment.
When all the results are considered, it can be seen that the Cr tends to evolve from
non-linear responses for UNT and CPM soils to non-linear responses for DL and DLX CPM soils.
UNT soil generated the highest non-linear variation in Cr concentration, suggesting that the
results are sensitive to pH and EC. Such a variation is reduced, however, with the addition of
CPM and DL or with a combined treatment (DLX CPM). We found that among the
investigated factors, pH and DOC are the most important parameters affecting the Cr
concentration in BL.
However, there are only a limited number of published studies available for describing
the techniques of stabilization of Cr in the soil. Because of the low reactivity of its common
species in soils, even if Cr is added to soil in the mobile form Cr(VI), it can be converted to its
stable form Cr(III). Jop et al. (1987) reported that the dominant species of Cr(V1) at pH > 6.5
is chromium oxide (the case of our soil). As Cr(VI) species are negatively charged, they do not
complex with anionic particulate matter and are more bioavailable. In our experience, we have
noted that the addition of both organic and inorganic amendments to the soil can decreased the
bioavailability of Cr with reference to untreated soil.
3.3. Comparison of MLR and ANN performance
Four MLR experiments were performed, one each of the four soil training data
28 and the soil factors (pH, EC and DOC). The software used for the purpose of statistical
analyses was Statistica 10. These four MLR equations are:
Amendment MLR equations per amendment UNT DOC EC pH BL x e x x Y 2.2550.0623 6.44 4 0.00128 DL DOC EC pH BL x e x x Y 2.9870.113 1.26 3 0.00097 CPM DOC EC pH BL x e x x Y 1.8510.0124 6.67 4 0.00115 DLX CPM DOC EC pH BL x e x x Y 1.9860.0118 6.61 4 0.00101
wherexpH, xECand xDOC denote, respectively, values of pH, EC and DOC.
After determining of these equations, comparison between predictive results of the ANN
and MLR models was performed for the training and test data sets. The obtained coefficients of
correlations among the results (Table 7). This indicates that the results of ANN model are better
than that of MLR models for all amendment cases. Our finding agrees well with those of van
der Zee and van Riemsdijk (1987), Andersen and Christensen (1988), Streck and Richter
(1997), Römkens and Salomons (1998), Tiktak et al. (1998), Schaap and Lei (1998), Elzinga et
al. (1999), Sarmadian and Taghizadeh Mehrjardi (2008).
Table 7. Correlation coefficients obtained by ANN and MLR methods.
Method UNT CPM DL DLX CPM Trainin g data Trainin g data Trainin g data Trainin g data Trainin g data Trainin g data Trainin g data Trainin g data Neural network 0.999 0.998 0.998 0.996 0.998 0.997 0.999 0.995 Linear regressio n 0.876 0.695 0.792 0.702 0.765 0.637 0.882 0.802
29 4. Conclusion
Reducing the concentration of Cr in contaminated soils can be performed by adding soil
amendments. These amendments reduce Cr mobility by promoting the formation of insoluble
precipitates or by enhancing the soil’s capacity to bind Cr to the soil. The latter can be achieved
directly through the addition of adsorbent materials or indirectly by adjusting the soil’s pH–EC
combination to provoke Cr absorption onto the soil. In this preliminary study, three factors
were retained (pH, EC and DOC) in combination with four soil amendments (UNT, CPM, DL
and DLX CPM). The present study confirmed that organic matter (CPM) is one of the best soil
amendments, as it reduced the concentrations of Cr in the BL more than the other amendments.
The interactions of the soil factors in the form of response surfaces were analyzed and
compared to existing published results. This methodology could be effectively used to study the
importance of individual, cumulative and interactive effects of the selected soil inputs in Cr
concentration in bean leaves. The predictive ANN models used to evaluate the Cr concentration
corresponded well with the experimental results reported in the literature. The ANN models
developed here showed that a plausible innovative low-cost strategy for in situ remediation of
Cr contaminated soils using organic and inorganic amendments, modified vegetation, or a
combination of the two approaches. It should be noted that the ANN approach proposed here
does not take into account all the possible factors that may influence soil toxicity. The primary
aim was to illustrate the potential of the ANN method in its ability for rapid and accurate
prediction of soil toxicity. The ANN model can be extended by including additional factors and
their combinations to capture complex Cr behavior.
Overall, the ANN modeling outperforms MLR modeling. The effort required to
calibrate the ANN and MLR models were similar, and both require about the same amount of
30 limitations. First, they are not able to explain the physical relationships between the
input-output data. Secondly, there are no general guidelines for the design of ANN architecture for a
given problem. There is a need for more research to develop such guidelines to enable the
extensive application of ANNs for non-specialists. Nevertheless, ANNs have a number of
significant benefits that make them a powerful, rapid and practical tool for solving many soil
engineering problems. The implementation of ANN modeling for the robust and reliable
prediction of metal concentration in plants using additional soil data such as soil particle size
and moisture levels in a practical sensor system appears very promising. Future significant
work is required to achieve this goal. The results of ANN testing (prediction) allow for the
investigation of the soil factors’ interactions. This methodology could therefore be effectively used to study the importance of individual, cumulative and interactive effects of the soil
parameters. Moreover, the ANN method can be used in conjunction with mechanistic models at
the research level as a method to determine the most important parameters in a design that
could then be used to formulate a mechanistic model and to determine where future research
efforts should be directed.
Acknowledgements
Our work was financially supported by ADEME (Projects PhytoDEMO and CWdemo),
Department of Brownfields and Polluted Sites, Angers, France, the Aquitaine Region Council
(Project Phytorem), Bordeaux, France, and the European Commission under the Seventh
Framework Programme for Research (FP7-KBBE-266124, GREENLAND). The authors would
like to thank the anonymous reviewers for their valuable efforts, comments and suggestions to
31 References
Adriano, D.C., 2001. Trace elements in terrestrial environments; Biochemistry, bioavailability
and risks of metals. Springer-Verlag, New York.
AFNOR NF X 31-147 : (Qualité des sols) : Sols, sédiments – Mise en solution totale par
attaque acide.
Anagu, I., Ingwersen, J., Utermann, J., Streck, T., 2009. Estimation of heavy metal sorption in
German soils using artificial neural networks. Geoderma 152, 104–112.
Andersen, P.R., Christensen, T.H., 1988. Distribution coefficients of Cd, Co, Ni and Zn in
soils. Journal of soil science 39, 15-22.
Baize, D., 1997. Un Point sur Les Teneurs Totales des Eléments Traces Métalliques dans les
Sols, INRA Editions, Paris, France, pp 408.
Baize, D., Tercé, M., 2002. Les Éléments Traces Métalliques dans les Sols – Approches
Fonctionnelles et Spatiales, INRA Éditions, Paris, France. pp 570.
Barcelona, M.J., Holm, T.R., 1991. Oxidation–reduction capacities of aquifer solids.
Environmental science and technology 25, 1565–1571.
Behrens, T., Förster, H., Scholten, T., Steinrüken, U., Spies, E., Goldschmitt, M., 2005. Digital
soil mapping using artificial neural networks. Journal of plant nutrition and soil science
168, 21-33.
Bes, C., Mench, M., 2008. Remediation of copper-contaminated topsoils from a wood
treatment facility using in situ stabilisation. Environmental Pollution 156, 1128-1138.
Bes, C., 2008. Phytoremédiation des sols d’un site de traitement du bois contaminé par le cuivre. Ph.D. Dissertation, Université de Bordeaux1, Talence, France.
32 Bes, C.M., Mench, M., Aulen, M., Gaste, H., Taberly, J., 2010.Spatial variation of plant
communities and shoot Cu concentrations of plant species at a timber treatment site. Plant
Soil 330, 267–80.
Buszewski, B., Kowalkowski, T., 2006. A new model of heavy metal transport in the soil using
non-linear artificial neural networks. Journal of environmental engineering science 23
(4), 589-595.
Chirenje, T., Ma, L.Q., 1999. Effects of acidification on metal mobility in a papermill-ash
amended soil. Journal of Environmental Quality 28, 760–767.
Ciesielski, H., Sterckeman, T., 1997. Determination of exchange capacity and exchangeable
cations in soils by means of cobalt hexamine trichloride. Effects of experimental
conditions, Agronomie 17, 1-7.
Ciesielski, H., Proix, N., Sterckeman, T., 1997. Détermination des incertitudes liées à une
méthode de mise en solution des sols et des sédiments par étude inter laboratoire.
Analusis 25, 6, 188-192.
Davis, R.D., Beckett, P.H.T., Wollan, E., 1978. Critical levels of twenty potentially toxic
elements in young spring barley. Plant Soil 49, 395-408.
Davies, B.E., 1992. Inter-relationships between soil properties and the uptake of cadmium,
copper, lead and zinc from contaminated soils by radish (Raphanus sativus L.). Water,
Air, Soil Pollution 63,331-342.
Du Laing, G., De Vos, Vandecasteele, B., Lesage, E., Tack, F.M.G., Verloo, M.G., 2008.
Effect of salinity on heavy metal mobility and availability in intertidal sediments of the
Scheldt estuary. Estuarine coastal and shelf science 77, 589–602.
Du Laing, G., Van de Moortel, A., Moors, W., De Grauwe, P., Meers, E., Tack, F., Verloo, M.,
2009. Factors affecting metal concentrations in reed plants (Phragmites australis) of
33 Dzombak, D.A., Morel, F.M.M., 1990. Surface Complexation Modeling - Hydrous Ferric
Oxide. John Wiley & Sons (A Wiley-Interscience Publication), pp 393.
Elzinga, E.J., Van Grinsven, J.J.M., Swartjes, F.A., 1999. General purpose Freundlich
isotherms for cadmium, copper and zinc in soils. European Journal of Soil Science 50,
139-149.
Fendorf, S., 1995. Surface reactions of chromium in soils and waters. Geoderma 67, 55-71.
Fischer, K. Removal of heavy metals from soil components and soil by natural chelating
agents. 2000, Part 1: Displacement from clay minerals and peat by cysteine and
L-penicillamine. Water, Air, Soil Pollution 137, 267.
Förstner, U., 1985. Chemicals forms and reactivities of metals in sediments in "chemical
methods for assessing bio-available metals in sludges and soil", Leschber R., Davis R.D.,
L'Hermite P., CEC, Elsevier Applied Science publishers, 1-30.
Gandhimathi, A., Meenambal, T., 2012. Analysis of Heavy Metal for Soil in Coimbatore by
using ANN Model. European Journal of Scientific Research 68, (4), 462-474.
Gough, L.P., Shacklette, H.T., Case, A.A., 1979, Element Concentrations Toxic to Plants,
Animals, and Man, US Geological Survey Bulletin 1466, 80.
Hambli, R., 2009. Statistical damage analysis of extrusion processes using finite element
method and neural networks simulation. Finite Elements in Analysis and Design -45- 10,
640-649.
Hambli, R., Chamekh, A., Bel Hadj Salah, H., 2006. Real-time deformation of structure using
finite element and neural networks in virtual reality applications, Finite Elements in
Analysis and Design 42, (11), 985-991.
Hatje, V., Payne, T.E., Hill, D.M., McOrist, G., Birch, G.F., Szymczak, R., 2003. Kinetics of
trace element uptake and release by particles in estuarine waters: effects of pH, salinity,
34 Haykin, S., 2009. Neural Networks and learning machine (3rd Edition), Pearson, 936 p.
Heijerick, D.G., Janssen, C.R., De Coen, W.M., 2003. The combined effects of hardness, pH
and dissolved organic carbon on the chronic toxicity of Zn to D. magna: development of
a surface response model. Archives of Environmental Contamination and Toxicology 44,
210–217.
Hsu. J.H,. Lo. S.L., 2000. Characterisation and extractability of copper. manganese. and zinc in
swine manure composts. Journal of Environmental industry. Environment pollution 101,
43–48
Jackson, M.L., 1967. Soil Chemical Analysis. Prentice Hall of India Pvt. Ltd., New Delhi, pp
49.
Jackson, B.P., Miller, W.P., 2000. Soil solution chemistry of a fly ash-. poultry litter-. and
sewage sludge-amended soil. Journal of Environmental Quality 29 (2), 430–436.
James, B.R., Petura, J.C., Vitale, R.J., Mussoline, G.R., 1997. Oxidation-reduction chemistry of
chromium: Relevance to the regulation and remediation of chromate contaminant soils.
Journal of soil contamination 6, 569-580.
Jenkins, W.M., 1997. An introduction to neural computing for the structural engineer. Journal
of structural engineering 75 3, 38-41.
Jop, K.M., Parkerton, T.F., Rodgers, J.H.Jr., Dickson, K.L., 1987. Comparative toxicity and
speciation of two hexavelant chromium salts in acute toxicity tests. Journal of
environmental toxicology and chemistry 6, 697-703.
Kabata-Pendias, H., Pendias., 2000. Trace Elements in Soils and Plants. CRC Press, Boca
Raton, Florida, USA.
Kafadar, K., 1994. Choosing among two-dimensional smoothers in practice. Computational
35 Katz, S.A., Salem, H., 1994. The biological and environmental chemistry of chromium. VCH
Publishers, Inc., New York.
Kerndorff, H., Schnitzer, M., 1980. Sorption of metals on humic acids. Geochimica et
Cosmochimica Acta 44,1701.
Kitagishi, K., Yamane, I (Eds.)., 1981. Heavy Metal Pollution in Soils of Japan, Japan
Scientific Societies Press, Tokyo, 107–124.
Kolbas, A., Mench, M., Herzig, R., Nehnevajova, E., Bes, C.M., 2011. Copper phytoextraction
in tandem with oilseed production using commercial cultivars and mutant lines of
sunflower. International Journal of Phytoremediation 13 Suppl 1, 55-76.
Kotas, J., Stasicka, Z., 2000. Commentary: chromium occurrence in the environment and
methods of its speciation. Environmental Pollution, 107, 263– 83.
Kowalski, Z. J., 1994. Treatment of chromic tannery wastes. J Hazard Mater 37: 137-144.
McBratney, A.B., Mendoca Santos, M.L., Minasny, B., 2003. On digital soil mapping.
Geoderma 117, 3-52.
McLean, J.E., Bledsoe, B.E., 1992. Behaviour of metals in soils. Ground water issue,
USEPA, Washington, DC. EPA/540/S-92/018.
Mench, M., Bes, C., 2009. Assessment of ecotoxicity of topsoils from a wood treatment site.
Pedosphere 19,143–155.
Minasny, B., McBratney, A.B., 2002. The neuro-m methods for fitting neural network
parametric pedotransfer functions. Soil Science Society of America Journal 66, 352-361.
Minasny, B., Hopmans, J.W., Harter, T., Eching, S.O., Tuli, A., Denton, M.A., 2004. Neural
networks prediction of soil hydraulic functions for alluvial soils using multistep outflow
data. Soil Science Society of America Journal 68, 417—429.
Murti, K., Viswanathan, C.R., Puspa., 1989. Toxic Metals in the Indian environment and its
36 Pantsar-Kallio, M., Reinikainen, S.P., Oksanen, M., 2001. Interactions of soil components and
their effects on speciation of chromium in soils. Analytica Chimica Acta 439, 9–17.
Rafiq, M.Y., Bugmann G., Easterbrook, D. J., 2001. Neural network design for engineering
applications. Computers & Structures, 79, (17), 1541-1552.
Reinds, G.J., Bril, J., De Vries, W., Groenenberg, J.E., Breeuwsma, A., 1995. Critical loads and
excess loads of cadmium, copper and lead for European forest soils. DLO Winand
Staring Centre Report 96, Wageningen, the Netherlands.
Ruggiero, M.A., 1997. Cybernetic Trading Strategies, John Wiley &Sons, 336 pages ISBN
0471149209.
Römkens, P.F.A.M., Salomons, W., 1998. Cd, Cu and Zn solubility in arable and forest soils:
consequences of land use changes for metal mobility and risk assessment. Soil Science
163, 859-871.
Sarmadian, F., Taghizadeh Mehrjardi, R., 2008. Modeling of Some Soil Properties Using
Artificial Neural Network and Multivariate Regression in Gorgan Province, North of
Iran, Global Journal of Environmental Research 2 (1), 30-35.
Sauerbeck, D. R., Hein, A., 1991. The nickel uptake from different soils and its prediction by
chemical extractions. Water Air Soil Pollution 57-58, 861-871.
Schaap, M.G., Leij, F.J., 1998. Using neural networks to predict soil water retention and soil
hydraulic conductivity. Soil and Tillage Research 47, 37-42.
Schaap, M.G., Leij, F.J., van Genuchten, M.T., 1998. Neural networks analysis for hierarchical
prediction of soil hydraulic properties. Soil Science Society of America Journal 62,
847—855.
Schug, B., Düring, R.A., Gäth, S., 2000. Improved cadmium sorption isotherms by the
determination of initial contents using the radioisotope 109 Cd. Journal of plant nutrition
37 Seaman, J.C., Arey, J.S., Bertsch, P.M., 2001. Immobilization of nickel and other metals in
contaminated sediments by hydroxyapatite addition. Journal of Environmental Quality 30
(2), 460– 469.
Smith. S. R., 1994. Effect of soil pH on availability to crops of metals in sewage sludge-treated
soils. 1. Nickel, copper and zinc uptake and toxicity to ryegrass. Journal of environmental
pollution 85, 321-327.
Soon, Y. K., Bates, T. E., 1982. Chemical pools of Cd, Ni and Zn in polluted soils and some
preliminary indications of their availability to plants. Soil Science 33, 477-88.
Streck, T., Richter, J., 1997. Heavy metal displacement in a sandy soil at the field scale: I.
Measurements and parameterization of sorption. J. Environ. Qual 26, 49—56.
Tam, NFY., Wong, YS., 1999. Mangrove soils in removing pollutants from municipal
wastewater of different salinities. Journal of environmental quality 28, 556-564.
Tiktak, A., Alkemade, J.R.M., Van Grinsven, J.J.M., Makaske, G.B., 1998. Modeling cadmium
accumulation at a regional scale in the Netherlands. Nutr, Cycl. Agroecosys. 50, 209-222.
Van der Zee, S.E.A.T.M., van Riemsdijk,W.H., 1987. Transport of reactive solute in spatially
variable soil systems. Journal of water resource research 23, 2059-2069.
Velleman, P. F., 1980. Definition and comparison of robust nonlinear data smoothing
algorithms', Journal of the American Statistical Association, 75, 609-615.
Vogeler, I., Green, S.R.., Clothier, B.E., Kirkham, M.B., Robinson, B.H., 2001. Contaminant
transport in the root zone. in Trace Elements in Soil: Bioavailability, Flux and Transfer.
I.K. Iskandar and M.B. Kirkham, Eds. Lewis Publishers. Boca Raton, FL, chap. 9.
Weng, L.P., Temminghoff, E.J., Lofts, S., Tipping, E., Van Riemsdijk, W.H., 2002.
Complexation with dissolved organic matter and solubility control of heavy metals in a
38 Wetterhahn, K. E., Hamilton, J.W., 1989. Molecular basis of hexavalent chromium
carcinogenicity: Effect on gene expression. Science of The Total Environment, 86, (1–2),
39
Figures
Figure1. a) Location of studied sites from A to E. The arrows indicate the studied site P3 (adapted from Mench and Bes, 2009)- b) The two plots of soil with the different types of amendment (adapted from Bes, 2008).
40 Figure 2. Neural network architecture composed of four input layers, two hidden layers and one
output layer. Inputs Output Soil treatment pH EC (µS.cm-1) Cr concentration in the bean leaves (mg.kg-1) DOC (mg.l-1)
41 DOC= 14 mg.l-1 DOC= 34 mg.l-1 Soil (UNT) Soil (CPM) Soil (DL) Soil (DLX CPM)
42 Figure 3. Chromium concentration in BL in mg.kg-1: effects of soil pH and EC for two different
43
The tables
Table 1. Main characteristics of site P3 (0-0.25 m soil layer).
Parameters Site P3 Background values in French sandy soilsa
Sand % 83.5 ± 1.1 Silt % 11.5 ± 0.9 Clay % 3.8 ± 1.2 C/N 17.2 OM (g.kg-1) 15.9 CEC (cmol+.kg-1) 3.49 Organic C (g.kg-1) 9.19 total N (g. kg-1) 0.534 pH 7.0 ± 0.23 As (mg.kg-1) 9.8 1.0-25b Co (mg.kg-1) 2 1.4-6.8 Cu (mg.kg-1) 674 ± 126 3.2-4.8 Cr (mg.kg-1) 23 14.1-40.2 Mn (mg.kg-1) 181 72-376 Ni (mg.kg-1) 5 4.2-14.5 Zn (mg.kg-1) 46 17-48 a
median and high vibrissae values except for As (Baize., 1997; Baize and Tercé, 2002). b common As mean values for all
44 Table 2. The experimental values (pH, EC, DOC and Cr). Four replications were performed for each measurement generating 64 testing results (4 soils
4 amendments
4 replicates) allowing for the determination of the mean values, standard deviations (SD) and coefficient of variations (COV).Soil
reference Amendments Mean pH SD-COV (%)
Mean EC (µS.cm-1) SD-COV (%) Mean DOC (mg.l-1) SD-COV (%) Mean Cr concentration in the soil (mg.kg-1) SD-COV (%) B1-1 UNT 7.12 NS 0.15-2.08% 1114 NS 214.7-18.31% 15.93* 4.01-7.75% 15.97** 0.98-6.30% B2-8 UNT 7.31 NS 1230 NS 14.34* 16.21** B3-15 UNT 7.28 NS 917 NS 21.74* 15.81** B4-10 UNT 6.99 NS 1430 NS 24.32* 14.07** B1-2 CPM 6.98 NS 0.27-3.67% 1018 NS 122-14.24% 27.08* 4.50-5.44% 14.67** 0.34-2.31% B2-5 CPM 7.60 NS 884 NS 20.64* 15.03** B3-16 CPM 7.46 NS 771 NS 25.85* 15.15** B4-11 CPM 7.26 NS 754 NS 33.99* 14.40** B1-4 DL 7.49 NS 0.14-1.87% 1654 NS 308.3-24.79% 26.34* 4.14-6.96% 17.16** 0.11-0.66% B2-7 DL 7.67 NS 1000 NS 25.76* 16.98** B3-14 DL 7.43 NS 1013 NS 26.52* 17.13** B4-9 DL 7.34 NS 1308 NS 38.46* 16.93** B1-3 DLX CPM 7.45 NS 0.32-4.46% 1192 NS 152.2-11.90% 33.12* 2.50-7.02% 16.09** 0.2-1.27% B2-6 DLX CPM 7.00 NS 1347 NS 34.26* 15.91** B3-13 DLX CPM 7.07 NS 1457 NS 29.16* 15.93** B4-12 DLX CPM 7.59 NS 1119 NS 29.75* 16.35**