HAL Id: insu-02916805
https://hal-insu.archives-ouvertes.fr/insu-02916805
Submitted on 18 Aug 2020
HAL is a multi-disciplinary open access
archive for the deposit and dissemination of
sci-entific research documents, whether they are
pub-lished or not. The documents may come from
teaching and research institutions in France or
abroad, or from public or private research centers.
L’archive ouverte pluridisciplinaire HAL, est
destinée au dépôt et à la diffusion de documents
scientifiques de niveau recherche, publiés ou non,
émanant des établissements d’enseignement et de
recherche français ou étrangers, des laboratoires
publics ou privés.
the Middle Eocene Climatic Optimum at tropical ODP
Site 865 in the Pacific Ocean
Kirsty Edgar, Steven Bohaty, Helen Coxall, Paul Bown, Sietske Batenburg,
Caroline Lear, Paul Pearson
To cite this version:
Kirsty Edgar, Steven Bohaty, Helen Coxall, Paul Bown, Sietske Batenburg, et al.. New composite
bio-and isotope stratigraphies spanning the Middle Eocene Climatic Optimum at tropical ODP Site
865 in the Pacific Ocean. Journal of Micropalaeontology, Geological Society, 2020, 39 (2), pp.117
-138. �10.5194/jm-39-117-2020�. �insu-02916805�
https://doi.org/10.5194/jm-39-117-2020
© Author(s) 2020. This work is distributed under the Creative Commons Attribution 4.0 License.
New composite bio- and isotope stratigraphies
spanning the Middle Eocene Climatic Optimum at
tropical ODP Site 865 in the Pacific Ocean
Kirsty M. Edgar1,2, Steven M. Bohaty3, Helen K. Coxall4, Paul R. Bown5, Sietske J. Batenburg6,
Caroline H. Lear1, and Paul N. Pearson1
1School of Earth and Ocean Sciences, Cardiff University, Cardiff, CF10 3AT, UK
2School of Geography, Earth and Environmental Sciences, University of Birmingham, B15 2TT, UK 3Ocean and Earth Science, National Oceanography Centre Southampton,
University of Southampton, SO14 3ZH, UK
4Department of Geological Sciences, Stockholm University, 106 91, Stockholm, Sweden 5Department of Earth Sciences, University College London, London, WC1E 6BT, UK
6Géosciences Rennes, UMR 6118, CNRS, University of Rennes, Rennes, France Correspondence:Kirsty M. Edgar ([email protected])
Received: 11 February 2020 – Revised: 9 June 2020 – Accepted: 11 June 2020 – Published: 27 July 2020
Abstract. The Middle Eocene Climatic Optimum (MECO) at ca. 40 Ma is one of the largest of the transient Eocene global warming events. However, it is relatively poorly known from tropical settings since few sites span the entirety of the MECO event and/or host calcareous microfossils, which are the dominant proxy carrier for palaeoceanographic reconstructions. Ocean Drilling Program (ODP) Pacific Ocean Site 865 in the low-latitude North Pacific (Allison Guyot) has the potential to provide a useful tropical MECO reference, but detailed strati-graphic and chronological constraints needed to evaluate its completeness were previously lacking. We have addressed this deficit by generating new high-resolution biostratigraphic, stable isotope, and X-ray fluorescence (XRF) records spanning the MECO interval ( ∼ 38.0–43.0 Ma) in two holes drilled at Site 865. XRF-derived strontium / calcium (Sr/Ca) and barium / strontium (Ba/Sr) ratios and Fe count records allow correlation be-tween holes and reveal pronounced rhythmicity, enabling us to develop the first composite section for Holes 865B and 865C and a preliminary cyclostratigraphy for the MECO. Using this new framework, the sedimen-tary record is interpreted to be continuous across the event, as identified by a pronounced transient benthic foraminiferal δ18O shift of ∼ 0.8 ‰. Calcareous microfossil biostratigraphic events from widely used zonation schemes are recognized, with generally good agreement between the two holes, highlighting the robustness of the new composite section and allowing us to identify planktic foraminiferal Zones E10–E15 and calcareous nannofossil Zones NP15–18. However, discrepancies in the relative position and ordering of several primary and secondary bioevents with respect to published schemes are noted. Specifically, the stratigraphic highest occur-rences of planktic foraminifera, Acarinina bullbrooki, Guembelitrioides nuttalli, and Morozovella aragonensis, and calcareous nannofossils, Chiasmolithus solitus and Sphenolithus furcatolithoides, and the lowest occurrence of Reticulofenestra reticulata all appear higher in the section than would be predicted relative to other bioevents. We also note conspicuous reworking of older microfossils (from planktic foraminiferal Zones E5–E9 and E13) into younger sediments (planktic foraminiferal Zones E14–15) within our study interval consistent with rework-ing above the MECO interval. Regardless of reworkrework-ing, the high-quality XRF records enable decimetre-scale correlation between holes and highlight the potential of Site 865 for constraining tropical environmental and bi-otic changes, not just across the MECO but also throughout the Palaeocene and early-to-middle Eocene interval.
1 Introduction
The transition from peak Eocene “greenhouse” conditions at ∼49–53 Ma to the onset of the icehouse at ∼ 34 Ma is punc-tuated by a number of transient climate events (e.g. Zachos et al., 2008; Bohaty et al., 2009; Edgar et al., 2007; Sexton et al., 2011; Hollis et al., 2019; Westerhold et al., 2018b). The most pronounced of these is the MECO event at ∼ 40 Ma that represents a temporary reversal in the long-term Eocene global cooling trend (Bohaty and Zachos, 2003; Bohaty et al., 2009). The MECO event is characterized by ocean warm-ing of ∼ 3–6◦C (Bijl et al., 2010; Bohaty et al., 2009; Bos-colo Galazzo et al., 2014; Edgar et al., 2010; Cramwinckel et al., 2018; Rivero-Cuesta et al., 2019), ocean acidification evidenced by > 1 km shoaling of the Pacific calcite com-pensation depth (CCD), and shifts in the global carbon cy-cle including a rise in atmospheric carbon dioxide concen-trations (Bohaty et al., 2009; Pälike et al., 2012; Henehan et al., 2020; Bijl et al., 2010). Marine biotic responses vary across the event, impacting floral and faunal composition, body size, and ecology in the deep and surface ocean globally (e.g. Edgar et al., 2013; Witkowski et al., 2014; Möbius et al., 2015; Boscolo Galazzo et al., 2015; Luciani et al., 2010; Cramwinckel et al., 2019; Arreguín-Rodríguez et al., 2016).
The MECO is well known from mid- and high-latitude sites (e.g. ODP Sites 689, 690, 702, 748, 738, 1051, 1172 and 1263; Alum Bay in the UK; the Baskil section in Turkey; and the Alano, Contessa Highway, and Monte Cagnero sections in Italy), many of which also are characterized by good strati-graphic age control, comprehensive isotope stratigraphies, and carbonate-rich sediments yielding microfossils useful for proxy reconstructions (Edgar et al., 2010; Bohaty et al., 2009; Bohaty and Zachos, 2003; Bijl et al., 2010; Boscolo Galazzo et al., 2014; Spofforth et al., 2010; Jovane et al., 2007; Savian et al., 2013; Rivero-Cuesta et al., 2019; Daw-ber et al., 2011; Giorgioni et al., 2019). However, we cur-rently lack a low-latitude site that unambiguously spans the pre-MECO, MECO, and post-MECO intervals and has con-tinuous carbonate sedimentation uninterrupted by CCD or lysocline shoaling, thus recording environmental and biotic responses in the tropics.
Of the sites that do exist, ODP Site 1260 in the equato-rial Atlantic has a high-resolution stable isotope stratigra-phy that has been placed onto an astronomically tuned age model (Edgar et al., 2010; Westerhold and Röhl, 2013). How-ever, interpretation of the MECO at this site is complicated by the lack of a clear return to higher δ18O values follow-ing the event and a hiatus which truncates the upper portion of the record (Edgar et al., 2010; Shipboard Scientific Party, 2004; Westerhold and Röhl, 2013). ODP Site 1218 and IODP Site U1333 in the equatorial Pacific Ocean both have good age control with comprehensive magnetic stratigraphies and astronomically tuned age models across the whole of the MECO interval (Westerhold et al., 2014; Expedition 320/321 Scientists, 2010), but their relatively deep palaeo-water depth
(> 3.3 km), coupled with a relatively shallow Pacific CCD in the middle Eocene, resulted in little or no carbonate preserva-tion across the peak of the event, preventing detecpreserva-tion of its true magnitude (Expedition 320/321 Scientists, 2010; West-erhold et al., 2014; Pälike et al., 2012; Toffanin et al., 2013). Furthermore, no planktic foraminifera are present across the entire MECO interval at Site U1333 to constrain surface-water conditions (Expedition 320/321 Scientists, 2010). Sim-ilarly, at shallower ODP Site 1209 (∼ 2 km palaeo-water depth) in the subtropical North Pacific Ocean (Dutton et al., 2005) the interval containing the MECO has poor carbonate microfossil preservation, very low sedimentation rates, and thus, poor age control (Dawber and Tripati, 2011; Shipboard Scientific Party, 2002). ODP Site 711, in the tropical Indian Ocean has no carbonate preservation across the peak and initial post-MECO intervals (∼ 3.5 km palaeo-water depth) (Savian et al., 2016; Peterson and Backman, 1990; Bohaty et al., 2009). Nearby ODP Site 709 has a much shallower palaeo-water depth of 2.2 km and moderate carbonate preser-vation, but the MECO is absent (Bohaty et al., 2009; Pe-terson and Backman, 1990). Finally, sediments from ODP Site 959 in the eastern equatorial Atlantic span the MECO but are organic-rich, poor in carbonate microfossils (planktic foraminifera are absent), and lack a robust magnetic stratig-raphy (Cramwinckel et al., 2018).
Equatorial Pacific ODP Site 865 is an older site that has been rather neglected in Eocene palaeoceanographic stud-ies. Drilled on Allison Guyot in 1992 on ODP Leg 143, the recovered cores sample a pelagic sediment drape (∼ 200 m thick at the centre of the guyot and ∼ 140 m at Site 865, which was drilled off-centre) that accumulated during the Palaeogene and early Neogene. The recovered sediments at the site are comprised of a succession of Palaeocene to Miocene foraminiferal-nannofossil ooze and foraminiferal sands (Shipboard Scientific Party, 1993b). The relatively shallow palaeo-water depths (< 2 km) on the guyot top max-imizes the preservation potential of carbonate microfossils, thus avoiding problems of CCD and lysocline shoaling en-countered elsewhere at deeper sites in the Pacific (e.g. IODP Site U1333). Several Palaeogene-focused studies have high-lighted the potential of this site for palaeoceanographic and evolutionary studies (Bralower et al., 1995; Tripati et al., 2003; Pearson and Ezard, 2014; Coxall et al., 2000; Pearson and Palmer, 2000; Edgar et al., 2015; Arreguín-Rodríguez et al., 2016; Norris and Nishi, 2001), but most of the high-temporal-resolution work has focused on the Palaeocene– Eocene Thermal Maximum (PETM) (Kozdon et al., 2011, 2013; Kelly et al., 1996; Tripati and Elderfield, 2004) since ODP Site 865 is one of the few open ocean sites with carbon-ate present throughout the event.
Middle Eocene sediments at Site 865 have not received much attention for palaeoceanographic studies, in large part because of (1) poor quality of shipboard physical prop-erty records preventing the development of a composite sec-tion necessary to develop continuous stratigraphic secsec-tions;
(2) the lack of magnetic reversal or cyclostratigraphy for age control; and (3) evidence for reworking of older cal-careous microfossils into younger sediments, e.g. across the PETM onset and in the upper portions of the sediment col-umn (Shipboard Scientific Party, 1993b; Bralower and Mut-terlose, 1995; Kelly et al., 1998). Reworking and winnow-ing of sediment is an acknowledged problem of guyot-top sites where ocean currents can be locally intensified by the topography (Pearson, 1995). However, evolutionary studies have demonstrated that the calcareous microfossils (calcare-ous nannofossils and planktic and benthic foraminifera) are diverse and abundant, albeit recrystallized (Pearson et al., 2001; Sexton et al., 2006; Edgar et al., 2015; Arreguín-Rodríguez et al., 2016; Bralower and Mutterlose, 1995) and in the case of planktic foraminifera, provide an apparently complete sequence of tropical Palaeogene biomarkers and their lineage evolution (Norris and Nishi, 2001; Pearson and Ezard, 2014; Coxall et al., 2000). Importantly, existing bios-tratigraphic assessments for Holes 865B and 865C identify planktic foraminiferal Zone E12, defined by the total range of Orbulinoides beckmanni and spanning the MECO inter-val (Berggren and Pearson, 2005), and calcareous nannofos-sil Zone CN15/NP16 (Martini, 1971; Agnini et al., 2014), al-though there are large (∼ 1 m) recovery gaps between cores (Shipboard Scientific Party, 1993b; Bralower and Mutterlose, 1995; Pearson and Ezard, 2014). Core photos indicate the presence of carbonate-rich sediments throughout the entire middle Eocene interval of interest (i.e. there is no evidence of a clay horizon) providing a promising target for geochemical and plankton assemblage work (Shipboard Scientific Party, 1993b; Edgar et al., 2015; Pearson and Palmer, 2000).
Here we take the first step towards developing the ODP Site 865 MECO sequence as a palaeoceanographic reference by adding new datasets that allow development of a com-posite splice and a detailed chronostratigraphy for the site. This involves integration of high-resolution X-ray fluores-cence (XRF) core scanning, benthic foraminiferal stable iso-tope (δ13C and δ18O), and planktic foraminiferal and calcare-ous nannofossil biostratigraphic data across the MECO inter-val at the site. These data are combined with published cal-careous nannofossil datums (Bralower and Mutterlose, 1995) to (1) generate the first composite sedimentary section across the middle Eocene interval of Site 865, (2) identify and con-strain the isotopic character of the MECO in the Pacific Ocean, and (3) determine the position of key biostratigraphic datums relative to the MECO event.
2 Materials and methods
2.1 Regional setting
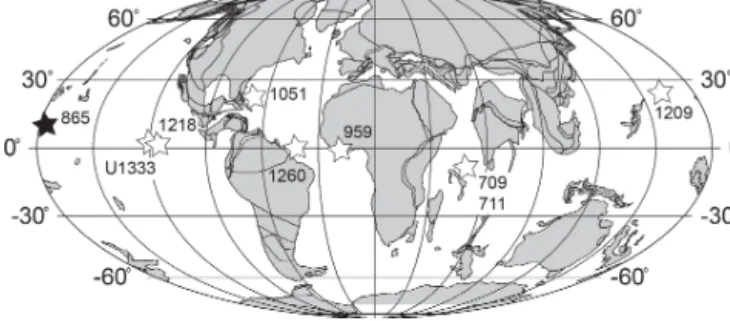
ODP Site 865 was drilled during ODP Leg 143 and is lo-cated on Allison Guyot in the western North Pacific Ocean at 18◦26.4100N, 179◦33.3390W and a modern water depth of 1516 m (Shipboard Scientific Party, 1993b; Fig. 1). This
Figure 1.Location map for ODP Site 865 (solid star) and other low-latitude sites discussed in the main text (open stars) on a 40 Ma reconstruction. Palaeolatitudes for each site are calculated from van Hinsbergen et al. (2015). Base map generated from http: //www.odsn.de (last access: 8 June 2018).
guyot is just one of a number of similar flat-topped vol-canic seamounts in the region formed during the Cretaceous (e.g. Resolution and W¯odejebato guyots), which stand up to several kilometres above the surrounding abyssal (> 4 km) seafloor (Shipboard Scientific Party, 1993a; Matthews et al., 1974). Three holes were drilled at Site 865 (A–C) with mid-dle Eocene sediments only recovered in Holes B and C, which were cored with the aim of creating a continuous record of this interval. The middle Eocene sequence at Site 865 is positioned at shallow burial depths (< 100 m) with no significant Quaternary cover. The foraminiferal nannofos-sil ooze and foraminiferal sands were deposited at ∼ 1300– 1500 m palaeo-water depth based on benthic foraminiferal assemblages (Shipboard Scientific Party, 1993b) in a fully pelagic ocean gyre setting characterized by year-round ther-mal stratification (Pearson et al., 2001).
2.2 X-Ray fluorescence (XRF) scanning
XRF data are routinely employed for stratigraphic correla-tion and the construccorrela-tion of high-resolucorrela-tion composite depth scales because of their higher signal-to-noise ratio and more consistent hole-to-hole character than shipboard physical property measurements (Röhl and Abrams, 2000). Prior to XRF analysis, the top ∼ 0.5 cm of the split section surface of the archive halves was scraped off with a glass slide. This revealed bioturbation structures, indicating that this interval did not have significant coring disturbance (Fig. S1 in the Supplement), as might be expected from the foraminifera-ooze lithologies and the massive appearance of the unpre-pared cores. Using an Avaatech XRF scanner with a Can-berra X-PIPS SDD, Model SXD-150-500 X-ray detector, a suite of elemental (including Fe, Ca, Sr, and Ba) intensity data were collected every 2 cm down-core with a constant spot size (cross-core slot = 12 mm; down-core slit = 10 mm) using a 6 or 10 s count time at 30 and 50 kV, respectively, on the split surface of the archive half of each section using the TAMU ODASES XRF scanner at the
Interna-tional Ocean Discovery Program (IODP) Gulf Coast Core Repository. We measured the elemental composition of sedi-ments that encompass planktic foraminiferal Zone E12 from ODP Cores 865B-4H and -5H (27.52–44.58 metres below seafloor, m b.s.f.) and Sections 865C-4H-1 to 6H-2 (22.30– 42.80 m b.s.f.) in order to capture overlapping sections and construct a composite splice. We primarily used Sr/Ca and Ba/Sr ratios determined from the 50 kV scans for splicing purposes. These are unconventional ratios for hole-to-hole correlation, but the low detrital component of the Site 865 sediments necessitated the use of high-intensity elements as-sociated with the carbonate and biogenic barite fractions (Ca, Sr, and Ba) for detailed correlation. All XRF elemental data are reported in Table S1 in the Supplement.
2.3 Cyclostratigraphy
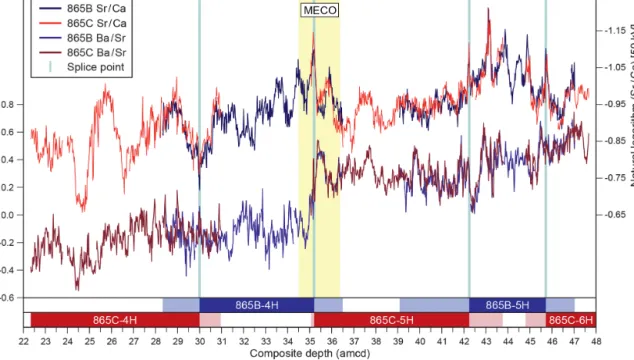
To investigate if astronomical forcing drove patterns in the elemental data records, the Fe intensity data, measured at 30 kV, and the natural logarithm of the Sr/Ca ratio, ln(Sr/Ca), measured at 50 kV, were subjected to time se-ries analyses. The Fe intensity data were selected to allow comparison with published datasets (Westerhold and Röhl, 2013), and the ln(Sr/Ca) record was selected for its low signal-to-noise ratio (see Sect. 3.1). The records were evenly sampled and periodicities larger than 7 m were removed in the program AnalySeries (Paillard et al., 1996). Spectral anal-yses were performed with Redfit 3.8 (Schulz and Mudelsee, 2002) using a Welch window. The behaviour of periodicities over the length of the dataset was investigated by evolutive harmonic analysis with the astrochron package in R (Meyers, 2014), using window lengths of 5.5 m for ln(Sr/Ca) and 6 m for Fe intensity. The Fe record displays a stronger imprint of short-term (< 1 m) variability than the ln(Sr/Ca) record. To test whether the observed cycle hierarchy in the Fe record can be confidently linked to an orbital origin, the interval with most persistent periodicities as identified in the evolu-tive spectrum, between 32.5 and 44.5 “adjusted” metres com-posite depth (amcd; see below), was investigated with the av-erage spectral misfit (ASM) method in astrochron (Meyers, 2014). Bandpass filters were applied to the datasets centred at periodicities of 1.9 and 50 cm with broad bandwidths of 1/3 of the centre frequency. The ln(Sr/Ca) record displays a stronger imprint of longer (> 1 m) periodicities than the Fe record, with minima in the 1.9 m bandpass filter of ln(Sr/Ca) generally coinciding with maxima in the 1.9 m bandpass fil-ter of Fe. High Fe intensities generally coincide with infil-ter- inter-vals of higher variability in the Fe record, which are likely controlled by a larger amplitude of variation in the orbital forcing parameters during eccentricity maxima. In concor-dance with the approach of Westerhold and Röhl (2013), we consider eccentricity maxima to coincide with maxima in the Fe record and, therefore, minima in the ln(Sr/Ca) record. A tentative orbital tuning was established by (i) anchoring the maximum in the 1.9 m bandpass filter of ln(Sr/Ca) to the
405 kyr eccentricity minimum at 40.5 Ma in the La2011 ec-centricity solution (Laskar et al., 2011) and (ii) connecting consecutive maxima in the 1.9 m bandpass filter of ln(Sr/Ca) to 405 kyr eccentricity minima. Astronomical tie points are presented in Table S2, and resulting sedimentation rate esti-mates are in Fig. S2.
2.4 Planktic foraminiferal and calcareous nannofossil biostratigraphy
A planktic foraminiferal biostratigraphic scheme, with ap-proximately one sample per core section (every ∼ 1.5 m), was previously presented for the middle Eocene of ODP Site 865 (presented in fig. 1 of Pearson and Ezard, 2014). Further analysis of the same sample set, supplemented by new samples available at 10 cm spacing (as neces-sary) between Sections 865B-4H-3 and -5H-2, (∼ 31.20– 39.98 m b.s.f.) and between Sections 865C-4H-1 and -6H-2 (∼ 22.35–44.05 m b.s.f.), provided the opportunity to test and refine existing datums. Higher-resolution biostratigraphic analysis also afforded the opportunity to build on previous work to capture both primary bioevents defining planktic foraminiferal zones and key secondary datums as defined by Berggren and Pearson (2005) and Wade et al. (2011). Plank-tic foraminiferal taxonomy follows Pearson et al. (2006), and species range charts are presented in Tables S3 and S4. Rep-resentative specimens of selected biostratigraphically impor-tant planktic foraminifera were imaged either under reflected light or using scanning electron microscopy (SEM). Spec-imens were gold coated prior to SEM analysis, which was conducted on a Philips XL-30 Environmental SEM at the University of Birmingham.
We also define calcareous nannofossil datums (from Mar-tini, 1971; Agnini et al., 2014) based on semi-quantitative counts by Bralower and Mutterlose (1995) at one sample per core section, supplemented with new nannofossil data based on analysis of an additional 20 samples from Sections 865B-4H-3 to -5H-1 and Sections 865C-4H-5 to -5H-5 (Tables S5 and S6). New calcareous nannofossil data are derived from variable sampling intervals as they were selected to test and refine the published datum events occurring within the fo-cal sampling interval of this study. Calcareous nannofossils were analysed using simple smear slides and standard light microscope techniques (Bown and Young, 1998). Data were collected semi-quantitatively using a Zeiss Axiophot pho-tomicroscope at ×1000 magnification. Species abundance is estimated per field of view (FOV) after viewing at least five slide transects (> 500 FOV), with slides studied for at least 40 min. Species range charts are presented in Tables S5 and S6. Taxonomy typically follows Nannotax (Young et al., 2017).
For defining both planktic foraminiferal and calcareous nannofossil datums, we use Top (T) and Base (B) to describe the highest and lowest occurrences of taxa and Top and Base
common (Tc and Bc) for the highest and lowest common oc-currences, respectively (following Backman et al., 2012).
2.5 Stable carbon and oxygen isotope measurements
Benthic foraminiferal stable isotope (δ13C and δ18O) data were generated from the epifaunal taxon Nuttallides truempyi following the taxonomic concept of Holbourn et al. (2013). Foraminifers were picked from the 250–300 µm sieve size fraction and cleaned by ultrasonication to remove any loose fine material prior to stable isotope analysis. Ben-thic foraminifera used for stable isotope analysis were par-tially recrystallized (with a “frosty” texture) but were not in-filled or heavily overgrown (also see Arreguín-Rodríguez et al., 2016). All stable isotope measurements were determined using a Thermo Scientific DELTA V Advantage mass spec-trometer coupled to a Gas Bench II in the School of Earth and Ocean Sciences at Cardiff University and are reported relative to the Vienna Pee Dee Belemnite (VPDB) standard. External analytical precision for δ13C and δ18O analyses is 0.06 ‰ and 0.07 ‰, respectively. No species–specific cor-rections are applied. Stable isotope data for Holes 865B and 865C are reported in Tables S7 and S8, respectively.
3 Results
3.1 XRF data and composite splice
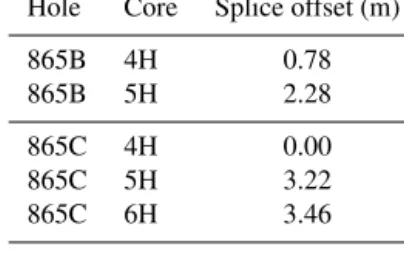
Despite initial concerns about coring disturbance and the lack of clear signals in the shipboard physical property datasets (Shipboard Scientific Party, 1993b), distinct fea-tures and cyclicity are evident in the high-resolution XRF records throughout the study interval aiding correlation be-tween holes (Fig. 2; Table S1). Sr/Ca and Ba/Sr ratios are the most useful parameters for correlation because of the higher signal-to-noise ratio compared to other elemental ratios, e.g. Fe/Sr. For the first time at Site 865 these datasets enabled the identification of several unambiguous tie points between holes and construction of a composite section spanning a ∼25 m interval (Tables 1 and 2). This is the first composite depth scale available for any interval at Site 865. The biggest difference between the new composite depth scale and the shipboard metres below seafloor (m b.s.f.) depth scale is that the core recovery gap between Cores 865C-4H and -5H has increased from ∼ 1 to > 3 m, requiring significant offsets to be applied. In order to maximize the sample material avail-able for study, out-of-splice intervals were also correlated to the in-splice intervals through development of an “adjusted” metres composite depth (amcd) scale (Tables 3 and 4; Fig. 2). This was achieved by aligning clearly identifiable common features in each hole and defining mapping pairs (Tables 3 and 4) by stretching/squeezing of the out-of-splice core seg-ments to match the in-splice intervals (Fig. 2). All interpre-tations below are considered relative to the final composite amcd scale. However, the new amcd scale only applies to the
Table 1.Composite depth offsets within splice for ODP Site 865. Hole Core Splice offset (m)
865B 4H 0.78
865B 5H 2.28
865C 4H 0.00
865C 5H 3.22
865C 6H 3.46
intervals for which XRF data were collected, and thus, some of the bioevents reported within this study fall outside of this interval.
3.2 Cyclostratigraphy
Spectral analysis of the ln(Sr/Ca) record by Redfit displays the most prominent periodicities at 1.9 and 73 cm and addi-tional periodicities at 3.0 m, 2.4 m, 78 cm, and 40 cm above the 95 % confidence level, as well as at 60 cm above the 90 % confidence level (Fig. 3). In the Fe record, periodici-ties above the 95 % confidence level are detected at 6.3 m, 1.9–1.2 m, and 63 cm (Fig. 3), with an additional periodicity of 49 cm above the 80 % confidence level. Evolutive analyses track the behaviour of the ∼ 1.9 m and 40–78 cm periodici-ties over the length of the record, revealing reduced power at depths around 32.5 and 39.5 amcd. ASM analysis of the Fe intensity record from 32.5 to 44.5 m reveals a hierarchy of periodicities likely corresponding to an orbital imprint at a sedimentation rate of 0.46 cm kyr−1 (Fig. S2). This is in close agreement with the average sedimentation rate obtained from tuning to the 405 kyr eccentricity cycle at 0.48 cm kyr−1 on average over the entire record. A sedimentation rate of 0.48 cm kyr−1would translate the periodicity of 1.9 m, which is strongly present in the ln(Sr/Ca) record, to a duration of 406 kyr, which is close to the periodicity of long eccentricity at 405 kyr.
3.3 Planktic foraminiferal biostratigraphy
All of the samples analysed contain abundant recrystallized or “frosty” planktic foraminifera (see Fig. 4 and Edgar et al., 2015, for images of wall cross sections). The assemblages are diverse and typical of tropical middle Eocene low-latitude environments (e.g. Pearson et al., 2006; Berggren and Pear-son, 2005). The dominant genera are Acarinina, Moro-zovelloides, Turborotalia, Globigerinatheka, and Subbotina, with minor but conspicuous contributions from Hantken-ina, Guembelitrioides, GlobanomalHantken-ina, and Pseudohastige-rina. Thus, the (sub)tropical planktic foraminifera zonation scheme of Berggren and Pearson (2005) can easily be applied at this site, and, unusually, a complete sequence of Eocene biomarkers and biozones can be identified. From the pattern of evolutionary bioevents recognized we identify planktic
Figure 2.Sr/Ca and Ba/Sr records derived from XRF core scanning for ODP Holes 865B and 865C on the new adjusted metres composite depth (amcd) scale. Both ratios are calculated from 50 kV scans. Vertical blue lines indicate positions of splice points, and the horizontal bars at bottom of the figure provide a schematic representation of the composite section. Dark shading indicates in-splice intervals of each core, and light shading indicates out-of-splice intervals of each core.
Table 2.Splice tie points for ODP Site 865.
Site, hole, Interval Top of Depth Splice Depth Correlation Site, hole, Interval Top of Depth Splice Depth core, type (cm) section (m b.s.f.) offset (mcd) core, type (cm) section (m b.s.f.) offset (mcd)
section depth (m) section depth (m)
(m b.s.f.) (m b.s.f.) start ⇒ 865C-4H-1 4 22.30 22.34 0.00 22.34 865C-4H-6 20 29.80 30.00 0.00 30.00 tie to 865B-4H-2 22 29.00 29.22 0.78 30.00 865B-4H-5 92 33.50 34.42 0.78 35.20 tie to 865C-5H-1 18 31.80 31.98 3.22 35.20 865C-5H-5 122 37.80 39.02 3.22 42.24 tie to 865B-5H-2 146 38.50 39.96 2.28 42.24 865B-5H-5 44 43.00 43.44 2.28 45.72 tie to 865C-6H-1 96 41.30 42.26 3.46 45.72 865C-6H-2 141 42.80 44.21 3.46 47.67 ⇐end
foraminiferal Zones E10–E15 within the study interval (Ta-ble 5; Figs. 5–6). Images of planktic foraminiferal species of biostratigraphic significance are shown in Fig. 4.
The planktic foraminiferal (and calcareous nannofossils, Sect. 3.4) biostratigraphic data serve two purposes: (i) com-parison of bioevents in Holes 865B and 865C to provide a check on XRF-based hole-to-hole correlations and (ii) criti-cal age control for this site. The relative sequence and depths of planktic foraminiferal datums in Holes 865B and 865C are in relatively good agreement with one another on the new amcd scale, indicating no major misalignments based on the XRF correlations. The Top of Globigerinatheka semiinvo-luta, defining the base of Zone E15, falls in samples outside of the new splice (Table 5), occurring at 20.35 ± 0.10 m b.s.f. in Hole 865B and at 21.57 ± 0.80 m b.s.f. in Hole 865C (and above 22.37 amcd). Small offsets between the two holes
sup-port the minimal composite depth offsets in the uppermost cores (< 0.78 m; Tables 1, 2, and 5; Fig. S2).
Reworking of older into younger material is evident in the upper part of the study section investigated here (above 31 amcd; Fig. 5). Specifically early middle Eocene mate-rial is reworked into middle and late Eocene sediments (Ta-bles S3 and S4). The most noticeable example of this is in the overlapping occurrences of G. semiinvoluta with the large Acarinina(e.g. A. praetopilensis and A. mcgowrani) and Mo-rozovelloides(M. crassatus and M. lehneri), and even Moro-zovella aragonensis(from Zones E5–9) in Sections 865C-4H-1 to -4H-4 and in Sections 865B-3H-5 and -3H-6. For-tunately reworked specimens are relatively easy to discern as they typically have a distinctive brown/orange stain, may contain small flecks of pyrite, and/or are more poorly pre-served, e.g. fragmented. We only find one Plio-Pleistocene
Figure 3.Time series analyses of the ln(Sr/Ca) and Fe intensity data and preliminary orbital tuning. From left to right: the La2011 eccen-tricity solution (dark blue) and its 405 kyr bandpass filter (light blue) and the ln(Sr/Ca) record and the Fe intensity record, flanked by their 1.9 m (black) and 50 cm (grey) bandpass filters and evolutive power spectra, with E1, E2, and E3 indicating the potential imprint of the 405, 125, and 95 kyr components of eccentricity, respectively. The evolutive spectra are topped by Redfit power spectra with dashed lines showing the 99 %, 95 %, 90 %, and 80 % confidence levels and with main periodicities indicated. Horizontal yellow bands indicate the position of the MECO and the C19r event. Horizontal grey dashed lines indicate tentative tuning tie points between the ln(Sr/Ca) bandpass filter and the astronomical solution.
species (Globorotalia tumida) indicative of possible down-hole contamination in Section 865C-4H-1.
Conspicuous reworking has several consequences for the biostratigraphic zonation in the study interval. First, the Top of M. crassatus used to define the base of Zone E14 was not confidently identified here because significant numbers of individuals are present in both Cores 865B-3H and 865C-3H. Thus, the Base of G. semiinvoluta, which is calibrated to the same age as the Top of M. crassatus was instead used to approximate the base of Zone E14 (27.82 ± 0.10 m b.s.f. in Hole 865B and 26.34 ± 0.07 amcd in Hole 865C; Table 5). The slight difference between the two horizons may reflect the relative rarity of G. semiinvoluta and difficulty in
distin-guishing this taxon from its immediate ancestor Globigeri-natheka mexicanaat the base of its range (Premoli Silva et al., 2006) and/or that Core 865B-3H falls outside of the new amcd scale. In contrast, the Top of O. beckmanni is an eas-ily identifiable datum that defines the base of Zone E13 and is well constrained in Hole 865B (32.14 ± 0.06 amcd; Ta-ble 5). This datum, however, falls in the core gap between Cores 865C-4H and -5H, and hence there is a large depth uncertainty for this datum in Hole 865C (33.00 ± 2.10 amcd in Hole 865C; Table 5; Fig. 5). The Base of O. beckmanni, used to define the base of Zone E12, is more difficult to determine because there is a continuous chronocline from its immediate ancestor Globigerinatheka euganea, and thus,
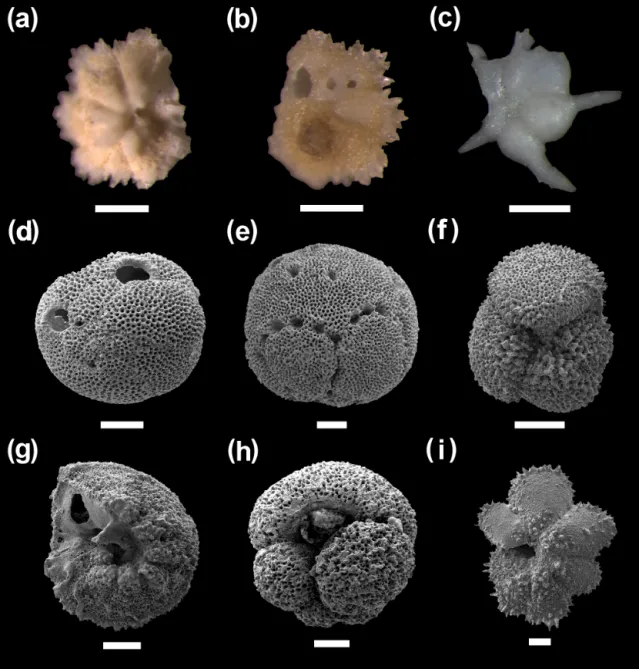
Figure 4. Scanning electron and light microscope images of biostratigraphically important taxa at ODP Site 865. (a, b) Sample ODP Hole 865C-4H-2, 25–27 cm, Morozovelloides lehneri – reworked specimens with distinctive brown/orange discolouration. (c) Sample ODP Hole 865B-6H-1, 73–75 cm, Hantkenina australis. (d) Sample ODP Hole 865C-4H-2, 85–87 cm, Globigerinatheka semiinvoluta, broken final chamber. (e) Sample ODP Hole 865C-5H-1, 5–7 cm, Orbulinoides beckmanni. (f) Sample ODP Hole 865C-5H-4, 85–87 cm, Acarinina bullbrooki. (g) Sample ODP Hole 865C-4H-3, 95–97 cm, a reworked Morozovella aragonensis. (h) Sample ODP Hole 865C-5H-2, 45–47 cm, Globigerinatheka index. (i) Sample ODP Hole 865C-5H-2, 45–47 cm, Morozovelloides lehneri. All scale bars are 100 µm.
there is no simple morphological discrimination for “early” O. beckmanni forms (Premoli Silva et al., 2006; Edgar et al., 2010). Here we distinguished O. beckmanni from G. eu-ganeaby the presence of a large, hemispherical final cham-ber with more than four small and often irregular supplemen-tary apertures at its base, multiple supplemensupplemen-tary apertures between the chambers in the early whorl (sometimes poorly developed), and if present, areal apertures in the final cham-ber (areal apertures are not known in G. euganea) (Edgar
et al., 2010; Premoli Silva et al., 2006). However, notably, here we find highly developed spherical forms (i.e. with well-developed spiral sutural apertures, areal apertures, and > 4 supplementary apertures at the base of the final chamber) in the lowermost part of the species range at 40.89 ± 0.07 amcd and 41.03±0.05 amcd in Holes 865B and 865C, respectively (Table 5). The Top of A. bullbrooki occurs ∼ 4 m above the first occurrence of O. beckmanni at both sites (36.30 ± 0.06 in Hole 865B and 37.13 ± 0.05 amcd in Hole 865C; Table 5)
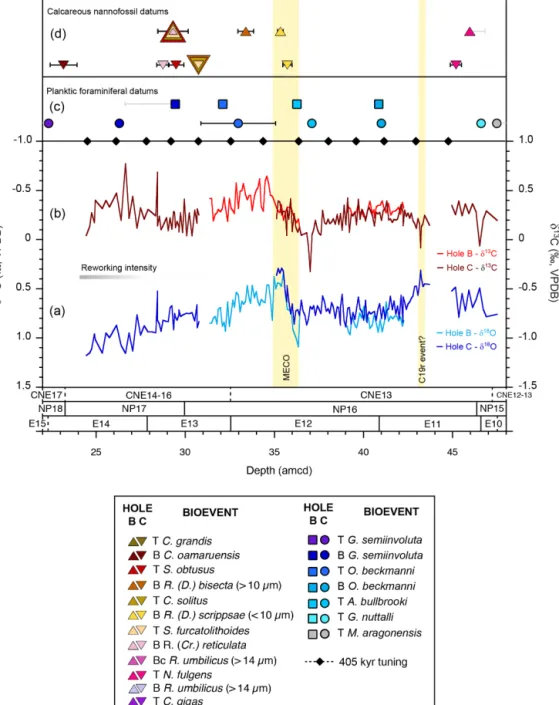
Figure 5.Benthic foraminiferal stable isotope records and age control points in ODP Holes 865B and 865C. (a, b) δ18O and δ13C values are from multi-specimen analyses of Nuttallides truempyi (no vital effect correction has been applied). Gaps in the records represent intervals where no data were generated. (c) Planktic foraminiferal datums are from this study (Table 5). (d) Calcareous nannofossil biostratigraphic markers are from Bralower and Mutterlose (1995) with new data here (Table 6). Depth uncertainties in datums are indicated by vertical lines (black lines: amcd scale; grey line: Top or Bottom depth falls outside of amcd scale and is shown in m b.s.f.) and where not visible are smaller than the symbol. The vertical yellow bars define the positions of the Middle Eocene Climatic Optimum (MECO) and the possible C19r event. T: Top; B: Base; Bc: Base of common occurrence. Note that only datums that fall within the new amcd scale are shown here.
with highly quadrate A. bullbrooki forms (Berggren et al., 2006) present that are not obviously reworked. This provides an additional correlative horizon and a check on the correla-tion between Holes 865B and 865C. Whilst not official bio-zone markers for this interval of the Eocene, the Hantken-inaassemblage at this site is very well developed, and these
taxa may be useful accessory markers (Coxall and Pearson, 2006). For instance, we note that Hantkenina australis ap-pears in samples at ∼ 43 amcd coincident with a pronounced isotopic excursion, which may be correlative with the C19r event (Fig. 5).
Figure 6.Age–depth plot for ODP Site 865. Only datums falling within the new adjusted metres composite depth (amcd: adjusted metres composite depth) scale are included here. To see all calcareous microfossil datums from the study interval see Fig. S3. Planktic foraminiferal datums are from this study and Pearson and Coxall unpub. (presented in Pearson and Ezard, 2014) (Table 5). Calcareous nannofossil datums are from this study and Bralower and Mutterlose (1995) (Table 6). Depth uncertainties in datums are indicated by vertical lines (black lines: amcd scale; grey line: Top or Bottom depth falls outside of amcd scale and is shown in m b.s.f.) and where not visible are smaller than the symbol. Black diamonds are the tuning tie points to the orbital solution (Table S2). Ages are shown on the Gradstein et al. (2012) timescale. Abbreviations of datums are T, B, or Bc for Top, Base, or Base of common occurrence, respectively, followed by the first letter of the genus and species name.
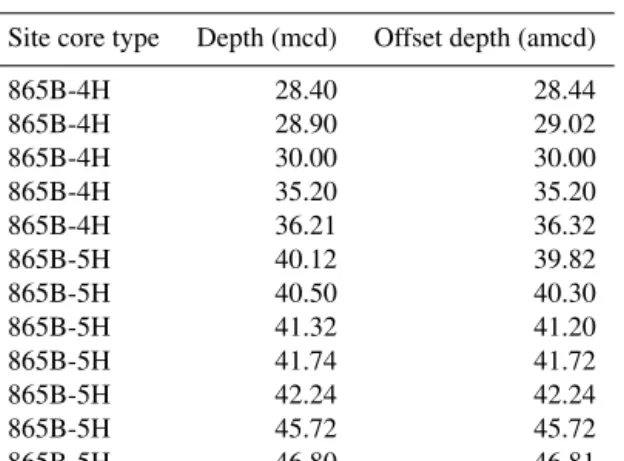
Table 3.Mapping pairs for adjusting mcd to amcd for ODP Hole 865B.
Site core type Depth (mcd) Offset depth (amcd)
865B-4H 28.40 28.44 865B-4H 28.90 29.02 865B-4H 30.00 30.00 865B-4H 35.20 35.20 865B-4H 36.21 36.32 865B-5H 40.12 39.82 865B-5H 40.50 40.30 865B-5H 41.32 41.20 865B-5H 41.74 41.72 865B-5H 42.24 42.24 865B-5H 45.72 45.72 865B-5H 46.80 46.81
The lower portion of the Site 865 study interval is as-signed to Zones E10 and E11. The Top of Guembelitri-oides nuttalli, which defines the base of Zone E11, occurs at 46.62 ± 0.10 amcd in Hole 865C but was not defined in Hole 865B (as it fell outside of the available sample set; Table 5). Notably, a small number of individuals that share the mor-phology of G. nuttalli with the distinctive high spire,
globu-Table 4.Mapping pairs for adjusting mcd to amcd for ODP Hole 865C.
Site core type Depth (mcd) Offset depth (amcd)
865C-4H 22.30 22.30 865C-4H 30.00 30.00 865C-4H 30.42 30.64 865C-5H 35.20 35.20 865C-5H 42.24 42.24 865C-5H 43.84 43.74 865C-6H 45.06 45.12 865C-6H 45.72 45.72 865C-6H 47.67 47.67
lar chambers, and a pronounced rim (Olsson et al., 2006) but lack supplementary apertures on the spiral side are present sporadically much higher in the site up to ∼ 22 amcd. The extinction of the distinctive taxon Morozovella aragonensis defining the base of Zone E10 falls outside of the new splice at 48.01 ± 0.76 and 47.99 ± 3.94 m b.s.f. in Holes 865B and 865C, respectively (Table 5). In Hole 865C, this corresponds to the extinction occurring below 47.51 amcd. The base of the secondary marker species Globigerinatheka index occurs at 62.10 ± 0.50 m b.s.f. in Hole 865B, and the bases of G. index
T ab le 5. Planktic foraminiferal datums in ODP Holes 865B and C. Ev ent Base of GTS2012 T op T op T op T op Bottom Bottom Bottom Bottom Midpoint ± (m) planktic age (Ma) sample depth depth depth sample dept h depth depth depth foraminiferal (m b .s.f.) (mcd) (amcd) (m b .s.f.) (mcd) (amcd) (amcd) zone Hole B T G. semiin voluta E15 36.18 3H-2, 75–77 20.25 – – 3H-2, 95–97 20.45 – – – – B G. semiin voluta 38.62 3H-CC 27.52 – – 4H-1, 60–62 28.12 28.90 29.02 – – T O. bec kmanni E13 40.03 4H-3, 80–82 31.30 32.08 32.08 4H-3,W , 90–92 31.42 32.20 32.20 32.14 0.06 T A. b ullbr ooki 40.49 4H-CC, 10–12 35.36 36.14 36.24 4H-CC, 20–22 35.48 36.26 36.36 36.30 0.06 B O. bec kmanni E12 40.49 5H-2, 20–22 38.70 40.98 40.83 5H-2, 30–32 38.82 41.10 40.96 40.89 0.07 B G. inde x 42.64 7H-4, 110–112 61.6 – – 7H-5, 55–60 62.60 – – – – B Mo. lehneri 43.15 7H-2, 87–89 58.37 – – 7H-3, 57–59 59.59 – – – – T M. ar a gonensis E10 43.26 6H-1, 75–77 47.25 – – 6H-2, 75–77 48.77 – – – – Hole C T G. semiin voluta E15 36.18 3H-6, 46–48 20.76 20.76 – 4H-1, 5–7 22.37 22.37 22.37 – – B G. semiin voluta 38.62 4H-3, 95–97 26.25 26.25 26.25 4H-3, 110–112 26.42 26.42 26.42 26.34 0.07 T O. bec kmanni E13 40.03 4H-CC, 10–12 30.7 30.7 30.91 5H-1, 5–7 31.87 35.09 35.10 33.00 2.10 B O. bec kmanni E12 40.49 5H-4, 145–147 37.75 40.97 40.97 5H-5, 5–7 37.87 41.09 41.09 41.03 0.05 T A. b ullbr ooki 40.49 5H-2, 55–57 33.85 37.07 37.07 5H-2, 65–67 33.97 37.19 37.19 37.13 0.05 T Gu. nuttalli E11 42.07 6H-2, 25–27 43.05 46.51 46.51 6H-2, 45–47 43.27 46.73 46.73 46.62 0.10 B G. inde x 42.64 7H-4, 110–112 56.4 – – 7H-5, 70–72 57.52 – – – – B Mo. lehneri 43.15 7H-4, 110–112 56.4 – – 7H-5, 70–72 57.52 – – – – T M. ar a gonensis E10 43.26 6H-2, 125–127 44.05 47.51 47.51 7H-1, 110–112 51.92 – – – – T : T op; B: Base; A : Acarinina ; G : Globig erinatheka ; Gu : Guembelitrioides ; M : Mor ozo vella ; Mo : Mor ozo velloides ; O : Orb ulinoides . Full sample windo w in which datum could fall is reported, i.e. top depth of T op sample and lo wermost depth in Bottom sample.
and M. lehneri occur at 56.96 ± 0.56 m b.s.f. in Hole 865C (Table 5). These datums typically occur in Zone E10 but oc-cur well below the Top of M. aragonensis here and therefore are within Zone E9.
3.4 Calcareous nannofossil biostratigraphy
Calcareous nannofossils at Site 865 are moderately well pre-served, showing signs of etching and/or recrystallization, but most specimens are identifiable to species level throughout. Biostratigraphically important calcareous nannofossil occur-rences from Bralower and Mutterlose (1995) that fall within our study interval are collated here and where possible trans-lated onto the new amcd scale (Tables 6, S5 and S6). Marker species in Holes 865B and 865C on the new amcd scale are in broad agreement with one another; i.e. datums in both holes overlap or are close to one another in depth space (Fig. 6). Datums that do not quite overlap in terms of depth space include the following: Nannotetrina fulgens, Reticulofenes-tra (Dictyococcites) bisecta (> 10 µm), Chiasmolithus soli-tus, and Sphenolithus furcatolithoides. These inconsistencies are likely a function of the relative rarity of these taxa within the cores making it difficult to reliably determine the highest or lowest true occurrence and/or in some cases this may be exacerbated by etching and overgrowth of some specimens (Bralower and Mutterlose, 1995). However, it is clear from the datums that fall outside of the interval incorporated in the new amcd scale in one or both Holes 865B and 865C (e.g. Bases of Chiasmolithus oamaruensis and Reticulofen-estra umbilicus and Top of C. gigas and C. grandis; see Fig. S3) that bioevents in Cores 865B-3H and 865C-3H oc-cur at similar levels, indicating limited offsets between Holes 865B and 865C. More significant offsets of up to 5 m are present between Holes 865B and 865C from Cores 865B-7H and 865C-7H downwards, indicating that significant adjust-ments are needed to align the two holes (Table 6).
Consistent with Bralower and Mutterlose (1995), calcare-ous nannofossil Zones NP15–18 (Martini, 1971) can be clearly identified at Site 865 (Table 6). On the more re-cent “CNE” zonation scheme (Agnini et al., 2014), the in-terval encompassing CNE Zones 12–17 is identified, but Zones CNE14–16 cannot be differentiated. This is because the CNE primary marker species (1) are very rare at this site – Reticulofenestra (Cribrocentrum) erbae; (2) occur in the same narrow window at ∼ 29 amcd – T Sphenolithus obtusus and Bc Reticulofenestra (Cribrocentrum) reticulata, defining the bases of Zones CNE16 and 14, respectively (Fig. 6); or (3) appear out of sequence between ∼ 28 and 32 amcd – e.g. the Bc R. (C). reticulata is very shallow, as are the T S. fur-catolithoides, T C. solitus, and B R. (D) bisecta; the last of which also has the largest offsets between the two holes.
3.5 Benthic foraminiferal stable isotope results
Benthic foraminiferal stable isotope records in both holes show similar patterns of change and absolute stable isotope values and are well aligned on the new amcd scale (Fig. 5). Benthic foraminiferal δ18O values vary between 0.3 ‰ and 1.2 ‰, with minimum δ18O values initially recorded at ∼ 43 amcd coincident with an abrupt shift of 0.7 ‰ to more negative δ13C values. δ18O and δ13C values subsequently increase and then plateau between 42 and 37 amcd. At ∼ 36.5 amcd, a second transient negative δ13C excursion of ∼ 1 ‰ occurs, which is closely followed by a ∼ 0.8 ‰ shift to lower δ18O values at 35 amcd. δ13C values increase through this same interval and reach maximum values at 34 amcd. δ18O values then gradually increase, and δ13C gradually de-crease towards the Top of the section at 24 amcd.
4 Discussion
4.1 Reworking
Reworking of older planktic foraminifera (from Zone P14 now E13) into younger material (Zones E13–E16 and Zone M1) in Cores 865B-1H to -3H was reported during shipboard analysis (Shipboard Scientific Party, 1993b) coinciding with the occurrence of relatively “soupy” sediments with a high water content. A downcore transition to more cohesive sed-iments coincided with reduced reworking. We demonstrate that reworking of planktic foraminifera extends deeper than this transition but lessens considerably with increasing depth and is not immediately evident below Sections 865B 4H-3 (∼ 32.8 amcd) or 865C 4H-4 (∼ 28.3 amcd) (Fig. 5). Only discrete time intervals are obviously mixed into younger sed-iments; i.e. reworked material is sourced from sediments de-posited during Zone E13 (as we find reworked Morozovel-loidesand Acarinina but not O. beckmanni from Zone E12) along with much older sediments from Zones E8 to 9 (based on M. aragonensis and G. nuttalli). Reworking is also present within nannofossil assemblages; for example, rare occur-rences of C. gigas, Triquetrorhabdulus inversus, and Chias-molithus consuetusoccur up to 15 m above their highest con-sistent occurrences in Cores 865B-3H and -4H and for C. gi-gasin Cores 865C-3H and -4H (Table 5; Bralower and Mut-terlose, 1995). These occurrences are consistent with remobi-lization of similar-aged sediments and depositional intervals to those identified by planktic foraminifera (Bralower and Mutterlose, 1995). Down-hole contamination was not obvi-ous within planktic foraminifera assemblages but was prob-lematic within calcareous nannofossil samples and was at-tributed to contamination from the saw used to split the cores and the high water content of the cores (Bralower and Mut-terlose, 1995). Benthic foraminiferal assemblages appear rel-atively unaffected by reworking or downhole contamination (Arreguín-Rodríguez et al., 2016). However, many deep-sea benthic foraminifera species are long-lived making
rework-T ab le 6. Calcareous nannofossil datums in ODP Holes 865B and C. Datum Base of GTS2012 T op sample Depth Depth Depth Bottom Depth Dept h Depth Midpoint ± (m) calcareous age (Ma) sample (m b .s.f.) (mcd) (amcd) sample (m b .s.f.) (mcd) (amcd) (amcd) nannofossil zone Hole B T C. gr andis 38.01 3H-1, 70–72 ∗ 18.70 – – 3H-1, 132 ∗ 19.32 – – – – B C. oamaruensis NP18 38.07 3H-3, 110 ∗ 22.10 – – 3H-4, 123 ∗ 23.73 – – – – T S. obtusus CNE16 38.69 4H-1, 16 ∗ 27.66 28.44 28.49 4H-2, 40 ∗ 29.40 30.18 30.18 29.33 0.85 B R.(D.) bisecta (> 10 µm) CNE15 40.40 4H-4, 20–22 32.20 32.98 32.98 4H-4, 107 ∗ 33.07 33.85 33.85 33.41 0.44 T C. solitus NP17 40.40 4H-1, 16 ∗ 27.66 28.44 28.49 4H-2, 40 ∗ 29.4 30.18 30.18 29.33 0.85 B R.(D.) scrippsae (< 10 µm) 40.23 4H-5, 90–92 34.40 35.18 35.18 4H-5, 120 ∗ 34.70 35.48 35.51 35.35 0.16 T S. fur catolithoides 40.53 4H-1, 16 ∗ 27.66 28.44 28.49 4H-2, 40 ∗ 29.40 30.18 30.18 29.33 0.85 Bc R.(Cr .) reticulata CNE14 42.20 4H-1, 16 ∗ 27.66 28.44 28.49 4H-2, 40 ∗ 29.40 30.18 30.18 29.33 0.85 Bc R. umbilicus (> 14 µm) CNE13 42.84 5H-CC ∗ 44.58 46.86 – 6H-1, 81–85 ∗ 47.35 – – – – T N. fulg ens NP16 42.87 5H-5, 70–72 ∗ 43.70 45.98 45.98 5H-6, 54–566 ∗ 44.56 46.84 – – – B R. umbilicus 43.32 6H-1, 81–85 ∗ 47.31 – – 6H-2, 73–75 ∗ 48.75 – – – – T C. gigas CNE12; NP15c 43.68 6H-1, 81–85 ∗ 47.31 – – 6H-2, 73–75 ∗ 48.75 – – – – Hole C T C. gr andis 38.01 3H-5, 80 ∗ 19.60 – – 3H-6, 10–11 ∗ 20.41 – – – – B C. oamaruensis NP18 38.07 4H-1, 10–11 ∗ 22.40 22.40 22.40 4H-2, 10–11 ∗ 23.91 23.91 23.91 23.15 0.76 T S. obtusus CNE16 38.69 4H-5, 75–77 29.05 29.05 29.05 4H-6, 10–11 ∗ 29.91 29.91 29.91 29.48 0.43 B R.(D.) bisecta (> 10 µm) CNE15 40.40 4H-6, 65–67 30.45 30.45 30.67 4H-CC ∗ 30.60 30.60 30.81 30.74 0.07 T C. solitus NP17 40.40 4H-6, 65–67 30.45 30.45 30.67 4H-CC 30.60 30.60 30.81 30.74 0.07 B R.(D.) scrippsae (< 10 µm) 40.23 5H-1, 45–47 32.25 35.47 35.47 5H-1, 95–97 32.77 35.99 35.99 35.73 0.26 T S. fur catolithoides 40.53 4H-6, 65–67 30.45 30.45 30.67 4H-CC 30.60 30.60 30.81 30.74 0.07 Bc R.(Cr .) reticulata CNE14 42.20 4H-5, 10–11 ∗ 28.40 28.40 28.40 4H-5, 75–77 29.07 29.07 29.07 28.73 0.34 Bc R. umbilicus (> 14 µm) CNE13 42.84 6H-CC ∗ 44.22 47.68 – 7H-1, 10–11 ∗ 50.91 – – – – T N. fulg ens NP16 42.87 6H-1, 10–11 ∗ 41.40 44.86 44.89 6H-1, 75 ∗ 42.05 45.51 45.53 45.21 0.32 B R. umbilicus 43.32 7H-2, 10–11 ∗ 52.40 – – 7H-2, 100* 53.30 – – – – T C. gigas CNE12; NP15c 43.68 6H-CC ∗ 44.22 47.68 – 7H-1, 10–11 ∗ 50.91 – – – – T : T op; Tc: T op common; B: Base; Bc: Base common; C: Chiasmolithus ; Cr: Cribr ocentrum ; D: Dictyococcites ; N: Nannotetrina ; R: Reticulofenestr a ; S: Sphenolithus . ∗: from Bralo wer and Mutterlose (1995). All ages on the GTS2012 timescale from Gradstein et al. (2012) with those in bold recalculated based on re vised calibrations from Agnini et al. (2014), in italics from Bohaty et al. (2009). Calcareous nannofossil zones: NP Zones are from Martini (1971), and CNE Zones are from Agnini et al. (2014). Full sample windo w in which datum could fall is reported, i.e. the top depth of the T op sample and the lo wermost depth in the Bottom sample.
ing difficult to recognize over the short intervals such as those investigated here.
Reworking is very common in the pelagic cap sequences atop guyots drilled during ODP Legs 143 and 144 in the equatorial Pacific, with the most intense reworking reported in the lowermost ∼ 40 m of pelagic sediments deposited above the drowned carbonate platforms related to changes in local hydrography (Premoli Silva et al., 1993; Pearson, 1995). Less intense reworking is also observed at higher (i.e. younger) levels in pelagic cap sequences and is more limited to discrete horizons and time intervals (Watkins et al., 1995; Pearson, 1995). Reworked material is likely sourced from the edges of the guyot top and transported towards the centre by intensification of bottom-water currents deflected up over the guyot as well as other localized hydrographic features com-mon to these settings, ultimately helping to generate the char-acteristic low dome-shaped sediment stack found on many Pacific guyots (Genin et al., 1989; Pearson, 1995).
ODP Site 865 sits in an oceanographically dynamic area, relatively close to the edge of the guyot, where the sedi-mentary cap starts to thin; e.g. it lacks the thick Miocene– Quaternary overburden of the guyot centre (Shipboard Sci-entific Party, 1993b). The abraded appearance of reworked foraminifera (e.g. dull lustre and fragmented) suggests that they have been exposed to intense mechanical erosion, e.g. from currents and/or a more intense transport history than the in situ assemblage (Pilkey et al., 1969; Maiklem, 1967). However, the pervasive brown foraminiferal discolouration on many specimens, an oxidized iron stain and pyrite, likely reflect deposition in a low-sedimentation (and hence high current intensity) area with iron sourced from the contempo-raneous formation of manganese–phosphate hardgrounds or remobilized from the lower limestone platform (Shipboard Scientific Party, 1993b). Together these lines of evidence suggest a similar reworking mechanism to that observed on other Pacific guyots (Pearson, 1995; Watkins et al., 1995) with sediments mobilized from the low sedimentation mar-gins of the guyot top during discrete intervals of increased lo-cal current intensity and then mixed into sediments closer to the centre of the pelagic cap. Crucially, currents around Site 865 were clearly sufficient to mix and remobilize sediments at times in the late middle Eocene but not to scour the guyot top of sediments. Consistent with this hypothesis is a reduc-tion of sedimentareduc-tion rates above ∼ 25 amcd or 25 m b.s.f. (Figs. 5 and S3) coincident with the zone of most intense reworking. Lower sedimentation rates, in addition to being consistent with elevated current activity either removing sed-iment or preventing deposition, would also reduce dilution of mixed components in sediments by in situ fauna making the reworking more evident. Regardless of reworking, the ability to correlate the XRF records at the decimetre scale and the coherent stable isotope stratigraphy through Cores 865B-4H to -6H and 865C-4H to -6H (∼ 22 to 48 amcd) suggests that reworking is relatively easy to avoid (benthic foraminifera were generally better preserved than planktic counterparts,
e.g. with no evidence of staining or abrasion), not pervasive throughout the site, and most critically, has not obscured pri-mary environmental signals.
4.2 Climatic events at ODP Site 865
The long-term shift towards more positive benthic
foraminiferal δ18O values observed through the Site 865 study interval (Fig. 5) is consistent with a previously published low-resolution benthic foraminiferal stable isotope record spanning the middle and upper Eocene at this site (Coxall et al., 2000; Bralower et al., 1995), as well as the global Eocene cooling trend (Zachos et al., 2008; Bohaty and Zachos, 2003). Superimposed on this long-term trend is a transient negative δ18O excursion of ∼ 0.8 ‰ between ∼35–36 amcd, within calcareous nannofossil and planktic foraminiferal Zones NP16 and E12, respectively, which is identified here as the MECO event (Fig. 5). The onset of the event is defined at the point where δ18O begins to show a transition to more negative values. The end of the event is less clearly defined, as at some other sites (Bohaty et al., 2009; Giorgioni et al., 2019; Boscolo Galazzo et al., 2014). However, the distinctive δ13C maximum (of ∼ 0.6 ‰), which immediately follows the MECO (e.g. Bohaty et al., 2009; Edgar et al., 2010; Spofforth et al., 2010; Boscolo Galazzo et al., 2014; Giorgioni et al., 2019), suggests that the abrupt increase to more positive δ18O values at 35 amcd likely marks the end of the event (see vertical yellow bar in Fig. 5). Indeed, the gradual increase to more positive δ18O values that follows between ∼ 30–35 amcd is also seen at multiple ODP sites, including Sites 738, 748, and 1051 where the end of the event is clearly defined (Edgar et al., 2010; Bohaty et al., 2009).
The new composite record constructed using XRF data enables us to capture the entire MECO event at Site 865. However, very low sedimentation rates (< 0.6 cm kyr−1; Ta-ble S2) at this site compared to many other deep-sea sites (Bohaty and Zachos, 2003; Edgar et al., 2010; Boscolo Galazzo et al., 2014) mean that the event is highly densed and only spans a ∼ 1 m interval (Fig. 3). This is con-sistent with the reduced magnitude of the δ18O excursion (∼ 0.8 ‰ vs. 1.0 ‰–1.5 ‰) compared to elsewhere, the lack of a short (< 50 kyr) negative δ13C excursion coincident with peak MECO conditions (defined by the δ18O minimum), and the rapid apparent onset of the event (Boscolo Galazzo et al., 2014).
Constraining the magnitude, timing, and pattern of CCD change across Eocene global warming events provides vital clues as to the source, mass, and rate of carbon input driving these events. This is particularly true for the MECO, dubbed a “carbon cycle conundrum” (Sluijs et al., 2013), because, over the relatively “long” event duration (∼ 300–500 kyr), increasing atmospheric CO2levels, and associated warming
should have increased weathering rates leading to CCD deep-ening rather than the observed shoaling (Sluijs et al., 2013;
Bohaty et al., 2009). Because of its relatively shallow wa-ter sedimentation, Site 865 is a critical end-member for con-straining the Pacific CCD response during the MECO and other Eocene shoaling events. At > 900 m, the CCD shoal-ing associated with the MECO is the largest known in the middle-to-late Eocene interval (shoaling from ∼ 4.2 km to above 3.3 km palaeo-water depth; Pälike et al., 2012). Rel-atively continuous carbonate sedimentation across the event at ODP Site 865 suggests that the CCD did not shoal above ∼1300–1500 m (the estimated palaeo-water depth of the site; Shipboard Scientific Party, 1993b) in the Pacific Ocean at this time providing a maximum limit of 3 km change.
The negative carbon and oxygen isotopic excursions rep-resented here by only a single sample at ∼ 43 amcd (Fig. 5), in planktic foraminiferal Zone E11, immediately before a shift to more positive δ18O values likely corresponds to the “C19r event”, a transient hyperthermal-style event (< 100 kyr in duration) initially recognized at ODP Site 1260 in the equatorial Atlantic (Edgar et al., 2007). The C19r event is now also known from the South Atlantic at ODP Sites 1263 and 702 and referred to as the Late Lutetian Ther-mal Maximum (Westerhold et al., 2018a). Similar to the MECO, the relatively small stable isotope excursions com-pared to elsewhere (0.4 ‰ and 0.2 ‰ vs. 1.5 ‰ and ∼ 1.8 ‰, in δ13C and δ18O at ODP Sites 865 and 1260, respectively) are likely a function of the low sedimentation rates at this site (∼ 0.4–0.6 cm kyr−1vs. 2.0 cm kyr−1at ODP Site 1260) compounded by lower sampling frequency and time averag-ing. This is the first record of the C19r event outside of the Atlantic Ocean and suggests that the C19r event is in fact global in nature and, as such, may be a valuable stratigraphic marker within the long > 1 Myr planktic foraminiferal Zone E11 in which it falls.
A tentative astronomical tuning for the MECO interval of Site 865 based on correlation of the bandpass filter of ln(Sr/Ca) to the 405 kyr component of eccentricity, anchor-ing the record near the onset of the MECO to the eccen-tricity minimum at 40.5 Ma (Westerhold and Röhl, 2013), is in close agreement with available biostratigraphic age con-trol (Fig. 6). This interpretation places the peak δ18O excur-sion during the MECO within a 405 kyr eccentricity maxi-mum at 40.3 Ma, and the carbon-isotope maximaxi-mum directly following the MECO coincides with the 405 kyr eccentric-ity minimum at 40.1 Ma, in agreement with Westerhold and Röhl (2013). The duration of the interval between the poten-tial C19r event and the onset of the MECO is estimated at three and a half 405 kyr cycles or 1.4 Myr, which is longer than the duration estimated by Westerhold and Röhl (2013) at two and a half 405 kyr cycles, ∼ 1 Myr. Unfortunately, a detailed comparison to existing cyclostratigraphic studies is hampered by uncertainty in the detection of the C19r event. The apparent differences in these duration estimates are in line with existing discrepancies between astrochronologies, notably in the reported length of magnetochron C19r, with duration estimates varying between 0.9 Myr (Westerhold and
Röhl, 2013; Westerhold et al., 2014, 2015) and 1.5 Myr (Boulila et al., 2018).
4.3 Integrated biostratigraphic schemes and relationship to the MECO
Whilst both calcareous nannofossil and planktic
foraminiferal zonation schemes can be applied to ODP Site 865 and are in generally good agreement, there is significant disagreement in the post-MECO interval between ∼35 and 30 amcd (Fig. 6). Taken at face value, plank-tic foraminifera indicate constant sedimentation rates of ∼0.5 cm kyr−1throughout this interval, whereas calcareous nannofossil datums suggest a 3.5 Myr hiatus between 38.6 and 42.1 Ma. However, XRF-derived elemental and stable isotope datasets and cyclostratigraphic analysis do not indicate any large shifts at this level that might indicate an abrupt shift in environmental conditions (Figs. 2, 3, and 5). The identified presence of the MECO event itself, which falls within this potential gap, also implies that a hiatus is unlikely.
It is instead likely that low sedimentation rates and sam-pling frequency make it difficult to discern closely spaced calcareous nannofossil bioevents at Site 865, e.g. Tops of C. solitus and S. furcatolithoides, which are calibrated to a 130 kyr interval (40.40–40.53 Ma). However, these events also occur much higher in the section than expected relative to the MECO event at this site, and they also overlap with the much younger Top of S. obtusus and Base of R. (C.) reticulata(Fig. 5). Explanations could include the follow-ing: these bioevents are diachronous and/or are not well cal-ibrated or there is subtle reworking of calcareous nannofos-sils. As discussed above, this interval does indeed show evi-dence of reworking (Fig. 3), which could have extended the Tops of species to higher in the section than expected and introduced a degree of subjectivity in determining what is in situ versus reworked. More intense bioturbation and/or higher core water content through this interval may have fur-ther affected the datum levels. However, a number of recent studies have questioned the accuracy of long-standing cal-careous nannofossil age calibrations (e.g. Agnini et al., 2014; Tori and Monechi, 2013). For instance, many Chiasmolithus bioevents (including C. solitus) are no longer included in the most recent calcareous nannofossil zonation scheme because typically low and sporadic abundances of these species at many sites introduces significant uncertainty to reported da-tum levels (Agnini et al., 2014; Larrasoaña et al., 2008; Villa et al., 2008). We also note differences in the relative posi-tions of the first occurrences of R. (D.) bisecta (< 10 µm) and R. (D.) bisecta/scrippsae(> 10 µm) in multiple studies, but this may also reflect taxonomic problems that are associated with the definition of these taxa (e.g. Mita, 2001; Tori and Monechi, 2013; Larrasoaña et al., 2008; Backman, 1987). The relatively high position of the Base of R. (C.) reticulata at Site 865 is also consistent with the highly variable position
of this event reported from other sites, ranging from magne-tochron C20r to C18n.2n (a ∼ 5 Myr interval; Fornaciari et al., 2010; Rivero-Cuesta et al., 2019; Fioroni et al., 2012). However, given the sporadic and rare presence of R. (C.) reticulatain our own observations here, the most likely ex-planation is ecological bias at Site 865. Similarly, N. fulgens is typically rare with an infrequent distribution at Site 865 and elsewhere, reducing its biostratigraphic utility (Bown, 2005; Shamrock, 2010).
The Base of O. beckmanni is diachronous, with the species first appearing in the tropics prior to the MECO but sub-sequently expanding to higher latitudes across the onset of the MECO and inferred surface water warming (Edgar et al., 2010; Luciani et al., 2010; Jovane et al., 2010). At Site 865, the Base of O. beckmanni precedes the MECO event, which is consistent with this hypothesis (Fig. 3). The Top of O. beckmannioccurs after the MECO event at Site 865, as at ODP Site 1051 and in the Alano section in the Atlantic and Tethyan oceans, respectively (Luciani et al., 2010; Edgar et al., 2010), suggesting that cooling of surface waters fol-lowing the MECO was not directly responsible for its extinc-tion. Regardless, planktic foraminiferal Zone E12 is a good marker for the MECO interval in (sub)tropical sediments that lack a stable isotope stratigraphy. The first occurrence of R. (D.) scrippsae (R. (D.) bisecta<10 µm) at low- and mid-latitude sites is also used to approximate the beginning of the MECO event based on close correlation at a number of sites in the Atlantic Ocean (Bohaty et al., 2009). The Base of R. (D.) bisecta<10 µm does occur within the MECO event at ODP Site 865 (Fig. 5).
The robust and cosmopolitan planktic foraminifera A. bull-brookiis a valuable secondary marker that is approximately coincident with the base of Zone E12 at 40.04 Ma at many sites (Wade et al., 2011; Gradstein et al., 2012) and can be applied when O. beckmanni is absent either due to its rela-tively high susceptibility to mechanical damage and dissolu-tion or limited (sub)tropical distribudissolu-tion (Edgar et al., 2010). However, here we find that the Top of A. bullbrooki and the Base of O. beckmanni are not synchronous as implied by the current biozonation scheme (Wade et al., 2011). Whilst there can be a degree of subjectivity in the definition of O. beck-mannibetween workers at the start of its range (Premoli Silva et al., 2006) this is not the case at ODP Site 865 where highly spherical and distinctive forms are present in the lowermost samples (assuming that downhole contamination is not a ma-jor, issue; Fig. 4). There are relatively few sites where both taxa are reported but at ODP Sites 1051 and 1260, in the (sub)tropical Atlantic Ocean, the Top of A. bullbrooki also occurs significantly higher than the Base of O. beckmanni before (Site 1051) or even after (Site 1260) the MECO event (Shipboard Scientific Party, 2004, 1998; Edgar et al., 2010). In the Contessa section, Italy, the Top of A. bullbrooki occurs significantly below the Base of O. beckmanni and the MECO (Jovane et al., 2010). Either way, the events are not
contem-poraneous, suggesting that a significant revision of this da-tum is required.
Whilst Hantkenina is present in low abundance throughout the middle-to-upper Eocene section of Site 865 (Coxall et al., 2000), there is a transient appearance of rare Hantkenina aus-tralis, a distinctive middle Eocene form with recurved tubu-lospines, within the inferred C19r “hyperthermal” event. This is surprising because this taxon is found globally, but, un-like most other Hantkenina spp., is most abundant at higher latitudes and, thus, in cooler waters (Coxall and Pearson, 2006). The appearance of Hantkenina australis may prove to be a future useful biostratigraphic marker for C19r, within an otherwise “datum-poor” interval. Notably, previous tran-sient incursions of more tropical species of Hantkenina to high northern latitudes (> 50◦N) in the middle Eocene at ODP Site 647 have previously been used to infer surface ocean warming around the C19r interval (Shipboard Scien-tific Party, 1987). However, stratigraphic revision of ODP Site 647 by Firth et al. (2012) places the lower Hantkenina incursion at the base of calcareous nannofossil Zone NP16 and close to the magnetochron 18r/19n boundary, which is significantly later than the C19r event but before the MECO – and inconsistent with the hypothesis of expansion of the Hantkenina range in response to warming surface waters. Thus, these incursions may instead reflect changes in up-welling or increased primary production (Coxall et al., 2007). The Top of G. nuttalli was introduced as the marker for the base of planktic foraminiferal Zone E11 in 2005, based on correlations at ODP Sites 1050 and 1051 (R. D. Norris, per-sonal communication, cited in Berggren and Pearson, 2005) to break up the otherwise very long multi-million-year Zone P12 from the earlier zonation scheme (Berggren et al., 1995). However, occurrences of G. nuttalli (albeit small individu-als) have now been found as high as Zone E14 (i.e. above the MECO) in the Alano section in northern Italy, with the high-est consistent occurrence in Zone E13 (Agnini et al., 2011). The datum level reported in Table 5 (46.62 ± 0.10 amcd) is the highest consistent occurrence of this taxon at Site 865, but, similar to Alano, we find at least sporadic occurrences of small individuals up through Zones E13 and E14 that are not obviously reworked.
A number of bioevents within Zone E10 at Site 865 are out of sequence with respect to the primary datum – the Top of M. aragonensis (43.26 Ma) – occurring above the Bases of younger taxa G. index and M. lehneri (at 42.64 and 43.15 Ma, respectively). It is the highest occurrences of taxa that are most likely to be impacted by reworking. Yet M. aragonensis specimens do not show distinctive staining or worn appear-ance at this level (as they do higher up in Hole 865C where they are clearly reworked), and, whilst individuals could be remobilized locally, a higher Top of M. aragonensis com-pared to G. index is also evident in the Contessa section, Italy (Jovane et al., 2010).
Clearly more work is needed to confidently understand the relative patterns of calcareous nannofossil and planktic
foraminiferal datums in the middle Eocene. This is particu-larly true for the Pacific Ocean since most (if not all) cali-brations are currently based on Atlantic or Tethyan sediment sequences and indeed few sites where both groups are inter-calibrated (e.g. Agnini et al., 2014; Berggren and Pearson, 2005). Whilst many key tropical middle Eocene bioevents are identified at Site 865, the lack of magnetic or confident astrochronology hinders determination of the absolute age of the events reported here. However, in the future, the high-resolution stable isotope and XRF records should enable the development of a more robust orbitally tuned age model here or allow correlation to sites elsewhere that possess an inde-pendent reliable stratigraphy.
5 Conclusions
In this study, we have developed new biostratigraphic, sta-ble isotope, and XRF records that span the MECO event at ODP Site 865 in the tropical Pacific Ocean. This site pos-sesses a surprisingly coherent signal in XRF-derived ele-mental counts and ratios permitting us to construct a re-liable composite section for Holes 865B and 865C span-ning the late middle Eocene time interval (∼ 38–43 Ma). Cyclicity observed in XRF datasets is likely orbitally paced, and a tentative astronomical tuning of the study section in-dicates consistently low but steady sedimentation rates of ∼0.4–0.6 cm kyr−1, in agreement with bio- and chemostrati-graphic age calibrations and correlations to other sites. Ben-thic foraminiferal stable isotope data indicate that the MECO and the C19r events are present at Site 865, albeit rel-atively condensed. Planktic foraminiferal biostratigraphic events from the classic zonation schemes are recognized here and are generally in good agreement with calibrated strati-graphies, with the exception of the tops of G. nuttalli, A. bullbrooki, and M. aragonensis, which occur anomalously high in the section. When considered alongside available cal-careous nannofossil datums, there is some disagreement in terms of both the relative ordering and position of calcare-ous microfossil events, particular with respect to the MECO event, which, in the absence of an independent age model, acts as a key stratigraphic marker. Thus, further calibrations of these bioevents are necessary, particularly from the Pa-cific Ocean, which is poorly represented in current calibra-tion schemes. Microfossil reworking is also evident in the uppermost ∼ 30 m of Site 865 above the MECO interval, in-dicating a dynamic local hydrography capable of remobiliz-ing and mixremobiliz-ing sediments durremobiliz-ing the middle Eocene. ODP Site 865 is the first tropical record where the apparent en-tirety of the MECO event is preserved in carbonate-bearing sediments, and, despite the reworking at this site, the pri-mary environmental signals are preserved. Thus, ODP Site 865 represents a valuable site for future investigations into environmental and biotic change in the tropics during the MECO.
Data availability. All raw data files are available in the Supple-ment and also at https://doi.org/10.1594/PANGAEA.920115 (Edgar et al., 2020).
Supplement. The supplement related to this article is available online at: https://doi.org/10.5194/jm-39-117-2020-supplement.
Author contributions. KME conceived and coordinated the study, processed and analysed the samples for stable isotope anal-ysis, developed a revised planktic foraminiferal biostratigraphy, drafted figures, and wrote the article; SMB carried out XRF analy-ses and constructed the composite depth scales and drafted associ-ated figures; SB conducted spectral analysis, constructed the orbital stratigraphy, and drafted associated figures; PB conducted new cal-careous nannofossil analyses; PNP and HKC developed the initial planktic foraminiferal biostratigraphy for this site and contributed to the revised planktic foraminiferal biostratigraphy and taxonomy; CL supported the stable isotope work. All authors contributed to the writing and editing of the article.
Competing interests. The authors declare that they have no con-flict of interest.
Acknowledgements. This research used samples provided by the International Ocean Discovery Program (IODP). The authors would like to thank Sandra Nederbragt for technical assistance with δ18O and δ13C analyses and Cardiff University undergraduate students Bo Fan Peng, Jonathon Gamble, and Holly Welsby for help picking benthic foraminifera.
Financial support. This research has been supported by the Nat-ural Environment Research Council (grant nos. NE/H016457/1 and NE/P013112/1) and the Leverhulme Trust (grant no. ECF-2013-608).
Review statement. This paper was edited by Laia Alegret and re-viewed by two anonymous referees.
References
Agnini, C., Fornaciari, E., Giusberti, L., Grandesso, P., Lanci, L., Luciani, V., Muttoni, G., Paelike, H., Rio, D., Spofforth, D. J. A., and Stefani, C.: Integrated biomagnetostratigraphy of the Alano section (NE Italy): A proposal for defining the middle-late Eocene boundary, Geol. Soc. Am. Bull., 123, 841–872, https://doi.org/10.1130/B30158.1, 2011.
Agnini, C., Fornaciari, E., Raffi, I., Catanzariti, R., Pälike, H., Back-man, J., and Rio, D.: Biozonation and biochronology of Pale-ogene calcareous nannofossils from low and middle latitudes, Newsl. Stratigr., 47, 131–181, https://doi.org/10.1127/0078-0421/2014/0042, 2014.