HAL Id: hal-00298518
https://hal.archives-ouvertes.fr/hal-00298518
Submitted on 15 Jun 2007HAL is a multi-disciplinary open access
archive for the deposit and dissemination of sci-entific research documents, whether they are pub-lished or not. The documents may come from teaching and research institutions in France or abroad, or from public or private research centers.
L’archive ouverte pluridisciplinaire HAL, est destinée au dépôt et à la diffusion de documents scientifiques de niveau recherche, publiés ou non, émanant des établissements d’enseignement et de recherche français ou étrangers, des laboratoires publics ou privés.
Direct evidence for radar reflector originating from
changes in crystal-orientation fabric
O. Eisen, I. Hamann, S. Kipfstuhl, D. Steinhage, F. Wilhelms
To cite this version:
O. Eisen, I. Hamann, S. Kipfstuhl, D. Steinhage, F. Wilhelms. Direct evidence for radar reflector originating from changes in crystal-orientation fabric. The Cryosphere Discussions, Copernicus, 2007, 1 (1), pp.1-16. �hal-00298518�
TCD
1, 1–16, 2007Internal RES reflector originating from COF
O. Eisen et al. Title Page Abstract Introduction Conclusions References Tables Figures ◭ ◮ ◭ ◮ Back Close Full Screen / Esc
Printer-friendly Version Interactive Discussion
EGU
The Cryosphere Discuss., 1, 1–16, 2007 www.the-cryosphere-discuss.net/1/1/2007/ © Author(s) 2007. This work is licensed under a Creative Commons License.
The Cryosphere Discussions
The Cryosphere Discussions is the access reviewed discussion forum of The Cryosphere
Direct evidence for radar reflector
originating from changes in
crystal-orientation fabric
O. Eisen, I. Hamann, S. Kipfstuhl, D. Steinhage, and F. Wilhelms
Alfred-Wegener-Institut für Polar- und Meeresforschung, Bremerhaven, Germany Received: 23 May 2007 – Accepted: 12 June 2007 – Published: 15 June 2007 Correspondence to: O. Eisen ([email protected])
TCD
1, 1–16, 2007Internal RES reflector originating from COF
O. Eisen et al. Title Page Abstract Introduction Conclusions References Tables Figures ◭ ◮ ◭ ◮ Back Close Full Screen / Esc
Printer-friendly Version Interactive Discussion
EGU
Abstract
The origin of a strong continuous radar reflector observed with airborne radio-echo sounding (RES) at the EPICA deep-drilling site in Dronning Maud Land, Antarctica, is identified as a transition in crystal fabric orientation from a vertical girdle- to increased single-pole orientation seen along the ice core. The reflector is observed with a 60 ns 5
and 600 ns long pulse at a frequency of 150 MHz, spans one pulse length, is continuous over 5 km, and occurs at a depth of about 2020–2030 m at the drill site. Changes in conductivity as reflector origin are excluded by investigating the ice-core profile and synthetic RES data. Our observations allow to extrapolate the crystal orientation feature along the reflector in space, with implications for ice-sheet dynamics.
10
1 Introduction
The current demand for advanced modeling of ice sheets requires the incorporation of anisotropic properties of ice for unraveling their history and predicting their future behaviour (ISMASS Committee, 2004). The correlation between fabric changes and climate transitions (e.g. Durand et al., 2007) moreover emphasizes that valuable 15
information is carried by vertical and lateral fabric distributions. Radio-echo sounding (RES) provides a tool to map strong fabric changes occurring over few 10 s of meters in the vertical from the surface, as will be shown here.
Since the beginning of operational applications of RES in glaciological research three processes were suggested to cause continuous internal reflections from within 20
the ice column (Bogorodsky et al.,1985; Dowdeswell and Evans,2004): changes in density (Robin et al.,1969), conductivity (Paren and Robin,1975), and changes in the crystal orientation fabric (COF) (Harrison,1973). Whereas the isochronous property of reflection horizons originating from changes in density and conductivity is nowadays routinely exploited for a multitude of purposes, the detection and interpretation of 25
TCD
1, 1–16, 2007Internal RES reflector originating from COF
O. Eisen et al. Title Page Abstract Introduction Conclusions References Tables Figures ◭ ◮ ◭ ◮ Back Close Full Screen / Esc
Printer-friendly Version Interactive Discussion
EGU
the early stages. Partial reflection of a propagating radar pulse occurs where either the real (ε′) or imaginary part (ε′′) of the complex dielectric constant (ε) changes. The possibility to detect fabric changes with RES arises from the anisotropy of permittivity in a pure ice crystal. The latest compilation of dielectric properties of ice (Fujita
et al., 2000) provides an anisotropy in ε′ of ∆ε′=ε′||−iε′⊥≈0.035, measured parallel 5
and perpendicular to the crystal c-axis, at 1 MHz and 252 K. This value corresponds to little more than roughly 1% of the permittivity of ice, which is in the range of 3.1–3.2.
To discriminate reflections originating from changes in COF and conductivity, multi-frequency experiments can be utilized (Fujita et al., 1999). However, as ice is also a birefringent medium at radio frequencies (Hargreaves,1978), multi-polarization 10
measurements are required to resolve ambiguities arising from anisotropic reflection and wave propagation in a birefringent medium (Doake et al., 2002; Fujita et al.,
2003). With such experiments, Matsuoka et al. (2003,2004) located high-scattering zones several hundred meters thick at depths around 1000–1500 m in East Antarctica. Based on the dependence of reflection strength on polarization plane, the wide 15
zone was interpreted as alternations in COF of adjacent ice layers. Fujita et al.
(2006) determined the vertical evolution of the radar phase by combining ice-core profiles of COF at the same sites with a matrix-model of radar-wave propagation. By comparison with multi-polarization/bi-frequency RES point data, they determined the general contribution of anisotropic reflection from COF and birefringence to the 20
observed signals. Unfortunately, previous studies did not provide COF data from ice cores for direct comparison with RES data.
In this work we extend previous findings by comparing RES data with ice-core profiles of COF, permittivity, and conductivity. We moreover use synthetic RES data to analyse the origin of RES signals. This leads to the novel observation that a sharp 25
internal reflection horizon, continuous over several kilometers, is caused by an abrupt transition in crystal orientation fabric occuring over just few tens of meters.
TCD
1, 1–16, 2007Internal RES reflector originating from COF
O. Eisen et al. Title Page Abstract Introduction Conclusions References Tables Figures ◭ ◮ ◭ ◮ Back Close Full Screen / Esc
Printer-friendly Version Interactive Discussion
EGU
2 Data and methods
2.1 Radio-echo sounding (RES)
The RES flight line used here runs along an ice divide (ESE–WNW direction), passing the EPICA drill site (0.0684◦E, 75.0025◦S, 2891.7 m) about 100 m to the NNE (Fig. 1). The RES profiles 022150 (600 ns pulse) and 023150 (60 ns pulse) 5
shown in Fig. 2 were recorded with the system on board the Dornier 228-101 aircraft Polar2 operated by the Alfred Wegener Institute (AWI) in season 2002/2003 at an altitude of 450 m above ground. The system, with an overall performance figure of 190 dB, generates a 150 MHz burst of 60 ns and 600 ns duration, which are transmitted alternatingly, resulting in a trace spacing of 6.5 m between equal pulses 10
at typical speeds of 65 m s−1 (130 knots) (Nixdorf et al.,1999). The receiver module rectifies and logarithmically compresses the signal, stacks 200 consecutive signals after analog-to-digital conversion, and stores the data on tape at sample intervals of 13.33 ns over a time window of 50 µs. For the later analysis, we consider a stack of 10 traces closest to the drill site of each pulse, referred to as the long and short RES 15
traces, respectively (Fig.3). Apart from static correction for the first break of the surface reflection, no additional filtering or gain control is applied to the RES traces. Conversion from recorded traveltime to depth domain is performed with the calibration for pure-ice permittivity derived byEisen et al.(2006), with a mean wave speed of 168.7 m µs−1at 2100 m depth.
20
2.2 Ice-core permittivity and conductivity profiles
Dielectric profiling (DEP) at 250 kHz and γ-attenuation profiling, simultaneously carried out in the field after core retrieval, provide dielectric properties and density along the EPICA-DML ice core (seeEisen et al.,2006for details). The calibrated DEP record was corrected for variations in core diameter and temperature. Unreliable data in the vicinity 25
TCD
1, 1–16, 2007Internal RES reflector originating from COF
O. Eisen et al. Title Page Abstract Introduction Conclusions References Tables Figures ◭ ◮ ◭ ◮ Back Close Full Screen / Esc
Printer-friendly Version Interactive Discussion
EGU
(DECOMP) in the two-phase system ice–air are taken into account by applying a volumetric mixing model extended to complex space, thus separating contributions from density and conductivity in permittivity (Wilhelms,2005).
2.3 Finite-difference forward modeling
The synthetic trace, adapted from Eisen et al. (2006), simulates the 60 ns pulse 5
(Fig.3). It is calculated by a one-dimensional finite-difference time-domain model of Maxwell’s curl equations. Ice-core profiles of permittivity and conductivity, corrected for DECOMP and transformed to 150 MHz, serve as model input. Conductivity is provided in 0.02 m resolution. Because of the strong influence of the DEP-measurement noise in permittivity on synthetic reflections, permittivity is smoothed over 20 m (Eisen
10
et al., 2006). The synthetic trace thus only contains reflections which originate from changes in conductivity. Processing comprises a synchronization of the synthetic source signal to the RES direct coupling signal by a time shift of +0.1 µs, application of a Hilbert magnitude transformation to obtain signal envelope (i.e. mimic rectification), and smoothing with a 100 ns Gaussian running-mean filter.
15
2.4 Determination of crystal-orientation fabric
Fabric data of the EPICA DML deep ice core were measured down to 2560 m depth in a coldroom at a temperature of –20◦C in 2005 at AWI (Bremerhaven, Germany). Samples were drilled between 2001 and 2004 and have been stored at –30◦C after the transportation at –25◦C to AWI. Thin sections were prepared according 20
to standard procedures using a microtome from horizontally (0.5×50×50 mm3) and vertically (0.5×50×100 mm3) cut samples. Orientations of c-axes were derived using an automatic fabric analyzer system (Wilson et al., 2003), which enables complete measurement of these samples in 15 to 30 min. In addition to the Schmidt diagrams (mapping each measured crystal c-axis direction from a point on the hemisphere to 25
TCD
1, 1–16, 2007Internal RES reflector originating from COF
O. Eisen et al. Title Page Abstract Introduction Conclusions References Tables Figures ◭ ◮ ◭ ◮ Back Close Full Screen / Esc
Printer-friendly Version Interactive Discussion
EGU
of the eigenvalues λi of the orientation tensor (Wallbrecher, 1979). The eigenvalues (Fig. 3) represent the components along the orthogonal coordinate system ˆei of an ellipsoid, which best approaches the momentum of inertia of the c-axes distribution.
3 Results and discussion
Drilling finished in January 2006 with reaching bedrock at a logged ice thickness of 5
2774.15 m. The radar profiles at both pulses show the known internal layering, which increasingly follows the bedrock topography at larger depth. The echo-free zone is present in the lowest 500–800 m depth above bedrock. The 600 ns pulse spans some 50 m in ice and integrates over a much wider depth range than the short pulse, which covers only about 5 m. As could be expected, less layers are therefore visible in 10
the profile recorded with the 600 ns pulse than in the one recorded with the 60 ns pulse (Fig.2). Looking at single traces, it is evident that several distinct peaks in the short-pulse trace have nevertheless counterparts in the long-pulse trace. This is clearly the case for strong reflections at depths of 1810 and 2035 m, and less so at 1865 and 2080 m (Fig. 3). Dominant reflections of each pulse cover about one pulse length. 15
The first break of the concurrent reflections appear at about the same depth, but the maximum power in the long pulse occurs about 10 m deeper.
The comparison between the short pulse trace and the synthetic trace carried out by
Eisen et al.(2006) demonstrates that a number of internal layers can be reproduced by forward modeling based on a conductivity profile. Removing dominant peaks 20
by interpolation in the underlying conductivity profile causes a disappearance of the related reflections in the synthetic trace, as indicated for two cases at 1865 and 2080 m depth in Fig. 3 by the dotted line and the black peaks of the synthetic radargram. This demonstrates that these reflections originate from narrow peaks in conductivity about 0.5 m wide. Interestingly, the strong signal in the short pulse at 2035 m is not 25
reproduced in the synthetic data. In comparison to the reflection at 1865 m of the short pulse, which is caused by a peak with a maximum conductivity of 38 µS m−1on
TCD
1, 1–16, 2007Internal RES reflector originating from COF
O. Eisen et al. Title Page Abstract Introduction Conclusions References Tables Figures ◭ ◮ ◭ ◮ Back Close Full Screen / Esc
Printer-friendly Version Interactive Discussion
EGU
a background conductivity of 15 µS m−1, one would expect a conductivity peak of comparable size also at 2035 m. However, the conductivity profile merely displays a peak of 24 µS m−1on a background of 17 µS m−1at this depth. Peaks of this size appear regularly in the conductivity profile, without causing strong reflections, neither in the short pulse nor in the synthetic trace. Missing data, rejected in the DEP quality check, 5
could mask a prominent conductivity peak. Nearest sections of data gaps longer than 0.5 m (a typical width of strong conductivity peaks) are located at 2026.26–2027.32, 2028.29–2028.81, 2038.90–2039.93, and 2040.03–2040.65 m. Each of these gaps is further away from the reflector’s depth of origin than its depth accuracy of less than 1 m (Eisen et al.,2006). We therefore exclude that a single peak in conductivity causes the 10
reflection in the short pulse trace at 2035 m.
Another possibility would be that interference of partial reflections at several peaks within one pulse length occurs. However, referring to the reflection’s counterpart in the long-pulse data, it would be surprising that a series of small conductivity peaks of just 5–10 µS m−1above a background of 15–20 µS m−1would allow for coherent interference 15
in both pulse lengths to produce the narrow and dominant reflections. We therefore also exclude the possibility that the reflections at 2035 m in both RES traces are caused by changes in conductivity, and thus the imaginary part ε′′of the dielectric constant.
The only other possibility for reflector origin is the real part ε′. At these depths, changes in density are not present, as air bubbles already turned into air hydrates. 20
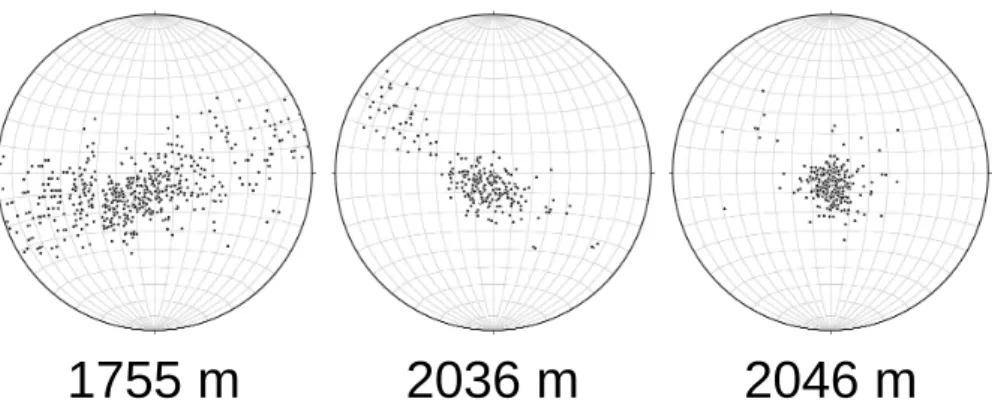
Consequently, one would expect a constant permittivity profile, and also a constant permittivity. The noise seen in the profile of about 0.05 on the sub-meter scale (Fig.3) is attributed to measurement noise of the DEP bench. We therefore cannot use the permittivity profile to determine the reflection origin. The remaining possibility to cause a change in ε′ are changes in COF. The Schmidt diagrams show a transition from a 25
vertical girdle-type to a single-maximum fabric with c-axes clearly concentrated around the vertical at 2025–2045 m depth (Fig.4). The eigenvalues of the distribution of c-axes (Fig.3) show this transition very clearly in the two largest components λ2 and λ3 of
TCD
1, 1–16, 2007Internal RES reflector originating from COF
O. Eisen et al. Title Page Abstract Introduction Conclusions References Tables Figures ◭ ◮ ◭ ◮ Back Close Full Screen / Esc
Printer-friendly Version Interactive Discussion
EGU
the horizontal sections is only slightly smaller. However, as horizontal sections were measured almost 50 m apart, we cannot determine from these over which depth range the narrow transition actually occurs.
The distribution of c-axes allows us to calculate the permittivity components. FollowingFujita et al.(2006), the effective permittivity in the direction of the ellipsoid’s 5
principle components ˆei can be determined from the eigenvalue λi by ε
′ i=ε ′ ⊥+∆ε ′ λi. In the present case, the principle component ˆe3is very close to the vertical below 1700 m depth (Fig.4), and ˆe1,2lie in the horizontal xy-plane. The principle components ˆei are therefore approximately aligned with the orthogonal coordinates x, y, z.
The change in COF between 2025 and 2045 m observed in the vertical 10
sections results in a change in the permittivity components, δ(ε′x, ε′y, ε′z) =∆ε′(0.6, 21.1,−20.5) 10−2=(0.2, 7.4, −7.2)10−3. This change occurs over 20 m, well within the width of the long pulse. The radar wave propagates in the vertical direction, so only δε′x,y can cause a reflection. Following Paren (1981) and approximating
δε′y ≫ δε′x, this corresponds to a reflection coefficient of –64.5 dB. Considering the
15
change from 2035 to 2045 m, a distance relevant for the short pulse, the reflection coefficient amounts to –68.8 dB.
The nearby reflections at 2080 m, appearing for both pulse lengths, provide a plausibility check for the hypothesis that the change in COF is indeed strong enough to cause reflections. As shown by the synthetic trace, the reflection origin is the 20
conductivity peak at 2080 m with a height of 37 µS m−1. The reflection coefficient corresponding to this peak results as –75.7 dB at 150 MHz, about 7–12 dB smaller than the reflection coefficient resulting from the change in COF. The smaller reflection coefficient is consistent with the fact that the reflections’ maximum peak power at 2080 m are smaller than those at 2035 m. We can therefore indeed attribute the origin 25
of the observed reflections at 2035 m to the change in COF, which is strong enough and occurs over a short enough distance to cause the strong reflections in the short and long pulse data.
TCD
1, 1–16, 2007Internal RES reflector originating from COF
O. Eisen et al. Title Page Abstract Introduction Conclusions References Tables Figures ◭ ◮ ◭ ◮ Back Close Full Screen / Esc
Printer-friendly Version Interactive Discussion
EGU
conductivity reflectors at a depth of 1865 and 2080 m at the drilling site, but displays stronger variations in reflection magnitude (Fig. 2). In the 600 ns pulse data, the conductivity reflector at 1865 m is dominant, also the radargram contains more noise than the 60 ns data. Both conductivity reflectors can clearly be tracked over the whole section of the 60 ns pulse in Fig.2. The COF-reflector seems to be continuous in the 5
600 ns data as well, also only of very low quality. In contrast, it can only be tracked between –3 km and 2.5 km in the 60 ns data. It is very strong on the downstream side of the anticline between –3 and 1.5 km. Further upstream from the anticline, it fades away, with several strong reflectors appearing within 20 m above it. Downstream from the drill site, it starts to fade away at 1.5 km, and is interrupted and lost in the 10
syncline starting around 3 km. The different characteristics of the 60 ns and 600 ns pulse emphasize that care has to be taken when interpreting long-pulse radar data, as reflector characteristics and mechanisms could change within the pulse length without resulting in obvious changes in the reflectivity or depth. The variation of reflection magnitude of the COF-reflector suggests that fabric changes are less continuous than 15
conductivity characteristics, as they are susceptible to variations of internal stresses, e.g. between upstream and downstream sides of subglacial bedrock variations.
4 Conclusions
The combination of ice-core profiles of COF and conductivity with RES data of different pulse lengths in our approach identifies the origin of a defined continuous internal 20
reflector as a sharp transition in COF, from a girdle-type to a single-maximum fabric over just few tens of meters. This finding goes beyond previous analysis, which related RES signals to COF, but did not provide a direct comparison of nearby in-situ data of COF. We showed that, even at short pulse lengths, the width of the COF-related reflector is comparable to reflectors stemming from conductivity peaks, 25
limited by the RES pulse length. The spatial variation of the COF-reflector in depth is parallel to other isochronous reflectors. Both observations imply that care has to
TCD
1, 1–16, 2007Internal RES reflector originating from COF
O. Eisen et al. Title Page Abstract Introduction Conclusions References Tables Figures ◭ ◮ ◭ ◮ Back Close Full Screen / Esc
Printer-friendly Version Interactive Discussion
EGU
be taken when correlating ice-core data with internal reflectors if only single-frequency single-polarization RES data are available.
The identification of a single change in COF as the origin of a strong individual internal reflector opens new possibilities for understanding ice dynamics. The fabric properties can be extrapolated along the reflector, as long as it is continuously trackable 5
in the RES profile. Determination of the internal distribution of stresses can thus go beyond the point information provided by ice cores. Ice-dynamic models can likewise utilize the reflector as an ancillary condition. As the rheology of a girdle-type fabric differs from those of a single-maximum fabric, the reflector indicates a boundary of different rheological regimes above and below the reflector within the ice sheet. 10
A remaining challenge lies in exclusively using remote-sensing data, like RES or seismics, to discriminate physical properties from the ice sheet’s surface, without requiring in-situ information from ice cores. By providing characteristic observations of the forward relation of changes in COF and reflectivity, this study provides another step towards solving the inverse problem, which should eventually be used to determine 15
continuous profiles of vertical and lateral physical properties.
Acknowledgements. This work is a contribution to the European Project for Ice Coring
in Antarctica (EPICA), a joint European Science Foundation/European Commission (EU) scientific programme, funded by the EU and by national contributions from Belgium, Denmark, France, Germany, Italy, The Netherlands, Norway, Sweden, Switzerland, and the UK. 20
Preparation of this work was supported by an “Emmy Noether”-scholarship of the Deutsche Forschungsgemeinschaft grant EI 672/1 to O.E.
References
Bogorodsky, V., Bentley, C., and Gudmandsen, P.: Radioglaciology, D. Reidel Publishing Company, Dordrecht, Holland, 1985.2
25
Doake, C. S. M., Corr, H. J. F., and Jenkins, A.: Polarization of radio waves transmitted through Antarctic ice shelves, AG, 34, 165–170, 2002. 3
TCD
1, 1–16, 2007Internal RES reflector originating from COF
O. Eisen et al. Title Page Abstract Introduction Conclusions References Tables Figures ◭ ◮ ◭ ◮ Back Close Full Screen / Esc
Printer-friendly Version Interactive Discussion
EGU
Dowdeswell, J. A. and Evans, S.: Investigations of the form and flow of ice sheets and glaciers using radio-echo sounding, Rep. Prog. Phys., 67, 1821–1861, 2004. 2
Durand, G., Gillet-Chaulet, F., Svensson, A., Gagliardini, O., Kipfstuhl, S., Meyssonnier, J., Parrenin, F., Duval, P., and Dahl-Jensen, D.: Change of the ice rheology with climatic transitions – implications for ice flow modelling and dating of the EPICA Dome C core, Clim. 5
Past, 3, 155–167, 2007,
http://www.clim-past.net/3/155/2007/. 2
Eisen, O., Wilhelms, F., Steinhage, D., and Schwander, J.: Improved method to determine RES-reflector depths from ice-core profiles of permittivity and conductivity, J. Glaciol., 52, 299–310, 2006. 4,5,6,7
10
Fujita, S., Maeno, H., Uratsuka, S., Furukawa, T., Mae, S., Fujii, Y., and Watanabe, O.: Nature of radio echo layering in the Antarctic ice sheet detected by a two-frequency experiment, J. Geophys. Res., 104, 13 013–13 024, 1999.3
Fujita, S., Matsuoka, T., Ishida, T., Matsuoka, K., and Mae, S.: A summary of the complex dielectric permittivity of ice in the megahertz range and its application for radar sounding of 15
polar ice sheets, in: The Physics of Ice Core Records, edited by Hondoh, T., pp. 185–212, Hokkaido University Press, 1 edn., 2000. 3
Fujita, S., Matsuoka, K., Maeno, H., and Furukawa, T.: Scattering of VHF radio waves from within an ice sheet containing the vertical-girdle-type ice fabric and anisotropic reflection boundaries, Ann. Glac., 37, 305–316, 2003. 3
20
Fujita, S., Maeno, H., and Matsuoka, K.: Radio-wave depolarization and scattering within ice sheets: a matrix-based model to link radar and ice-core measurements and its application, J. Glaciol., 52, 407–424, 2006. 3,8
Hargreaves, N. D.: The radio-frequency birefringence of polar ice, J. Glaciol., 21, 301–313, 1978. 3
25
Harrison, C. H.: Radio echo sounding of horizontal layers in ice, J. Glaciol., 12, 383–397, 1973.
2
ISMASS Committee: Recommendations for the collection and synthetis of Antarctic Ice Sheet mass balance data, Global and Planetary Change, 42, 1–15, 2004. 2
Matsuoka, K., Furukawa, T., Fujita, S., Maeno, H., Uratsuka, S., Naruse, R., and Watanabe, O.: 30
Crystal orientation fabrics within the Antarctic ice sheet revealed by a multipolarization plane and dual-frequency radar survey, J. Geophys. Res., 108, 2499, doi:10.1029/2003JB002425, 2003. 3
TCD
1, 1–16, 2007Internal RES reflector originating from COF
O. Eisen et al. Title Page Abstract Introduction Conclusions References Tables Figures ◭ ◮ ◭ ◮ Back Close Full Screen / Esc
Printer-friendly Version Interactive Discussion
EGU
Matsuoka, K., Uratsuka, S., Fujita, S., and Nishio, F.: Ice-flow induced scattering zone within the Antarctic ice sheet revealed by high-frequency airborne radar, J. Glaciol., 50, 382–388, 2004. 3
Nixdorf, U., Steinhage, D., Meyer, U., Hempel, L., Jenett, M., Wachs, P., and Miller, H.: The newly developed airborne RES-system of the AWI as a glaciological tool, Ann. Glaciol., 29, 5
231–238, 1999. 4
Paren, J. G.: PRC at a dielektrical interface, J. Glaciol., 27, 203–204, 1981.8
Paren, J. G. and Robin, G. d. Q.: Internal reflections in polar ice sheets, J. Glaciol., 14, 251–259, 1975. 2
Robin, G. d. Q., Evans, S., and Bailey, J. T.: Interpretation of radio echo sounding in polar 10
ice sheets, in: Philosophical Transactions of the Royal Society of London, vol. 146 of A, pp. 437–505, Royal Society of London, 1969. 2
Wallbrecher, E.: Methoden zum quantitativen Vergleich von Regelungsgraden und Formen strukturgeologischer Datenmengen mit Hilfe von Vektorstatistik und Eigenwertanalyse, N. JB. Geol. Paläontol. Abh., 159, 113–149, 1979. 6
15
Wilhelms, F.: Explaining the dielectric properties of firn as a density and conductivity mixed permittivity (DECOMP), Geophys. Res. Letters, 32, L16501, doi:doi:10.1029/ 2005GL022808, 2005.5
Wilson, J., Russell-Head, D. S., and Sim, H. M.: The application of an automated fabric analyzer systm to the textural evolution of folded ice layers in shear zones, Ann. Glaciol., 37, 7–17, 20
TCD
1, 1–16, 2007Internal RES reflector originating from COF
O. Eisen et al. Title Page Abstract Introduction Conclusions References Tables Figures ◭ ◮ ◭ ◮ Back Close Full Screen / Esc
Printer-friendly Version Interactive Discussion
EGU
Fig. 1. Location of study area in Antarctica, location of EDML drill site and RES flight line of
TCD
1, 1–16, 2007Internal RES reflector originating from COF
O. Eisen et al. Title Page Abstract Introduction Conclusions References Tables Figures ◭ ◮ ◭ ◮ Back Close Full Screen / Esc
Printer-friendly Version Interactive Discussion
EGU
Fig. 2. Unfiltered 10-fold stack RES profile recorded with the 600 ns pulse (022150, left) and
60 ns pulse (023150, right). Ordinates are the same for both panels: two-way traveltime (TWT) on left ordinate is uncorrected recording time, right ordinate refers to depth below surface; color code indicates signal magnitude (increasing white-blue-black); red arrows indicate first break of internal reflector of interest for both pulses at the drill site; reflections from Kohnen station (at profile center) cause the hyperbola leg between –3.8 and –2.3 km; white vertical line at 1.3 km is caused by system dropout. Ice flow is from left to right (ESE–WNW), the profile runs approximately parallel to a transient ice divide.
TCD
1, 1–16, 2007Internal RES reflector originating from COF
O. Eisen et al. Title Page Abstract Introduction Conclusions References Tables Figures ◭ ◮ ◭ ◮ Back Close Full Screen / Esc
Printer-friendly Version Interactive Discussion
EGU
Fig. 3. Comparison of radar data and ice-core profiles at the EPICA-DML drilling site. From
left to right: measured RES trace for two pulse widths from profiles 022150 (600 ns pulse) and 023150 (60 ns pulse); DEP-based synthetic RES trace for 60 ns pulse; DECOMP-corrected DEP conductivity (σ); DECOMP-corrected DEP-permittivity (ε′, with the permittivity of pure ice as upper bound); eigenvalues of crystal orientation tensor along horizontal and vertical sections. The black synthetic trace is based on original conductivity data (black σ-curve); on top the red synthetic trace is plotted, based on the DEP data with removed conductivity peaks (green σ-curve); peaks originating from conductivity thus appear black, emphasized by dotted horizontal lines; dashed horizontal lines connect depth of strong RES reflector with transition depth of changes in COF.
TCD
1, 1–16, 2007Internal RES reflector originating from COF
O. Eisen et al. Title Page Abstract Introduction Conclusions References Tables Figures ◭ ◮ ◭ ◮ Back Close Full Screen / Esc
Printer-friendly Version Interactive Discussion
EGU
1755 m
2036 m
2046 m
Fig. 4. Schmidt diagrams of vertical sections at three depths, showing the orientation of c-axes
and the transition from girdle-type to increased single-maximum fabric. The orientations have been rotated into the horizontal xy-plane. The majority of c-axes at 2046 m are oriented in the vertical.