HAL Id: insu-03206547
https://hal-insu.archives-ouvertes.fr/insu-03206547
Submitted on 23 Apr 2021
HAL is a multi-disciplinary open access
archive for the deposit and dissemination of
sci-entific research documents, whether they are
pub-lished or not. The documents may come from
teaching and research institutions in France or
abroad, or from public or private research centers.
L’archive ouverte pluridisciplinaire HAL, est
destinée au dépôt et à la diffusion de documents
scientifiques de niveau recherche, publiés ou non,
émanant des établissements d’enseignement et de
recherche français ou étrangers, des laboratoires
publics ou privés.
The wave normals of magnetospheric chorus emissions
observed on board GEOS 2
M. Hayakawa, Y. Yamanaka, Michel Parrot, François Lefeuvre
To cite this version:
M. Hayakawa, Y. Yamanaka, Michel Parrot, François Lefeuvre. The wave normals of magnetospheric
chorus emissions observed on board GEOS 2. Journal of Geophysical Research, American Geophysical
Union, 1984, 89 (A5), pp.2811. �10.1029/JA089iA05p02811�. �insu-03206547�
JOURNAL OF GEOPHYSICAL RESEARCH, VOL. 89, NO. A5, PAGES 2811-2821, MAY 1, 1984
The Wave Normals of Magnetospheric Chorus Emissions
Observed on Board GEOS
2
M. HAYAKAWA,
1'2 Y. YAMANAKA,
1'3 M. PARROT,
2 AND F. LEFEUVRE
2
The wave normal directions of magnetospheric chorus emissions have been analyzed by using data
from the geostationary GEOS 2 satellite which is located in the equatorial region at L = 6.6. As the
result of analyses for a specific day of December 19, 1979, chorus is found to be generated in conjunction
with substorms and at local times from around midnight to afternoon. Two types of chorus are ob-
served: impulsive burstlike and rising tone. The chorus during midnight to late morning hours is impulsive, and at local times from noon to dusk we notice an increase in the occurrence of rising tone chorus. The chorus spectra have shown the importance of the characteristic frequency of fn/2 (fn is the electron gyrofrequency). We notice the impulsive chorus only in the lower band (f < fn/2; f is the emission frequency) at local times from --•0300 to --•0700, and then at LT = -,,0800 to --• 1600 the
predominant frequency of the emissions, whether impulsive or rising tone, lies in the upper band (f > fn/
2) with infrequent occurrence in the lower band, and there is obviously no correlation between the elements in both bands. However, there are several intense tones which seem to be correlated in both
bands for the strong two-banded impulsive chorus emissions observed only at LT •_ 0800. This corre-
lation might be related with a notch in chorus risers at f•_fn/2 caused by Landau damping, as pre-
viously suggested. The wave normals are determined by using only the magnetic field data. The direction
finding studies have been made for impulsive and rising tone chorus, separately, which have yielded
different results. The lower band is discussed first. The wave normals of the rising tones having values of
df/dt as normally observed are found to take very small angles (5ø-20ø). Then it is found that the rising tones with increased values of df/dt have shown larger wave normal angles of 300-45 ø. These relatively small wave normal angles for the lower band give further support to the loss cone instability as the
generation mechanism. The impulsive chorus is found to take slightly larger wave normal angles (about
5 ø ) than most rising tones. Further, it may be suggested that different types of chorus are associated with
different wave normals. Next we are concerned with the upper band chorus, whose generation mecha- nism is not well agreed upon. It is shown that the impulsive chorus in the upper band is generated with
its wave normal close to the oblique resonance cone. This suggests that the upper band chorus is
quasi-electrostatic, and it is furthermore confirmed by the estimated ratio, clBI/IEI (IEI and IBI are the
total electric and magnetic field intensities; c is the light velocity). The rising tones in the upper band,
however, have indicated a difference such that the closeness of their wave normals to the oblique
resonance cone is much less distinct. An intensive comparison is made between the direction finding
results for the upper band and the theoretical mechanisms so far proposed in order to elucidate the
possible generation mechanism of the upper band chorus.
1. INTRODUCTION
Morphological features of chorus emissions throughout the
magnetosphere have been investigated by several earlier work-
ers, including Oliven and Gurnett [1968] and Taylor and Gur- nett [1968] based on the INJUN satellites, Dunckel and Helli- well [1969] based on the OGO 1 VLF measurements, and Russell et al. [1969] and Russell and Holzer [1970] using the
OGO 3 data. These studies have revealed that chorus is ob-
served mainly at L values between the plasmapause and mag-
netopause and at all local times (LT), but predominantly in the dayside magnetosphere.
The midnight sector has recently been considered to be an
especially interesting region for chorus because chorus is gen-
erated during magnetospheric substorms and storms [Tsuru-
tani and Smith, 1974, 1977; Thorne et al., 1974, 1977; Haya- kawa et al., 1977] by freshly injected electrons [Anderson and Maeda, 1977; Tsurutani and Smith, 1977; Thorne et al., 1977;
Tsurutani et al., 1970; lsenberg et al., 1982]. The emissions are
further found to be localized to the magnetic equator [Russell et al., 1969; Burtis and Helliwell, 1969; Tsurutani and Smith,
x Research Institute of Atmospherics, Nagoya University.
2 Laboratoire de Physique et Chimie de l'Environnement, Centre
National de la Recherche Scientifique.
3 Now at Radio Research Laboratories, Tokyo.
Copyright 1984 by the American Geophysical Union.
Paper number 4A0058. 0148-0227/84/004A-0058505.00
1974, 1977], the region where the wave growth rate is ex- pected to be largest.
An interesting property of the frequency spectrum of chorus has been found by Tsurutani and Smith [1974], who have shown that chorus is composed of two bands of frequencies: one above one-half the electron gyrofrequency (f•/2) (the upper band) and the other below f•/2 (the lower band). This characteristic two-band structure has been found to be very
persistent for chorus and has been experimentally investigated
in detail by Maeda et al. [1976] and Anderson and Maeda [1977].
The lower band chorus has recently been interpreted as being generated by substorm electrons with an anisotropic loss cone distribution, and the theoretical aspects are well explained by the theory of Kennel and Petschek [1966]
[Burton and Holzer, 1974; Anderson and Maeda, 1977; Haya-
kawa et al., 1977; Tsurutani et al., 1979; lsenber•t et al., 1982]. On the other hand, the generation mechanism of the chorus in the upper band is not well agreed upon. When the two-band structure was originally discovered, Tsurutani and Smith
[1974] ascribed the f•/2 gap to the damping mechanism be-
cause chorus tones which cut across the f•/2 gap could clearly
be observed. Maeda et al. [1976] have found that there is no
coherence between the upper and the lower band chorus, and
they have postulated that the upper band is locally generated whistler mode waves near the satellite and the lower band is whistler mode waves generated in regions of lower magnetic
field farther out in the magnetosphere, followed by the propa-
gation to the satellite, yielding a cutoff at f•/2. Curtis [1978]
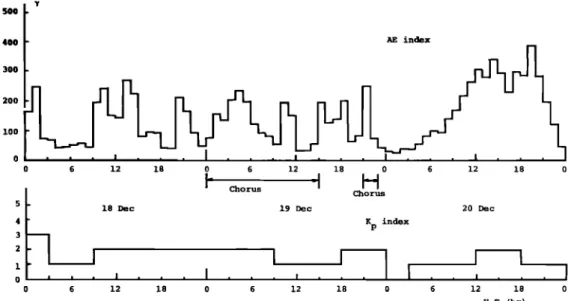
¾ 500 400 AE index
300
•_•
b__LltL/!_ r
loo L o , . , [ . . , • , , , I . . , I . 0 6 12 18 0 6 12 18 0 6 12 18 5 18 Dec 4 2 1 0 6 12 I Ii Chorus -I
ChorusH
19 Dec 20 Dec K index PL
I
18 0 6 12 18 0 6 12 18 0 U.To (hr)Fig. 1. Temporal variation of geomagnetic activity (AE and Kp indices) during a few days around December 19, 1979.
The time interval when chorus was detected is also indicated.
has presented an interpretation that the upper and lower
bands
in the case
off, (electron
plasma
frequency)
less
than
f,
are both generated locally, the lower being represented by
whistler mode and the upper band being described by ordi-
nary mode. Burris and Helliwell [1976] have shown by de-
tailed ray tracing studies the ability of propagation effects to
possibly produce a bimodal distribution of chorus emissions.
Information concerning the distribution of wave normal
vectors of chorus is considered to be a valuable tool, not only
in providing further evidence for the existing generation
theory but also in suggesting new generation mechanisms.
Wave normals of chorus mainly in the off-equatorial region in
the outer magnetosphere have been extensively studied by
Burton and Holzer [1974], but the analyses of wave normal
directions just at the equatorial plane, the likely source region,
such as were done by Cornilleau-Wehrlin et al. [1976], are
important to obtain direct evidence of the generation mecha-
nism.
In the present paper, wave normal directions of mag- netospheric chorus observed at the magnetic equator have
been determined with data from the geosynchronous GEOS 2
satellite located at L = 6.6. The analyses have been carried out
for both the upper and the lower band chorus by means of our
newly developed method in which we apply the maximum likelihood estimation to the observed spectral matrices. Sec-
tion 2 deals with the data base used for the direction findings,
and we present the method of our direction finding to deter-
mine the wave normal directions. Then in section 3 we de- scribe the characteristics of the observed emissions. Section 4
is concerned with the final results of direction findings of chorus in both bands. Finally, we discuss the generation
mechanisms of both band chorus in section 5. 2. DATA BASE AND THE DIRECTION FINDING
TECHNIQUE
For the detailed study of electromagnetic waves below the
electron gyrofrequency f,, several sensor combinations and
different modes of on-board data processing have been used.
For the detailed description of the GEOS S-300 experiment,
see Jones [1978] or S-300 experimenters [1979]. Here, the
data we are treating have been collected by the so-called S-300
"survey mode" (6 min of identical operations in passive and
active modes every hour) on the geosynchronous satellite
GEOS 2, which is located in the equatorial region at L = 6.6.
Since the electric field components which are measured by
small electric antennas [S-300 experimenters, 1979] are not
very sensitive and, above all, are strongly perturbed over one
half of each 6-s spin cycle [Wrenn, 1978], we only use the data
from three magnetic sensors. The signals are subjected to two
on-board analyses: the step frequency analyzers (SFA's) and
the correlator. The SFA's, which may be connected to any
sensor combination, have a bandwidth of 300 Hz and are
swept in frequency in the range 0-77 kHz. Before being tele-
metered to the ground, the signals are transposed in fre- quency, passed through identical low-pass filters at 450 Hz,
102 -- ,• 10 5 0 2 4 6 8 2 14 16 0 22 • 3 i i i i i i i i i i i i i U.T. (hr)
Fig. 2. Temporal variation of the electron plasma frequency f•, and
HAYAKAWA ET AL.' DIRECTION FINDING OF MAGNETOSPHERIC CHORUS 2813
..
BI
GEOS-S300 SURVEY MODE 19/12/1979 2 H 0 MN 7 SEC
POSITION
GEOGRAPHIC GEOMAGNETIC
LAT 0.3 DEG -0.4 DEG LONG 23.7 DEG 93.4 DEG
DIST 6.59 R L 6.60 R LT 3.34 H
FPE = 14.14 kHz
FHE = 2.12 kHz
GEOS-S300 SURVEY MODE 19/12/1979 6 H 0 MN 7 SEC
POSITION
GEOGRAPHIC GEOMAGNE TIC
LAT 0 . 2 DEG -0 • 6 DEG
LONG 23 . 9 DEG 93 . 6 DEG
DIST 6.60 R L 6.60 R LT 7.77 H FPE = 13 80 kHz FHE = 2.60 kHz
•.• .
.?:•:
....
•...
:- . .. .: . .:.-- .... : -:!.-:.: -... '.-. -...: • .' c:--- ': .... -' •' ...-- ' ---:" ' :- ' 0.5 . 0 ... - ,..-...•: .... ... -. ... ... , • ,O 1't0¾, = .159E-0•t rtAI, = .8•4E-06 20 s
FiE. 3. Two
examples
of impulsi,e
(or burstlike)
chorus.
(•) UT = 02• (LT = 0320:24).
The
chorus
in the
lower
band
with
its uppermost
frequency
sometimes
extendinE
above
•,/2. (•) UT = 0600
(LT = 0746:12).
The two-banded
chorus
emissions with a conspicuous missin8 frequency at •,/2; the chorus emissions in both bands appear to be not correlated
with each other.
a
b
and sampled at 1.488 kHz. The correlator output, after suit-
able Fourier transformation on the ground, yields a spectral
resolution of 2.5 kHz (ELF part of the survey mode) or 5.0
kHz (VLF part). The direction findings are performed from
the magnetic SFA data in the VLF part. For the sake of a
better visualization, high-resolution spectrograms (2.5 kHz)
taken during the ELF part are represented here, with the
consequence that they do not exactly coincide with the SFA
data. In any case the VLF part follows the ELF one, and the
time shift is always less than 22 s. A few seconds after the end
of the VLF part, the plasma frequency is estimated suc-
cessively by two active experiments: S-301 and S-304 [S-300
experimenters,
1979; Decreau
et al., 1978]. The two sets of
plasma frequencies are used either as a cross-check or as an
alternative when one experiment fails.
After looking at many survey mode data from the GEOS 2
satellite, we selected one specific day, December 19, 1979, for
further detailed direction finding analyses, because we had
recorded a lot of chorus on this day. Some of the spec-
trograms will be presented in the next section.
Wave normal directions are estimated from the SFA data,
using the method developed by Buchalet and Lefeuvre [1981].
First, the signals associated with the magnetic components are
Fourier-transformed. Then, at each frequency we are con-
cerned with, we estimate a 3 x 3 spectral matrix consisting of
the mean autopower spectrum of each of the three compo-
nents and the mean cross-power spectra between two of the
three components. Before carrying out the direction finding,
we have to determine the model of propagation (one- or two-
direction model) by means of the three eigenvalues, ;•, ;•2, and
;•3 (ranked
in decreasing
magnitude),
of the observed
spectral
matrix at each frequency. The criterion in distinguishing be-
tween the one- and two-direction model is rather arbitrary; we
2814 HAYAKAWA ET AL.' DIRECTION FINDING OF MAGNETOSPHERIC CHORUS
'GEOS'-S300 SURVEY MODE 19/1.2/1979 -9 H '0 MN 6 SEC
POS. IT.ION
-.GEOGRAPHIC 'GEOMA/G'NETIC
LAT -0.,.! DE'G --.0•8 DEG
LONG 23.9 DEG 93., 6 DEG
DIST 6.-.661 R L 6.61 R LT !0.96 .•{
FPE' = 14 -, 7'4 :' ]•H.Z.. F'HE ,'= 2,74 kHz
a
t<HZ
GEOS.-S300 SURVEY MODE 19-/12/1979
POSITION
GEOGRAPHIC GEOMAGNETIc
LAT -0 . 3 DEG ~1 0 'DEG-. LONG 23 o 9 DEG 93 ...6 'DEG'-
DIST 6.61 R L 6..-61 R 13 H 0' 'MN 7 .SEC LT 14.• 84.. H. '.F'P'E .... 2'2 •'6'1 kHz FHE -.-.= 12.6.5 k"Hz
b
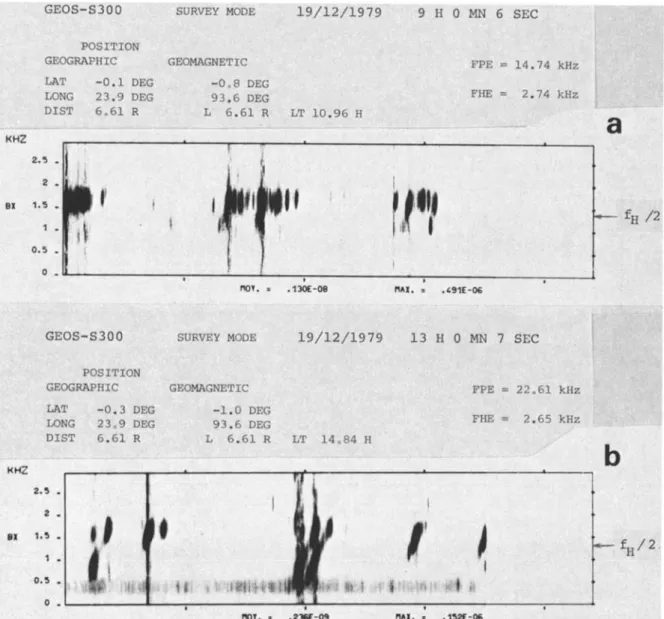
Fig. 4. (a) UT = 0900 (LT = 1057:36). Rising tone chorus emissions are seen in the upper band, being simultaneous to
the impulsive chorus; df/dt ',, 5.4 kHz/s. (b) UT = 1300 (LT = 1450:24). Several examples of rising tone chorus are
detected not only in the upper band, but also in the lower band' df/dt ',, 1.3-1.9 kHz/s.
12/2x and//= 13/22, the thresholds for which are chosen de-
pending on the degree of confidence required [Buchalet and
Lefeuvre, 1981; Lefeuvre et al., 1982], and, in other cases, the
degree of polarization; 2x/(2x + 22 q- 23)> n (=0.90-0.95) is
used [Lefeuvre et al., 1982]. In the present paper we adopt the
former criterion such that if • < 0.1, the field is considered to
be a single plane wave, and if • > 0.1 and//< 0.4, we assume
the two-plane wave model. After determining the propagation
model, the maximum likelihood concept is made use of to
deduce the wave normal directions of emissions [Buchalet and
Lefeuvre, 1981]. One more thing we have to mention here is
the assumption that the propagation of waves is described by
the cold plasma theory, which will be important in interpret-
ing the results in sections 4 and 5.
In what follows, we adopt a Cartes]an coordinate system
O•yz where the z axis is parallel to the earth's magnetic field
Bo, Ox is in the magnetic meridian plane containing the point
of observation and the x axis is directed away from the earth,
while Oy completes the orthogonal set and the y axis is east-
ward. The wave normal direction (k) is characterized by the
polar angle 0 between k and Bo and the azimuthal angle
the origin of which is in the meridian plane.
3. CHARACTERISTICS OF OBSERVED CHORUS
One specific day, December 19, 1979, was selected, and
Figure 1 illustrates the temporal variation of the geomagnetic
activity (AE and Kp indices) during a period of a few days
around that day. The time interval when chorus was recorded
on December 19 is also indicated in the figure. Figure 1 dem-
onstrates that a lot of successive substorms and their associ-
ated particle injections occur on December 18 and 19, and it is
apparent that the occurrence of chorus is substorm related, as
is already mentioned in the introduction.
Figure 2 shows the diurnal variation of the plasma parame-
ters fp and f, measured by the satellite at the equator. The
details
of the measurements
of fp and f, are mentioned
by
S-300 experimenters [1979], Decreau et al. [1978], and Etcheto
and
Bloch
[1978].
As can be seen
from the figure,
fv is much
HAYAKAWA ET AL.' DIRECTION FINDING OF MAGNETOSPHERIC CHORUS 2815
is always below f, and above the lower hybrid resonance
frequency, there exists only one magnetoionic mode, i.e., the
whistler mode.
The frequency-time characteristics of VLF emissions are
considered to be related to nonlinear processes associated with
the generation mechanism. Chorus is defined, in the present
paper, as the signal containing discrete structures (or elements)
and not necessarily risers. Two types of chorus are discussed
in the present paper. The first type is an impulsive, burstlike chorus which appears as a vertical trace in the spectrum. Two examples of this type are shown in Figure 3. The other is the normal rising tone chorus whose spectral trace exhibits an increase in frequency with time. Two examples are given in Figure 4. Rising tone chorus is very popular and predominant and is reported by many workers cited in the introduction. Impulsive chorus, too, is not unpopular and unusual, because it is relatively often detected on board the GEOS satellites
[Gibbons and Ward, 1981; Cornilleau-Wehrlin et al., 1978] and
on OGO 5 [Cornilleau-Wehrlin et al., 1976]. Other types, such
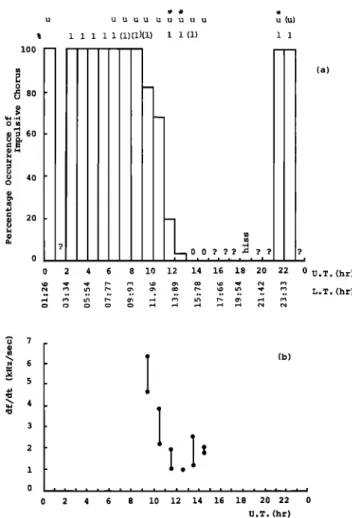
as falling tones and flat tones, are recorded as well by Tsuru- tani and Smith, [1977] and Cornilleau-Wehrlin et al. [1976]. Figure 5a illustrates the temporal variation of the percentage
occurrence of impulsive chorus, which is roughly estimated by
counting the elements in the survey mode spectrograms such
as are shown in Figures 3 and 4. Chorus has been detected in the UT intervals 0000-1400 (the corresponding LT is 0115:36-1546:48) and 2100-2200 (LT = 2222:12-2319:48). During the LT interval in between, some VLF noises are ob- served, but we cannot identify them as chorus. Thus we tend to see chorus from around midnight to daytime, but no chorus between 1600 and 2100 LT. This distribution of chorus as a
function of LT seems to be in good agreement with previous
studies by Tsurutani and Smith [1974, 1977], Thorne et al. [1974, 1977], and Cornilleau-Wehrlin et al. [1978]. This LT
dependence of chorus occurrence can be understood as follows
[e.g., Tsurutani and Smith, 1977]. Substorm electrons are in- jected into the nightside magnetosphere at approximately
local midnight, and because of the strong inward convection
we expect an increased particle flux and pitch angle ani- sotropy, leading to the wave generation. Further, the chorus from 0700 to 0900 LT is intensified (although this is not
shown in the text), which can be explained by enhanced wave-
particle interactions in this sector due to an increase in the
ambient plasma density from the sunlit ionosphere.
At the top of Figure 5a we have indicated more detailed information on the chorus band. When only the notation I is
designated, we have had the emissions only in the lower band,
and the reverse situation is expressed by u. When the emis-
sions take place predominantly in the upper band, with infre-
quent emissions in the lower band, the less predominant band
is indicated in parentheses. The notation (u) means the reverse
situation. Figure 3a illustrates a series of impulsive chorus elements only in the lower band with their uppermost fre- quency sometimes extending into the upper band, which are observed at UT = 0200. When the two bands are simulta- neously recorded, with less numerous occurrence in either of the two bands (although no good examples of these are illus-
trated in the text, one can find this phenomenon in Figure 4b),
we have found that there is no correlation of the elements in
both bands. Simultaneous occurrence of strong emissions in
both bands is obtained only at UT = 0600 (LT = 0746:12), and an example is shown in Figure 3b. A close inspection
suggests that there are several intense tones which seem to be
correlated in the upper and lower bands. As far as the corre-
u u u u u u 1•1 u • 60 u 40 • 2o % 1 1 1 1 1 (1)(1)(1) 1 1 (!) 100 ? 0 .... U (U) 1 1 2 4 6 8 10 12 ... .. (a) 0 0 ? ?? •: ? ? ? i i i • ß i , 14 16 15 20 22 0 U.T. (hr) • ... un • • L.T (hr) 1 o o (b) 2 4 6 8 10 12 14 16 18 20 22 0 U.T. (hr)
Fig. 5.. (a) Temporal variation of the percentage occurrence of
impulsive chorus, as estimated from the spectrograms of the survey
mode. The zeros at two UT's indicate that no impulsive chorus has been recorded and that all of the observed chorus emissions are rising tones. The question marks for some UT's mean that the observed waves cannot be identified as chorus for certain. At the top we add the information on the chorus band; u and I mean the upper and the
lower band, respectively. For UT = 0600 we observe the simultaneous
occurrence of strong emissions in both bands, the example being
shown in Figure 3b. When u and I are simultaneously indicated, with
either of the two in parentheses, the band in parentheses is less pre-
dominant, indicating the infrequent occurrence of emissions in that
band. Then, for the UT's with asterisks, the emissions do not show any gap at f,/2, as illustrated in Figure 6. (b) Temporal variation of
the rate of frequency increase with time, df/dt, of rising tone chorus.
lation between the two bands is concerned, conflicting results
have been presented so far. No correlation has been found by
Maeda et al. [1976], but Tsurutani and Smith [1974] have
presented examples in which both bands appear to be clearly
connected except a strong extinction band at fn/2.
As the LT increases from 1100 to 1600 (UT = 0900-1400),
the percentage occurrence of rising tone chorus becomes en-
hanced, but we have to mention that the total chorus events
become less numerous. The variation of the rate of frequency
with time (df/dt) of the rising tone is summarized in Figure 5b.
The df/dt decreases abruptly from LT = 1057:36 to 1157:36,
followed by a relatively constant value (0.9-2.4 kHz/s, but predominantly •1.5 kHz/s) from 1353:24 to 1546:48 LT. Burtis and Helliwell [1976] have estimated that the medium df/dt is 0.77 kHz/s at L • 6 and that it shows some decrease with increasing L values. Thus even our smallest values of df/dt seem to be slightly larger than the value obtained by
2816 HAYAKAWA ET AL.' DIRECTION FINDING OF MAGNETOSPHERIC CHORUS GEOS--S300 POSITION GEOGRBt?HIC •AT --0.2 PEG LONG '23.'9 iDEG DIST 6 .. 61 R
SURVEY .'MODE 19/121./1979 11 H 0' MN 7 SEC
GEOF•GNETIC -0.9 'DEG 93•6 DEG . L -6,6, '.R LT 12.93 H -'FPE =' 1.8.27 kHz F..•.."•. 2 .. 7:.5' kHz 2 . 0 .
-f'lOV. = ,653[-0:3 flAX, = .9ggE--05
-*--i fH/2
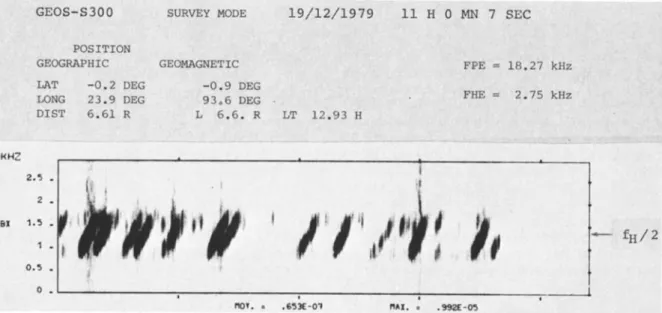
Fig. 6. Example of rising tone chorus which does not show any conspicuous change at f,/2. uT - 1100 (LT = 1157:36,
near noon)' df/dt -• 1.3 kHz/s. This kind of chorus is also recorded at UT - 1200 and 2100.
them. In Figure 4a a small number of rising tone chorus emis- sions in the upper band are detected that are simultaneous to
a larger number of impulsive chorus emissions, and their df/dt
is very large, i.e., df/dt = 5.4 kHz/s. Figure 4b presents several
rising tones mainly in the upper band, and also in the lower
band. It does not appear that the rising tone elements in both
bands are connected or correlated, just as in the case of many
impulsive chorus elements in Figure 3b. The LT dependence
of chorus structure in Figure 5a is then compared with the previous study by Tsurutani and Smith [1977], who have
stated that flat tones are detected in the evening-postmidnight
sector,
while falling
tones
are primarily
observed
in the day-
side at low L (5-6) and rising tones are also detected at L less
than 6.8.
The examples in Figures 3 and 4 have dearly demonstrated
the importance of the characteristic frequency f,/2 in the
chorus whether it is impulsive or rising tone, but some rising
tone
chorus
was observed
which
exhibt[s,•
no conspicuous
change at f,/2 (no gap at that frequency) at UT = 1100 and
i200 (LT = 1300-1400). The same phenomenon is also ob-
served for impulsive chorus at UT = 2100 (LT = 2224). The
times when ttiis kind of phenomenon is detected are designa-
ted by asterisks at the top of Figure 5a.
4. RESULTS OF DIRECTION FINDINGS
Although many chorus emissions are recorded, as seen in
Figures 3, 4, and 6, the number of emission events available
for the direction finding is not so numerous, because the
300-Hz SFA passband is stepped in frequency and it may
happen not to be sitting at the right frequency at the right
time. The grey-scale display of the spectrum of those chosen
events is made so that we can distinguish chorus from other
noises and estimate the df/dt. We then examine the time sta- tionarity of each chorus, by means of the algorithms of TREND and RUN [Bendat anti Piersol, 1971], which is the
most fundamental requirement of the present direction finding
[Lefeuvre et al., 1982], and we make the spectral matrices at
the relevant frequencies. The direction finding technique in
section 2 is applied only to chorus events with sufficient S/N
ratio and with sufficient stationarity in time.
First, the results of direction finding of impulsive chorus are
discussed. About 30 events, including both the upper and
lower band frequencies, have been successfully analyzed. A
study of eigenvalues of spectral matrices has shown that all of
the impulsive chorus events satisfy the criterion of the single-
plane wave model; in other words, the impulsive chorus is
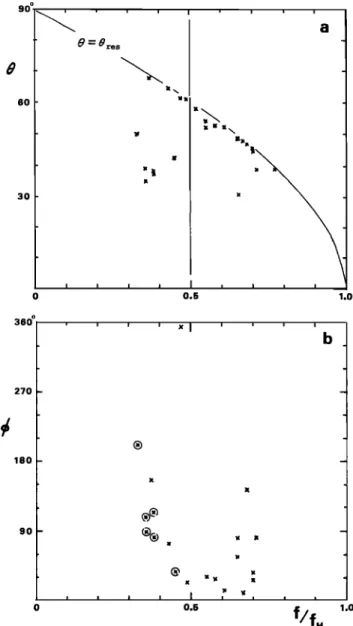
found to be composed of a single plane wave. Figure 7 illus-
trates the distribution of wave normal directions of impulsive
chorus observed from 0000 to 1200 UT and from 2100 to 2200 UT. Figure 7a refers to the 0 distribution versus emission
frequency normalized by f, (f/f,), and the corresponding dis-
tribution of •b is plotted in Figure 7b. Since we use only the
magnetic field components, there is an ambiguity of 180 ø in
the wave normal determination, and we have converted, in the
figure, all the wave normal direction into those with 0 less
than 90 ø .
Now we look at the 0 distribution in Figure 7a. Except one
cross with its 0 • 30 ø, all the crosses in the upper band are
found to be located very close to the oblique resonance cone
Ore s for the whistler mode in the cold plasma, indicated by a
solid line in the figure, though, of course, the degree of close-
ness to Ore s is different from one cross to another. Fur-
thermore, the four crosses with their 0 close to 0r• s in the lower
band obviously correspond to emissions of the upper band
extending down below f•/2. Hence we conclude that the upper
band chorus is generated with its 0 close to 0r• s.
Another group of wave normals in the lower band is easily
recognizable in Figure 7a. The 0 values of this group are
shown to lie in a range from 35 ø to 50ø; they are apparently
far away from 0r• s and have very different behaviors from
those in the upper band. Thus the waves of this group are
presumed to be excited by a mechanism different from that for
the upper band. The qb values of the emissions belonging to
this group are encircled in Figure 7b for the sake of dis-
tinguishing them from those of the previous group.
The information on the qb distribution would be useful when
the waves have propagated well away from the generation
region, being focused into the meridian plane [Thorne, 1969].
The qb distribution above f,/2 in Figure 7b may indicate that
HAYAKAWA ET AL.: DIRECTION FINDING OF MAGNETOSPHERIC CHORUS 2817
fn/2 are distributed from 0 ø to 180 ø, with some focusing
around •b _• 90 ø. The distribution in azimuth near the source
seems to depend strongly on the position of the satellite with
respect to the source, but these •b distributions might suggest, at least, that the waves have not propagated over some dis- tances, and they are generated close to the satellite or around the magnetic equator.
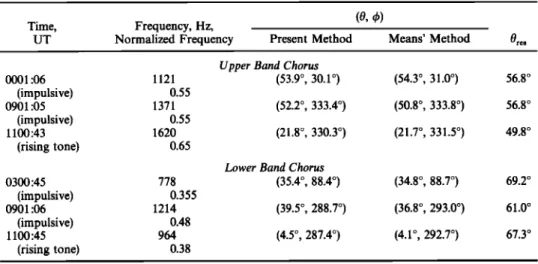
Impulsive chorus events analyzed in Figure 7 are already found to be of the one-direction model, and for this single- plane wave situation there exists an alternative method by Means [1972], on which the analyses by Burton and Holzer
[1974] are based. Table 1 demonstrates a comparison of the
results obtained by the present method with those obtained by
the Means' method for randomly selected events. The two examples in the upper and lower bands correspond to the
impulsive chorus, and the last ones correspond to the rising
tone chorus identified as the one-direction model as shown in
Figure 6. The table indicates that the discrepancy of the wave
normal directions determined by both methods is of negligible
order, the maximum difference in 0 in the table being about 3 ø
and that in •b being about 5 ø. The differences for all other
events lie within the above mentioned maximum deviations. When we take into account the experimental fact that the 0 values of the group mainly in the upper band, but extending
sometimes down below fn/2, are very close to 0 .... it suggests
that those waves are quasi-electrostatic. In order to have a
further confirmation of this point, we have examined the ratio of cIBI/IEI, where IBI and IEI are the total magnetic and electric field intensities and c is the light velocity. Figure 8 shows the distribution of the observed ratio, which indicates that there are two groups:in one the ratio is around 1.0, and in the other it is around 10. Even the high ratios around 10 are found to
be still smaller than the corresponding refractive index of the
electromagnetic whistler mode. The smaller ratio around 1.0 is
clearly indicative of the quasi-electrostatic nature of the upper
band chorus. Here we have to mention that although the
observed waves are quasi-electrostatic, their magnetic field
components are still observable, allowing us to use only the magnetic field components. Hashimoto and Kimura [1981]
have estimated that IE•.l/IE,I (ll and I denote parallel and
perpendicular to the wave normal direction, respectively) de-
creases remarkably with increasing 0 and the ratio becomes
about
10
-2 at 0 close
to 0 .... indicating
that Ell is very pre-
dominant. However, IBI/IEI decreases to only one tenth of that
at 0 -- 0 ø because of the increase in the refractive index. Hence the magnetic field components, as well as the electric field
components, of those quasi-electrostatic mode waves are ob-
servable.
For comparison with the upper band chorus, the ratio cIBI/IEI is determined for another group of chorus in the lower band with moderate 0 angles. The ratio is found to lie in a
range from 31 to 49, which is very different from the results for
the upper band chorus. It is apparent that this indicates that
the lower band chorus is electromagnetic, although the ob-
served ratio is greater by a factor of 1.5-2.0 than the corre- sponding refractive index of the whistler mode with moderate 0.
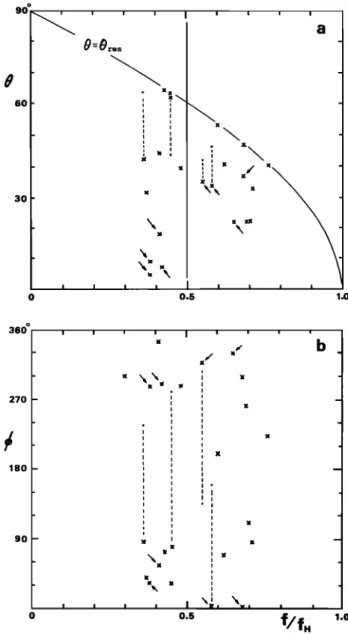
Now we discuss the rising tone chorus. Figure 9 shows the
summary of the wave normals determined for rising tone chorus. In the figure the wave normals indicated with arrows refer to the chorus events in Figure 6 which extend in fre- quency from lower to upper band without any change at fn/2. Other events analyzed correspond to chorus emissions for
90 ø 60 30 • = •res I I I I I i 0 0.5 I i I 1.0 360 ø 27O 180 90 i I I I X I i i I I b 0.$ i i I I !
o
f/f
HFig. 7. Direction finding results for impulsive chorus; (a) the angle 0 between the wave normal and the earth's magnetic field and (b) the azimuthal angle •b are illustrated as a function of the normal-
ized frequency, f/fn. All of the observed chorus events are found to be
composed of a single plane wave. The angles of the group of the
waves with moderate 0 angles are encircled to distinguish them from
those with 0 •< 0re s.
which the upper band and lower band have no coherence, as in Figure 4; in other words, they occur independently of each other. Four events in the figure are identified as being com- posed of two plane waves, for which the energetic peak is
expressed by a cross, as in the case of a single plane wave, and
the secondary, less energetic peak by a small circle, linked with
the corresponding cross by a dashed line. Other chorus events
are found to be of the single-plane wave model, just as for the impulsive chorus in Figure 7. Figure 9a shows the 0 distri- bution versus the normalized emission frequency, and the cor- responding •b distribution is given in Figure 9b.
First, we look at the wave normals of chorus without
arrows. The 4• dependence does not exhibit any particular
concentration of any specific values. A similarity to the results
for impulsive chorus is that there is one group, mainly in the
TABLE 1. Comparison of the Direction Finding Results With the Present Method and With the
Means' Method
(0, &)
Time, Frequency, Hz,
UT Normalized Frequency Present Method Means' Method Ores
Upper Band Chorus
0001:06 1121 (53.9 ø, 30.1 ø) (54.3 ø, 31.0 ø ) 56.8 ø (impulsive) 0.55 0901:05 1371 (52.2 ø , 333.4 ø ) (50.8 ø , 333.8 ø ) 56.8 ø (impulsive) 0.55 1100:43 1620 (21.8 ø , 330.3 ø ) (21.7 ø , 331.5 ø ) 49.8 ø (rising tone) 0.65 0300:45 778 (impulsive) 0.355 0901:06 1214 (impulsive) 0.48 1100:45 964 (rising tone) 0.38
Lower Band Chorus
(35.4 ø , 88.4 ø ) (34.8 ø , 88.7 ø ) 69.2 ø
(39.5 ø , 288.7 ø ) (36.8 ø , 293.0 ø ) 61.0 ø
(4.5 ø , 287.4 ø ) (4.1 ø , 292.7 ø ) 67.3 ø
again close to Ores. However, there seems to be a difference
from the case of impulsive chorus in that the closeness of the
wave normals of this group to the oblique resonance cone is
obviously much less distinct than in the case of impulsive chorus. Then, the lower band rising tone chorus is found to make moderate angles (300-45 ø) with Bo, these values being about 5 ø smaller than those obtained for impulsive chorus in Figure 7a.
In Figure 9 we finally examine the wave normal behaviors of chorus with arrows as shown in Figure 6. In the lower frequency range below fn/2, the wave normals are found to make extremely small angles (50-20 ø) with Bo, and larger angles (• 25 ø to • 35 ø) are found for the upper band. There seems to be a tendency for the wave normal angle of chorus
extending across fn/2 to increase with increasing frequency.
5. DISCUSSION OF THE GENERATION
MECHANISM OF CHORUS
Although it is clear that dispersion (or the propagation effect) of chorus must take place [Koons et al., 1982], it cer-
tainly is not the major cause of the frequency-time character-
istics detected in chorus tones [Burton and Holzer, 1974; Tsu- rutani and Smith, 1974], but a more probable explanation is nonlinear effects associated with the generation mechanism [Thorne, 1972]. The characteristic rising or falling tones of chorus elements have attracted much attention, and several
mechanisms, such as particle phase bunching [Helliwell, 1967;
Sudan and Ott, 1971] and wave potential well trapping [Nunn, 1974], have been proposed to explain these structures. The
generation mechanism is also of interest.
We now discuss the generation mechanism of the more
popular rising tone chorus. First, the rising tones which are
continuous across fn/2 in Figure 6 are considered, and we
have to note that the df/dt of the events analyzed is the small- est in the present paper, being closer to the value previously
observed. This kind of chorus is also detected on board the GEOS 1 [Cornilleau-Wehrlin et al., 1978] and SCATHA
[Koons, 1981] satellites. Because the emissions of this kind,
though infrequent in occurrence, are likely to be different from
all other rising tones to be discussed later, their wave normal
properties are treated separately. Figure 9 has shown that the
0 of these rising tones indicated by arrows increases from a
very small angle (less than 20 ø) at f/fn • 0.4 to • 200-40 ø in the upper band. The nature of the wave normals being nearly aligned with the magnetic field in the lower band is in good
agreement with the result of Burton and Holzer [1974] for the
rising tone chorus, and this gives further support to the gener- ation in terms of loss cone instability. The chorus treated here can be supposed to belong essentially to the lower band chorus, with its uppermost frequency extending above fn/2, because of the larger temperature anisotropy [Kennel and Petschek, 1966]. When the two-frequency chorus was orig-
inally discovered by Tsurutani and Smith [1974], they pro-
posed the damping mechanism for the missing band at fn/2
because chorus tones which cut across the fn/2 gap could clearly be observed. The GEOS 1 observation [Cornilleau- Wehrlin et al., 1978] has indicated that the rising tone chorus
emissions we are now discussing sometimes exhibit an extinct,
but weak absorption band at fn/2. These obvious observations
imply that the generation mechanism for the upper band of
these emissions is the same as for the lower band; in other words, the upper band is only an extended part of the lower
Fig. 8.
, , I .... I , . . I . ß itl t , , I .... I
1.0 10 100
ø IBI/l•.
I
HAYAKAWA ET AL.' DIRECTION FINDING OF MAGNETOSPHERIC CHORUS 2819
band, presumably originating from a loss cone instability, and
also the missing gap at fn/2 is probably due to the damping
effect, as proposed by Tsurutani and Smith [1974].
Next we discuss the wave normals of all other rising tone
chorus emissions except those treated above. The direction
finding analyses have demonstrated that the lower band chorus (f= 0.30-0.47fn) is generated with its wave normal making a moderate angle (300-45 ø) with the magnetic field, and these values are likely to be slightly larger than those obtained by Burton and Holzer [1974]; the possible reasons
will be discussed later.
The impulsive chorus in the lower band has been found to be generated with their wave normals about 5 ø larger than those of the rising tone chorus. There is a question whether
different frequency-time structures are due to different wave
normal directions. Cornilleau-Wehrlin et al. [1976] have made
wave normal analyses for three different types of chorus (rising
tone, falling tone, and burstlike) based on the Means' method for a small number of data from OGO 5. They have found
that the falling tones take large wave normal angles (500-60 ø )
while the wave normals of the rising tones are again very small, less than 20 ø .
Summarizing the above properties of wave normals of dif-
ferent types of chorus may lead us to suppose that different
structures are associated with different wave normal direc-
tions. The values of 0 of the rising tones with df/dt as normally
observed have shown small angles such as 50-20 ø in the pres-
ent paper and less than 20 ø in the work by Burton and Holzer [1974]. However, the rising tones with generally larger df/dt as studied in Figure 9 have indicated more oblique wave nor-
mals. The impulsive chorus seems to take larger 0 values than
the rising tones, and finally, the falling tones take much larger 0 angles.
Since the wave normals of rising tones treated in the present paper (Figure 9) are slightly larger than those in the work by Burton and Holzer [1974], their nature has been considered
here on the basis of the above characteristics of varying wave
normals with varying different spectrograms. As is shown in
section 3, the df/dt of the rising tones in the present paper is
found to be larger than that normally observed, and so it is
possible that we would expect larger wave normals than the 0
values obtained by Burton and Holzer. Another possibility
might be related to the differences in electron distribution and
in emission frequency. Kennel [1966] has shown that the angle
of the unstable cone is larger, the harder the electron energy
spectrum is, and also that for a fixed electron energy spectrum
it is smaller, the higher the emission frequency is. It may be
that the harder electron energy spectrum would have occurred
in the present case.
The occurrence of different types of chorus might be related
to the local time. Tsurutani and Smith [1974] have shown that flat and falling tones are detected primarily in the nightside
magnetosphere at large L, and flat tones are rarely observed
on the dayside. The present paper has shown that impulsive, burstlike chorus tends to be detected from postmidnight to afternoon, and rising tones appear only around noon at L- 6.6. It would be interesting to investigate, in detail, the
relationship of the frequency-time characteristic with LT and
L value and the associated difference of wave normal direc- tions with different structures.
We now discuss the generation mechanism of the upper band chorus. The present paper has clearly shown that the impulsive chorus in the upper band seems to be quasi-
electrostatic, making an angle very close to the oblique reso-
9o o 6O 3O = Or•s I I , ! i ,, , i i i i _ i i i i 0,5 ! I 360 ø , 270 180 90- ß i i i i i ! ! ! i i i i i i x [ i i i b / t t t t I I
o
f/f
H,.o
Fig. 9. Corresponding direction finding results for rising tone chorus for (a) the 0 distribution and (b) the 4• angles. Many of the observed waves consist of a single plane wave, but some waves are of the two-plane wave case for which a cross indicates the energetic
peak and the secondary one is represented by a small circle linked
with the corresponding cross. The arrival directions indicated by
arrows refer to the emissions in Figure 6.
nance cone. Maeda [1975], Maeda et al. [1976], and Anderson
and Maeda [1977] have all suggested an electromagnetic in-
stability due to an anisotropic electron velocity distribution,
but such an electromagnetic instability is likely to be inapplic-
able to the upper band, which is quasi-electrostatic. Then, our
direction finding studies appear to rule out the possibility sug-
gested by Curtis [1978] that f> fn/2 waves are propagating in
the ordinary mode. This is because the emission frequency is
always below fn, which is much smaller than fp (see Figure 2)
and so the wave is whistler mode. An electrostatic instability has been postulated by Hashimoto and Kimura [1981] in order to attempt to explain f> fn/2 hiss. Since their mechanism is also applicable to chorus, it is interesting to compare their theoretical implications with our present experimental results. Their proposed model is a kind of Harris type electrostatic instability in a bi-Maxwellian plasma with temperature ani-
short wavelengths and large wave normal angles is unstable in a frequency range from fn/2 to an upper cutoff frequency
dependent on the anisotropy factor. These theoretical predic-
tions seem to be in agreement with the experimental results found in the present paper. Hashimoto and Kimura's emis- sions are predicted to propagate at an angle slightly larger
than the oblique resonance cone angle on the assumption of
the cold plasma theory; this seems to be in partial contradic-
tion to our results of 0 •< Ores in Figure 7. This discrepancy is
related to the assumption of the cold plasma describing the propagation of whister mode waves in the direction finding technique in section 2. The cold plasma theory predicts that the whistler mode is allowed to propagate at an angle less
than Ore s. When 0 approaches 0r• •, the temperature effect
should be included in the refractive index, which makes whis-
tler mode propagation possible even for 0 > 0r• •, as shown by
Hashimoto and Kimura [1981]. Even if we take into account the temperature effect in the whistler mode refractive index in
estimating the wave normal directions, it is safe to say that the
final 0 to be obtained would be around 0r, •, though we do not
know whether the convergence in 0 takes place above or
below 0r•. Furthermore, a small departure of the wave normal
angles of some emissions from Ores might be related to the
propagation effect. Hashimoto and Kimura [1973, 1981] have
suggested that their emissions should be highly electrostatic at
the source region, but those excited by this electrostatic insta-
bility become less electrostatic (or more electromagnetic) with
changing wave normals during the course of the propagation even in a small distance from the source region. This effect
might be reflected in Figure 8. The wave normals of the rising
tone chorus in the upper band in Figure 9a are found to exhibit different behaviors from those for the impulsive chorus. Some of the wave normals depart considerably from
0r,•, which seems to indicate that the transition from the elec-
trostatic to the electromagnetic mode would be more notice-
able for the rising tone upper band chorus. Further detailed theoretical investigation should be carried out until a definite conclusion is reached on the generation mechanism of the upper band chorus.
Acknowledgments. The authors would like to express their sincere thanks to P. Robert of CRPE (Issy les Moulineaux) for supplying the
electron gyrofrequency data, and J. Etcheto and B. Higel of CRPE
(Issy les Moulineaux) and P. Decreau of LPCE (Or16ans) for supply-
ing the plasma frequency measurements from the S-301 and S-304
experiments, respectively. Thanks are also due to CNES (Toulouse)
for making the survey mode microriches, some of which have been
reproduced in the present paper. Useful discussions with J. Ohtsu and
Y. Tanaka of Nagoya University, I. Kimura of Kyoto University, H. Kikuchi of Nihon University, L. R. O. Storey and C. Beghin of LPCE, and B. T. Tsurutani of Jet Propulsion Laboratory are appreci- ated. The present work is partly supported by the grant-in-aid for
scientific research (57580008) from Ministry of Education, Japan, and
by the International Joint Project of Japan Society of Promotion of
Science. Finally we are grateful to the referees for their useful criti-
cism.
The Editor thanks C. C. Harvey and another referee for their assist- ance in evaluating this paper.
REFERENCES
Anderson, R. R., and K. Maeda, VLF emissions associated with en-
hanced magnetospheric electrons, J. Geophys. Res., 82, 135, 1977.
Bendat, J. S., and A. G. Piersol, Random Data: Analysis and Measure-
ment Procedures, Wiley-Interscience, New York, 1971.
Buchalet, L. J., and F. Lefeuvre, One and two direction models for VLF electromagnetic waves observed on-board GEOS 1, J. Geo- phys. Res., 86, 2377, 1981.
Burtis, W. J., and R. A. Helliwell, Banded chorus: A new type of VLF
radiation observed in the magnetosphere by Ogo 1 and Ogo 3, J.
Geophys. Res., 74, 3002, 1969.
Burtis, W. J., and R. A. Helliwell, Magnetospheric chorus' Occurrence patterns and normalized frquency, Planet. Space Sci., 24, 1007.
1976.
Burton, R. K., and R. E. Holzer, The origin and propagation of
chorus in the outer magnetosphere, J. Geophys. Res., 79, 1014, 1974.
Cornilleau-Wehrlin, N., J. Etcheto, and R. K. Burton, Detailed analy-
sis of magnetospheric chorus' Preliminary results, J. Atmos. Terr.,
Phys., 38, 1201, 1976.
Cornilleau-Wehrlin, N., R. Gendrin, F. Lefeuvre, M. Parrot, R. Grard, D. Jones, A. Bahnsen, E. Ungstrup, and W. Gibbons, VLF
electromagnetic waves observed onboard GEOS-1, Space Sci. Reo.,
22, 371, 1978.
Curtis, S. A., A theory on chorus generation by energetic electrons
during substorms, J. Geophys. Res., 83, 3841, 1978.
Decreau, P.M. E., C. Beghin, and M. Parrot, Electron density and temperature, as measured by the mutual impedance experiment on board GEOS-1, Space Sci. Re0., 22, 581, 1978.
Dunckel, N., and R. A. Helliwell, Whistler-mode emissions on the
OGO satellite, J. Geophys. Res., 74, 6371, 1969.
Etcheto, J., and J. J. Bloch, Plasma density measurements from the
GEOS-1 relaxation sounder, Space Sci. Re0., 22, 597, 1978. Gibbons, W., and I. A. Ward, A preliminary analysis of the ELF/VLF
signals received on-board GEOS 2 as detected by the filter-bank, Ado. Space Res., 1, 361, 1981.
Hashimoto, K., and I. Kimura, Oblique whistler mode propagation in a hot plasma, Rep. Ionos. Space Res. Jpn., 27, 73, 1973.
Hashimoto, K., and I. Kimura, A generation mechanism of narrow
band hiss emissions above one half the gyrofrequency in the outer
magnetosphere, J. Geophys. Res., 86, 11,148, 1981.
Hayakawa, M., K. Bullough, and T. R. Kaiser, The properties of storm-time magnetospheric VLF emissions as deduced from the Ariel-3 satellite and ground-based observations, Planet. Space Sci., 25, 353, 1977.
Helliwell, R. A., A theory of discrete VLF emissions from the mag-
netosphere, J. Geophys. Res., 72, 4773, 1967.
Isenberg, P. A., H. C. Koons, and J. F. Fennel, Simultaneous observa-
tions of energetic electrons and dawnside chorus in geosynchronous
orbit, J. Geophys. Res., 87, 1495, 1982.
Jones, D., Introduction to the S-300 wave experiments onboard GEOS, Space Sci. Re0., 22, 327, 1978.
Kennel, C. F., Low-frequency whistler mode, Phys. Fluids, 9, 2190,
1966.
Kennel, C. F., and H. E. Petschek, Limit of stably trapped particle
fluxes, J. Geophys. Res., 71, 1, 1966.
Koons, H. C., The role of hiss in magnetospheric chorus emissions, J.
Geophys. Res., 86, 6745, 1981.
Koons, H. C., C. Hetlinger, and B.C. Edgar, A mechanism to explain
the shapes of chorus emissions, Rep. SSL-823(7954), Space Sci.
Lab., Aerospace Corp., Los Angeles, Calif., 1982.
Lefeuvre, F., T. Neubert, and M. Parrot, Wave normal direction and wave distribution functions for ground-based transmitter signals
observed on GEOS 1, J. Geophys. Res., 87, 6203, 1982.
Maeda, K., Cyclotron side-band emissions from ring current elec- trons, Planet. Space Sci., 24, 341, 1975.
Maeda, K., P. H. Smith, and R. R. Anderson, VLF emissions from
ring current electrons, Nature, 262(5572), 37, 1976.
Means, J. D., The use of the three-dimensional co-variance matrix in
analyzing the properties of plane waves, J. Geophys. Res., 77, 5551,
1972.
Nunn, D., A self-consistent theory of triggered VLF emissions, Planet.
Space $ci., 22, 349, 1974.
Oliven, M. N., and D. A. Gurnett, Microburst phenomena, 3, An
association between microbursts and VLF chorus, J. Geophys. Res.,
73, 2355, 1968.
Russell, C. T., and R. E. Holzer, AC magnetic fields, in Particles and
Fields in the Magnetosphere, edited by B. M. McCormac, p. 195, D.
Reidel, Hingham, Mass., 1970.
Russell, C. T., R. E. Holzer, and E. J. Smith, Ogo 3 observations of ELF noise in the magnetosphere, 1, Spatial extent and frequency of
occurrence, J. Geophys. Res., 74, 755, 1969.
S-300 experimenters, Measurements of electric and magnetic wave
fields and of cold plasma parameters onboard GEOS-1, Prelimi-
nary results, Planet. Space $ci., 27, 317, 1979.
Sudan, R. N., and E. Ott, Theory of triggered VLF emissions, J.
Geophys. Res., 76, 4463, 1971.
HAYAKAWA ET AL.: DIRECTION FINDING OF MAGNETOSPHERIC CHORUS 2821
observed with the Injun 3 satellite, J. Geophys. Res., 73, 5615, 1968.
Thorne, R. M., Whistler mode propagation off the geomagnetic meri-
dian plane, internal report, Dep. of Meteorøl., Univ. of Calif., Los
Angeles, 1969.
ThO rne, R. M., The importance of wave-particle interactions in the magnetosphere , in Critical Problems of Magnetospheric Physics,
edit• by E. R. DYer, p. 211, National Academy of Sciences, Wash-
ington, D.C., 1972.
Thorne, R. M., E. J. Smith, K. •J. Fiske, and S. R. Church, Intensity Variations of ELF hiss and chorus during isolated substorms, Geo- phys. Res. Lett., 1, 193, 1974.
Thorne, R. M., S. R. Church, W. J. Malloy, and B. T. Tsurutani, The
local time variations of ELF emissions during periods of substorm
activity, J. Geophys. Res., 82, 1585, 1977.
Tsurutani, B. T., and E. J. Smith, Postmidnight chorus: A substorm ß
phenomenon, J. Geophys. Res., 79, 118, 1974.
Tsurutani, B. T., and E. J. Smith, Two types of magnetospheric ELF
chorus and their substorm dependences, J. Geophys. Res., 82, 5112,
1977.
Tsurutani, B. T., E. J. Smith, H. I. West, Jr., and R. M. Buck, Chorus, energetic electrons and magnetOsphe.ric substorms, in Wave Instabil-
ities in Space Plasma, edited by P. J. Palmadesso and K. Papado-
poulos, p. 55, D. Reidel, Hingham, Mass., 1979.
Wrenn, G., Geos 2 in space collision ?, Nature• 274, 631, 1978.
M. Hayakaya, ResearCh Institute of Atfnospherics, Nagoya Univer-
sity, 13 Honohara 3-chome, Toyokawa 442, Japan.
L. Lefeuvre and M. Parrot, Laboratoire de Physique et Chimie de
l'Environnement, Centre National de la Recherche Scientifique, 3A,
avenue de la Recherche Scientifique, 45045 Orl6ans Cedex, France.
Y. Yamanaka, Radio Research Laboratories, Koganei, Tokyo 184, Japan.
(Received June 7, 1983;
revised December 28, 1983; accepted January 11, 1984.)