HAL Id: hal-00298857
https://hal.archives-ouvertes.fr/hal-00298857
Submitted on 5 Jul 2007HAL is a multi-disciplinary open access
archive for the deposit and dissemination of sci-entific research documents, whether they are pub-lished or not. The documents may come from teaching and research institutions in France or abroad, or from public or private research centers.
L’archive ouverte pluridisciplinaire HAL, est destinée au dépôt et à la diffusion de documents scientifiques de niveau recherche, publiés ou non, émanant des établissements d’enseignement et de recherche français ou étrangers, des laboratoires publics ou privés.
Temporal variability of subsurface stormflow formation
P. M. Kienzler, F. Naef
To cite this version:
P. M. Kienzler, F. Naef. Temporal variability of subsurface stormflow formation. Hydrology and Earth System Sciences Discussions, European Geosciences Union, 2007, 4 (4), pp.2143-2167. �hal-00298857�
HESSD
4, 2143–2167, 2007
Temporal variability of subsurface stormflow formation
P. M. Kienzler and F. Naef
Title Page Abstract Introduction Conclusions References Tables Figures ◭ ◮ ◭ ◮ Back Close
Full Screen / Esc
Printer-friendly Version Interactive Discussion
EGU
Hydrol. Earth Syst. Sci. Discuss., 4, 2143–2167, 2007 www.hydrol-earth-syst-sci-discuss.net/4/2143/2007/ © Author(s) 2007. This work is licensed
under a Creative Commons License.
Hydrology and Earth System Sciences Discussions
Papers published in Hydrology and Earth System Sciences Discussions are under open-access review for the journal Hydrology and Earth System Sciences
Temporal variability of subsurface
stormflow formation
∗
P. M. Kienzler and F. Naef
Institute of Environmental Engineering, ETH Zurich, Zurich, Switzerland Received: 19 June 2007 – Accepted: 27 June 2007 – Published: 5 July 2007 Correspondence to: P. M. Kienzler ([email protected])
∗Invited contribution by P. M. Kienzler, one of the EGU outstanding Young Scientist Award
HESSD
4, 2143–2167, 2007
Temporal variability of subsurface stormflow formation
P. M. Kienzler and F. Naef
Title Page Abstract Introduction Conclusions References Tables Figures ◭ ◮ ◭ ◮ Back Close
Full Screen / Esc
Printer-friendly Version Interactive Discussion
EGU Abstract
Subsurface storm flow (SSF) can play a key role for the runoff generation at hillslopes. Quantifications of SSF suffer from the limited understanding of how SSF is formed and how it varies in time and space. This study concentrates on the temporal variabil-ity of SSF formation. Controlled sprinkling experiments at three experimental slopes
5
were replicated with varying precipitation intensity and varying antecedent precipita-tion. SSF characteristics were observed with hydrometric measurements and tracer experiments. SSF response was affected in different ways and to varying degree by changes of precipitation intensity and antecedent precipitation. The study showed that the influence of antecedent soil moisture on SSF response depends on the type of SSF
10
formation. Formation of subsurface stormflow was hardly influenced by the increase of precipitation intensity. As a consequence, subsurface flow rates were not increased by higher precipitation intensity. Different soil structures determined runoff formation at different precipitation intensities. Saturation and flow formation occurred at the base of the soil, but also within the topsoil during high precipitation intensity. This implies that
15
timing and magnitude of flow response can change substantially at different precipita-tion intensities.
1 Introduction
Fast subsurface flow (SSF) in shallow lateral preferential flow paths can play a key role for the runoff generation at hillslopes (reviews in Jones and Connelly, 2002; Weiler
20
et al., 2006). Quantifications of SSF are difficult due to the high spatial variability of subsurface flow paths and the limited understanding of how SSF is formed. Hence, considerable research has been directed to the conceptual understanding of SSF for-mation (e.g. McDonnell, 1990, Sidle et al., 2000; Kienzler and Naef, 2007) as well as to the question where subsurface flow occurs (Jones et al., 1997; Scherrer and Naef,
25
HESSD
4, 2143–2167, 2007
Temporal variability of subsurface stormflow formation
P. M. Kienzler and F. Naef
Title Page Abstract Introduction Conclusions References Tables Figures ◭ ◮ ◭ ◮ Back Close
Full Screen / Esc
Printer-friendly Version Interactive Discussion
EGU
Rowe 1996). However, few studies concentrated on how the formation of SSF varies in time and is influenced by antecedent precipitation and precipitation intensity in indi-vidual rainfall events.
In general, temporal variance of precipitation is important for runoff formation mech-anisms related to saturation. Kirkby (1969) described overland flow as a result of
satu-5
ration excess of the soil and pointed out the significance of antecedent soil moisture for this process. The relation between saturation and SSF formation was conceptualized by McDonnell (1990). He explained the initiation of lateral subsurface flow in soil pipes as a result of perched saturation above impermeable bedrock. Correlation of SSF formation with antecedent precipitation has been shown by several studies (Whipkey,
10
1967; Lynch et al., 1979; Uchida et al., 1999). Beven and Germann (1982) pointed to the relation between antecedent soil moisture and preferential infiltration in that “higher initial soil moisture contents in the soil may also allow deeper penetration along the macropores by reducing the lateral losses.” Similarly, Bouma et al. (1982) named soil water content as a crucial parameter for the “magnitude of bypass flow”. Experimental
15
evidence for this hypothesis comes from Weiler (2001), who observed reduced flow from macropores into the soil matrix, when the soil was wetted before the experiment. Thus, more intense and faster start of SSF can be expected under wet preconditions, as infiltrating water reaches lateral flow paths quicker and less water is required to trigger subsurface flow.
20
In a similar way, increased precipitation intensity as a result of a switch from ma-trix infiltration to macropore infiltration could lead to a subsequent faster onset of SSF. Beven and Germann (1982) hypothesized that the initiation of macropore flow is re-lated to the precipitation intensity. They proposed that macropore flow is initiated from water ponding at the soil surface as soon as the infiltration capability of the soil matrix is
25
surpassed. This conceptual model of macropore flow initiation has since been applied in many detailed numerical models of infiltration and runoff formation (e.g. Zuidema, 1985; Bronstert and Plate, 1997). In fact, experimental studies gave evidence for the correlation between precipitation intensity and macropore flow (Trojan and Linden,
HESSD
4, 2143–2167, 2007
Temporal variability of subsurface stormflow formation
P. M. Kienzler and F. Naef
Title Page Abstract Introduction Conclusions References Tables Figures ◭ ◮ ◭ ◮ Back Close
Full Screen / Esc
Printer-friendly Version Interactive Discussion
EGU
1992). However, initiation of macropore flow has been observed even during low pre-cipitation intensity as a result of subsurface saturation (Weiler and Naef, 2003).
This study aims to illuminate the relevance of antecedent precipitation and precipi-tation intensity for SSF formation. For this purpose, controlled sprinkling experiments at three different experimental slopes were replicated with varying precipitation
inten-5
sity and antecedent soil moisture. SSF characteristics were observed with hydrometric measurements and tracer experiments. SSF response was affected in different ways and to varying degree by changes of precipitation intensity and antecedent soil mois-ture. It is discussed, which site-specific properties were responsible for the different responses and some general conclusions are drawn that may help to assess the
tem-10
poral variability of SSF in individual rainfall events.
2 Experimental setup
Infiltration and runoff formation were monitored at three experimental slopes during sprinkling experiments on areas of 100 m2. Follow-up experiments with similar pre-cipitation intensity were conducted on adjacent days to study the influence of
an-15
tecedent precipitation on SSF. In each case, the first experiment was conducted un-der dry weather conditions and the second experiment on the following day with the antecedent precipitation of the first experiment. Table 1 lists details on the antecedent moisture and precipitation intensity of the different experiments. Follow-up experiments with high (40–50 mm h−1) and low (10 mm h−1) precipitation intensities were conducted.
20
Table 2 lists precipitation intensity and antecedent moisture during the different exper-iments. Subsurface flow was measured above the bedrock in a trench at the lower end of the sprinkled area. Surface runoff and outflow from larger pipes and macrop-ores were measured either with 100 ml tipping bucket gauges or with 45◦ Thompson
weirs. Soil moisture and matric potential were recorded in different depths and at
differ-25
ent locations with TDR-probes and tensiometers. Piezometers recorded water levels within the soil. To determine event and pre - event water fractions in the different runoff
HESSD
4, 2143–2167, 2007
Temporal variability of subsurface stormflow formation
P. M. Kienzler and F. Naef
Title Page Abstract Introduction Conclusions References Tables Figures ◭ ◮ ◭ ◮ Back Close
Full Screen / Esc
Printer-friendly Version Interactive Discussion
EGU
components the sprinkling water was traced with the flourescent dye naphtionate. The natural tracer Radon-222 allowed assessing pre-event water percentages in SSF dur-ing natural rainfall events. Figure 1 depicts the experimental setup. Locations of the devices varied slightly at the different experimental slopes. At Lutertal, soil moisture was monitored more closely with 30 additional TDR probes (Retter et al., 2006). Details
5
on the experimental setup and uncertainties of the methods can be found in Kienzler and Naef (2007).
3 Experimental slopes
The experiments were replicated across three hill slopes in the Swiss Plateau with dif-ferent soils and geology to cover difdif-ferent subsurface flow mechanisms. At all sites,
10
substantial SSF was expected according to the decision scheme of Scherrer and Naef (2003). The three test sites, listed in Table 3, were situated in the Swiss Plateau. Mean annual temperature in this area is between 6◦C and 8◦C, mean annual precipitation
ranges from 1000 mm to 1500 mm and evapotranspiration is about 40% of annual pre-cipitation. The Swiss Plateau is mainly formed by “Molasse”, deposited at the border of
15
the Alps and consisting of sandstones, marl, and conglomerates. These sedimentary rocks are in large parts overlain by glacial till and fluvial deposits. Details on geol-ogy and soil properties are given in Table 4. As all three sites are extensively used as meadow, vegetation is similar and consists of plants typical for middle-Europe rich pastures.
20
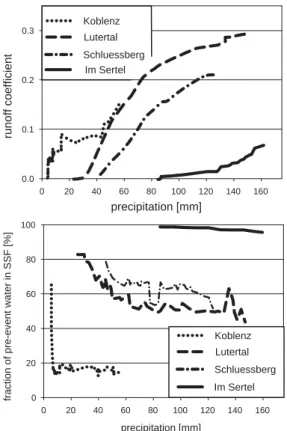
The formation of SSF as well as fractions of pre-event water in SSF varied substan-tially at these sites (Fig. 2). The individual response depended on the degree of direct or indirect feeding of SSF (Kienzler and Naef, 2007). Direct feeding of SSF means that precipitation feeds directly an extended system of large and well-connected pref-erential flow paths with little interaction with the soil matrix. Therefore, SSF responds
25
quickly, shows high flow velocities and contains little pre-event water (site Koblenz in Fig. 2). Indirect feeding, as observed at Im Sertel, means that water infiltrates first
HESSD
4, 2143–2167, 2007
Temporal variability of subsurface stormflow formation
P. M. Kienzler and F. Naef
Title Page Abstract Introduction Conclusions References Tables Figures ◭ ◮ ◭ ◮ Back Close
Full Screen / Esc
Printer-friendly Version Interactive Discussion
EGU
into the soil matrix and that subsurface flow originates from the saturated soil matrix. In this case, SSF responds delayed to precipitation and contains little event water. Response at Lutertal and Schluessberg was between these extremes. At Schluess-berg, parts of the subsoil saturated during low-intensity rainfall and SSF response was moderately delayed and contained about 60% of pre-event water. Also at Lutertal, SSF
5
responded moderately delayed and contained about 50% of pre-event water. Here, out-flow from individual soil pipes started at different times and contained different amounts of pre-event water. Delayed pipes had higher concentrations of pre-event water than pipes starting quickly. This indicates that the latter were fed directly from precipitation, whereas the former were fed indirectly from saturated parts of the soil (Kienzler and
10
Naef, 2007).
4 Antecedent precipitation and SSF formation
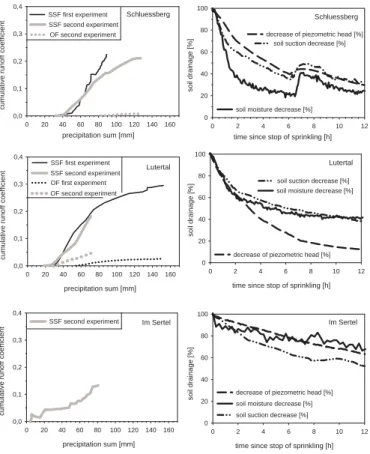
Figure 3 (left) compares cumulative runoff coefficients in response to the follow-up ex-periments. Soil drainage after the first experiment is depicted by Fig. 3 (right). With regard to the influence of antecedent precipitation, the different sites showed distinct
15
differences. During the two experiments, runoff response was similar at Schluessberg as well as at Lutertal. Contrary, no runoff at all was produced at Im Sertel during the first experiment, whereas subsurface flow from a thin weathered layer above the under-lying sandstone started after a few mm of precipitation during the follow-up experiment (Fig. 3, left). Small differences of antecedent soil moisture were detected between
20
the first and the second experiment at Schluessberg as well as at Lutertal. Contrary, at Im Sertel antecedent soil moisture is substantially increased before the second ex-periment in comparison to the first exex-periment (Table 1). Figure 3 (right) shows, that drainage at Im Sertel was considerably delayed in comparison to Schluessberg and Lutertal.
25
What was the reason for the different influence of antecedent precipitation at differ-ent experimdiffer-ental slopes? It can be understood by considering the differdiffer-ent types of
HESSD
4, 2143–2167, 2007
Temporal variability of subsurface stormflow formation
P. M. Kienzler and F. Naef
Title Page Abstract Introduction Conclusions References Tables Figures ◭ ◮ ◭ ◮ Back Close
Full Screen / Esc
Printer-friendly Version Interactive Discussion
EGU
SSF formation (see Sect. 3). At Im Sertel, SSF responded delayed despite the high density of vertical macropores and the existence of a highly permeable layer. There was no direct preferential flow from the soil surface to the trench. Instead, infiltration from vertical macropores into the soil matrix occurred and lateral subsurface flow was initiated only after large parts of the subsoil were saturated. Therefore, during the first
5
experiment, nearly all precipitation was retained in the subsoil, which reached almost saturated conditions. After this first experiment, the saturated parts of the soil drained slowly (Fig. 3, right). Consequently, a small amount of precipitation could trigger SSF from the saturated subsoil during the follow-up experiment. At the two other sites, SSF was formed differently. As the interaction of preferential flow with the surrounding
10
soil matrix was limited, the initiation of SSF was less dependent on saturation. SSF started already from small, saturated patches within the soil. After the experiment, these small patches were drained fast and effectively by preferential flow. Therefore, the soils showed a similar retention capacity during follow-up experiments and also antecedent moisture was comparable for both experiments.
15
Also Scherrer et al. (2007) concluded from sprinkling experiments on 18 different sites, that “the impact of antecedent wetness on the runoff volume depends on the runoff process encountered.” At some sites of their study, “a faster reaction under wet conditions was prevented by an efficient drainage system, which lowered the water table in the soil within a few hours.”, whereas other sites “reacted quite sensitively to
20
antecedent wetness. ”
These findings imply that the influence of antecedent precipitation on runoff response depends on how SSF is formed. They show that parameters like the “antecedent precipitation index” have to be applied with caution in hydrological modeling, as high antecedent precipitation implies increased runoff response and high antecedent soil
25
HESSD
4, 2143–2167, 2007
Temporal variability of subsurface stormflow formation
P. M. Kienzler and F. Naef
Title Page Abstract Introduction Conclusions References Tables Figures ◭ ◮ ◭ ◮ Back Close
Full Screen / Esc
Printer-friendly Version Interactive Discussion
EGU 5 Precipitation intensity and SSF formation
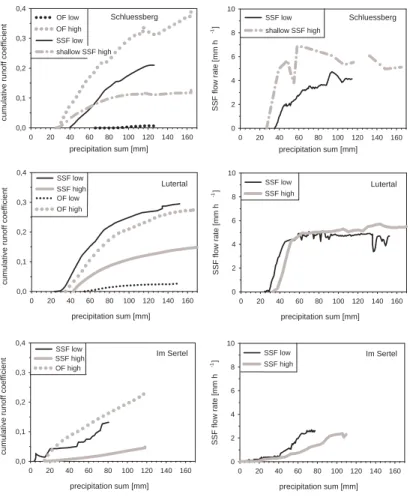
At all experimental slopes, substantial subsurface flow occurred during low as well as during high intensities, whereas (nearly) no overland flow occurred during low intensi-ties but large amounts during high intensiintensi-ties (Fig. 4, left). At Schluessberg and at Im Sertel, additional subsurface flow paths were activated during high precipitation
inten-5
sities.
At Im Sertel, outflow from a thin weathered layer directly above the sandstone bedrock and from a soil pipe in 0.7 m depth was observed during low precipitation in-tensity. Both flow components contained high percentages of pre-event water. During the high intensity experiment, the same flow paths were activated again with high
frac-10
tions of pre-event water. In addition, shallow subsurface flow from several macropores in 15–25 cm depth was observed with low percentages of pre-event water. Discharge of deep SSF was similar during both intensities (Fig. 4, right).
Different subsurface flow components were also observed at Schluessberg, where shallow subsurface flow to a depth of 40 cm and deep subsurface flow to a depth of
15
150 cm were measured separately. During high precipitation intensities, shallow sub-surface flow from several small soil pipes was observed with low pre-event water con-tent of 27% similar to overland flow. These pipes were not activated during sprinkling with 10 mm h−1, while deep subsurface flow occurred with more than 62% of pre-event
water. Increasing the intensity to 20 mm h−1 triggered overland flow and a slight
in-20
crease of SSF (Fig. 4, right).
At Lutertal, overland flow and subsurface flow occurred during both intensities. Like at the other sites, pre-event water content in SSF was similar during the different inten-sities (Kienzler and Naef, 2007). Also, maximum SSF discharge was similar during dif-ferent precipitation intensities and started after similar amounts of precipitation (Fig. 4,
25
right).
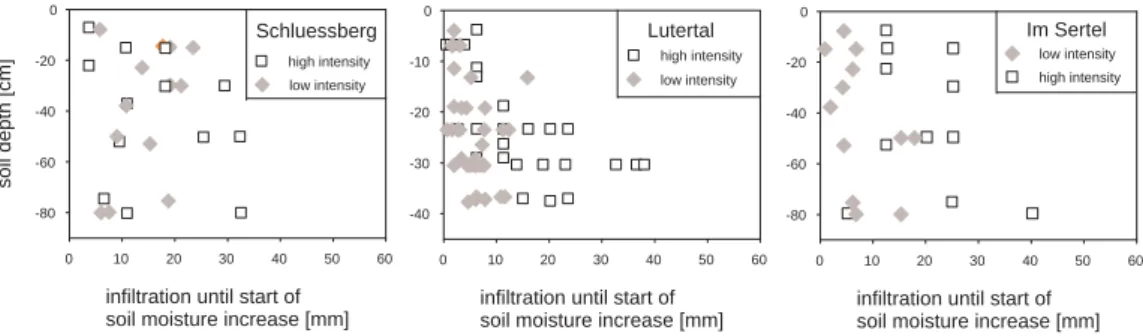
To test, whether a switch from matrix infiltration to macropore infiltration occurred, amounts were compared of infiltrated water before soil moisture and soil suction started
HESSD
4, 2143–2167, 2007
Temporal variability of subsurface stormflow formation
P. M. Kienzler and F. Naef
Title Page Abstract Introduction Conclusions References Tables Figures ◭ ◮ ◭ ◮ Back Close
Full Screen / Esc
Printer-friendly Version Interactive Discussion
EGU
to increase at different tensiometers and TDR-probes in different depths (Fig. 5). For the calculation of the cumulative amount of infiltrated water, overland flow was sub-tracted from precipitation. This comparison shows comparable results for the different intensities (Fig. 5).
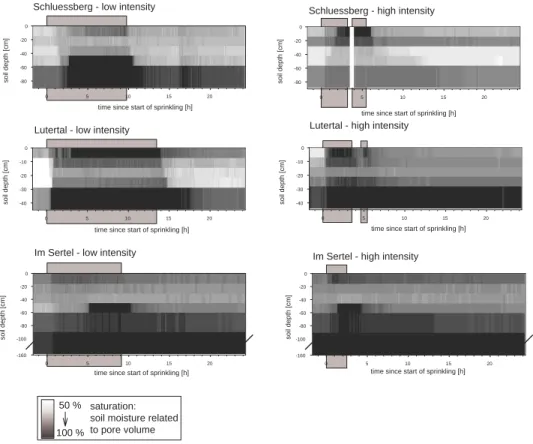
While this analysis revealed quick infiltration into the whole soil profile, the amplitude
5
of soil moisture increase varied distinctly at different depths (Fig. 6). At all sites, in-crease of soil moisture was observed mainly in the uppermost layer of the soil as well as in the subsoil above the underlying bedrock material. During high intensity, mainly topsoil moisture content increased strongly, while subsoil moisture content responded less pronounced. In contrast, during low intensity, subsoil moisture content increased
10
strongly and topsoil water content increase was less pronounced.
The similar responses of subsurface flow rate and pre-event water percentages in SSF indicate that (deep) subsurface flow was hardly influenced by precipitation inten-sity. Infiltration into the soil was similar and no switch to more preferential infiltration was detected. The maximum discharge of subsurface flow was already reached with
15
low-intensity sprinkling and did not increase with higher precipitation intensity. How-ever, the precipitation amounts and intensities applied in this study, correspond to ex-treme rainfall events, which occur with a return frequency of more than 50–100 years (10 mm h−1) respectively 100–500 years (50 mm h−1) in the study area (R ¨othlisberger
et al., 1992). This implies that the observed subsurface flow with maxima between
20
3 mm h−1 (Im Sertel) and 6 mm h−1 (Lutertal) will deliver substantial contributions to
storm flow during most flood events. Only, the relevance of subsurface flow will be low during very extreme and seldom events with high intensity precipitation, when overland flow will form the most part of total runoff. Uchida et al. (2001) listed similar maximum subsurface flow rates for several forested sites and attributed the limitations of the
sub-25
surface flow rates to geometry and hydraulic resistance of lateral subsurface flow paths. In our study, the occurrence of overland flow indicated that the limited infiltration rate could be responsible for subsurface flow limitation. However, it can only be speculated if subsurface flow is the cause of or the symptom for limited infiltration rates.
HESSD
4, 2143–2167, 2007
Temporal variability of subsurface stormflow formation
P. M. Kienzler and F. Naef
Title Page Abstract Introduction Conclusions References Tables Figures ◭ ◮ ◭ ◮ Back Close
Full Screen / Esc
Printer-friendly Version Interactive Discussion
EGU
Overland flow was not the result of complete saturation of the soil, as it started while still large part of the pore volume was not filled and tensiometers indicated unsaturated conditions. However, saturated conditions were observed in the uppermost soil lay-ers of all three experimental slopes during high intensity and partially also during low intensity (Fig. 6). Despite high macroporosity of the soil (Table 4), infiltration into the
5
subsoil was limited and the topsoil saturated nearly independently from subsoil water content. Obviously, this topsoil saturation triggered overland flow. Also shallow sub-surface flow at Schluessberg and Im Sertel originated from the saturated topsoil as indicated by the similar pre-event water content of overland flow and shallow subsur-face flow. Infiltration into the subsoil was not completely inhibited and subsoil saturation
10
developed above the underlying bedrock material. This saturation from below caused the formation of deep subsurface flow. Partially, e.g. at Lutertal, topsoil saturation and saturation from below occurred at the same time. As a consequence, both, overland flow and subsurface flow occurred during both intensities. At Schluessberg however, no subsoil saturation developed during high-intensity sprinkling and topsoil saturation
15
was considerably delayed during low-intensity sprinkling. Consequently, here, overland flow and shallow subsurface flow occurred during high-intensity sprinkling, while deep subsurface flow formed during low-intensity sprinkling only. At Im Sertel, subsoil satu-ration and deep subsurface flow were observed during high intensity as well as during low intensity. Topsoil saturation and subsequent triggering of overland flow and shallow
20
subsurface flow were observed during the experiment with high intensity only.
In summary, different parts of the soil controlled flow formation depending on precip-itation intensity (Fig. 7). During low intensity, saturation above the underlying bedrock was the most relevant process and deep subsurface flow was the dominating runoff component. During higher intensity, topsoil saturation was the most relevant process
25
and overland flow was the dominating runoff component. Such perched topsoil sat-uration has been observed repeatedly in podzolic soils with a thick organic O-horizon overlaying a distinctive impermeable hardpan layer (e.g. Brown et al., 1999). This study shows that the development of perched saturation can occur due to slight vertical
vari-HESSD
4, 2143–2167, 2007
Temporal variability of subsurface stormflow formation
P. M. Kienzler and F. Naef
Title Page Abstract Introduction Conclusions References Tables Figures ◭ ◮ ◭ ◮ Back Close
Full Screen / Esc
Printer-friendly Version Interactive Discussion
EGU
ations of macroporosity and packing density during high-intensity rainfall, influencing the different runoff components and the timing of these components. Overland flow and shallow subsurface flow occurred before saturation of the whole soil profile, as only part of the effective porosity of the whole soil was filled before runoff started. Deep subsurface flow drained the soil continuously and delayed or prevented therefore
5
a complete saturation of the whole soil profile and the initiation of overland flow and shallow subsurface flow during low intensity.
6 Conclusions
The influence of antecedent precipitation on SSF response depends on how SSF is formed. Its influence is high, when SSF is initiated only after large parts of the soil
10
have been saturated, which are drained slowly after a rainfall event. SSF is less de-pendent on saturation, where it is formed in a more direct way from small, saturated patches, which can be drained efficiently. Consequently, the influence of antecedent precipitation on SSF response is low at such sites. This implies for the application of antecedent precipitation in hydrological modeling, that antecedent precipitation
corre-15
lates with antecedent soil moisture and runoff response for a limited number of hillslope settings only.
Formation of subsurface stormflow was hardly influenced by the increase of precipi-tation intensity. As a consequence, subsurface flow rates were not increased by higher precipitation intensity. Such a limitation of subsurface discharge to site-specific maxima
20
might be quite common.
Different soil structures determine runoff formation at different precipitation intensi-ties as saturation may occur at the base of the soil, but also within the topsoil during high precipitation intensity. Thus, timing and magnitude of flow response can change substantially at different intensities. The identification of such processes is easy in
25
cases, where distinct impermeable soil layers occur, however, this study showed that perched topsoil saturation during high precipitation intensity may be triggered also by
HESSD
4, 2143–2167, 2007
Temporal variability of subsurface stormflow formation
P. M. Kienzler and F. Naef
Title Page Abstract Introduction Conclusions References Tables Figures ◭ ◮ ◭ ◮ Back Close
Full Screen / Esc
Printer-friendly Version Interactive Discussion
EGU
slight changes of macroporosity and packing density.
Acknowledgements. This research was funded by the Swiss Federal Office for the Environment
and the European Community Initiative INTERREG III B in the framework of the WaReLa – Project. F. Oberrauch, S. Agarwal, S. Wittmann, D. Carstens, M. Retter and Da. Casper helped with the fieldwork.
5
References
Beven, K. and Germann, P.: Macropores and water flow in soils, Water Resour. Res., 18(5), 1311–1325, 1982.
Bouma, M., Belmans, C. F. M., and Dekker, L. W.: Water infiltration and redistribution in a silt loam subsoil with vertical worm channels, Soil Sci. Soc. Am. J., 46, 917–921, 1982.
10
Bronstert, A. and Plate, E.J.: Modelling of runoff generation and soil moisture dynamics for hillslopes and micro-catchments, J. Hydrol., 198, 177–195, 1997.
Brown, V. A., McDonnell, J. J., Burns, D. A. and Kendall, C.: The role of event water, a rapid shallow flow component, and catchment size in summer stormflow, J. Hydrol., 217, 171–190, 1999.
15
Finnern, H., Grottenthaler, W., K ¨uhn, D., P ¨alchen, W., Schraps, W. G., and Sponagel, H.: Bodenkundliche Kartieranleitung. 4. Aufl., 1994.
Jones, J. A. A. and Connelly, L. J.: A semi-distributed simulation model for natural pipeflow, J. Hydrol., 262, 28–49, 2002.
Jones, J. A. A., Richardson, J. M., and Jacob, H. J.: Factors controlling the distribution of piping
20
in Britain: a reconnaissance, Geomorphology 20, 289–306, 1997.
Kienzler, P. M. and Naef, F.: Subsurface storm flow formation at different hillslopes and implica-tions for the “old water paradox”, Hydrological Processes, in press, 2007.
Kirkby, M. J.: Infiltration, Throughflow and Overland Flow, in: Water Earth and Man, edited by: Chorley, R. J., Taylor & Francis, 215–227, 1969.
25
Lynch, J. A., Corbett, E. S., and Sopper, W. E.: Effects of antecedent soil moisture on stormflow volumes and timing, in: Proc. 3rd Int.Symp. in Hydrology (Colorado State University, Fort Collins, Colorado, USA), 89–99. Water Resources Publications, Colorado, USA, 1979. McDonnell, J. J.: A rationale for old water discharge through macropores in a steep humid
catchment, Water Resour. Res., 26, 2821–2832, 1990.
HESSD
4, 2143–2167, 2007
Temporal variability of subsurface stormflow formation
P. M. Kienzler and F. Naef
Title Page Abstract Introduction Conclusions References Tables Figures ◭ ◮ ◭ ◮ Back Close
Full Screen / Esc
Printer-friendly Version Interactive Discussion
EGU Retter, M., Kienzler, P. M., and Germann, P.: Vectors of subsurface storm flow in a layered
hillslope during runoff initiation, Hydrol. Earth Syst. Sci., 10, 309–320, 2006,
http://www.hydrol-earth-syst-sci.net/10/309/2006/.
R ¨othlisberger, G., Geiger, H., and Zeller, J.: Starkniederschl ¨age im Schweizer Mittelland und Jura. Band 9. WSL, Birmensdorf, 1992.
5
Scherrer, S. and Naef, F.: A decision scheme to identify dominant flow processes at the plot-scale for the evaluation of contributing areas at the catchments-plot-scale, Hydrological Pro-cesses, 17(2), 391–401, 2003.
Scherrer, S., Naef, F., Faeh, A. O., and Cordery, I.: Formation of runoff at the hillslope scale during intense precipitation, Hydrol. Earth Syst. Sci., 11, 907–922, 2007,
10
http://www.hydrol-earth-syst-sci.net/11/907/2007/.
Sidle, R. C., Tsuboyama, Y., Noguchi, S., Hosoda, I., Fujieda, M., and Shimizu T.: Stormflow generation in steep forested headwaters: a linked hydrogeomorphic paradigm, Hydrological Processes, 14, 369–385, 2000.
Trojan, M. D. and Linden, D. R.: Microrelief and rainfall effects on water and solute movement
15
in earthworm burrows, Soil Sci. Soc. Am. J., 56, 727–733, 1992.
Uchida, T., Kosugi, K., and Mizuyama, T.: Runoff characteristics of pipeflow and effects of pipeflow on rainfall-runoff phenomena in a mountainous watershed, J. Hydrol., 222, 18–36, 1999.
Uchida, T., Kosugi, K., and Mizuyama, T.: Effects of pipeflow on hydrological process and
20
its relation to landslide: a review of pipeflow studies in forested catchments, Hydrological Processes 15, 2151–2174, 2001.
Weiler, M.: Mechanisms controlling macropore flow during infiltration. Dissertation, ETH Zurich,
http://e-collection.ethbib.ethz.ch/show?type=diss&nr=14237, 2001.
Weiler, M. and Naef, F.: An experimental tracer study of the role of macropores in infiltration in
25
grassland soils, Hydrological Processes, 17, 477–493, 2003.
Weiler, M., McDonnell, J. J., Tromp-van Meerveld, I., and Uchida, T.: Subsurface Stormflow, in: Encyclopedia of Hydrological Sciences, edited by: Anderson, M. G. and McDonnell, J. J., Volume 3, Part 10, Wiley and Sons, 2006.
Whipkey, R. Z.: Subsurface stormflow from forested slopes, Bull. International Association
30
Scientific Hydrology, 10, 74–85, 1967.
Woods, R. and Rowe, L.: The changing spatial variability of subsurface flow across a hillside, New Zealand J. Hydrol., 35(1), 51–86, 1996.
HESSD
4, 2143–2167, 2007
Temporal variability of subsurface stormflow formation
P. M. Kienzler and F. Naef
Title Page Abstract Introduction Conclusions References Tables Figures ◭ ◮ ◭ ◮ Back Close
Full Screen / Esc
Printer-friendly Version Interactive Discussion
EGU Zehe, E., Maurer, T., Ihringer, J., and Plate, E.: Modeling water flow and mass transport in a
loess catchment. Physics and chemistry of the Earth. Hydrology, Oceans and Atmosphere, 26(7–8), 487–507, 2001.
Zuidema, P. K.: Hydraulik der Abflussbildung w ¨ahrend Starkniederschl ¨agen. Mitteilungen der VAW 79, 150 p., Dissertation, 1985.
HESSD
4, 2143–2167, 2007
Temporal variability of subsurface stormflow formation
P. M. Kienzler and F. Naef
Title Page Abstract Introduction Conclusions References Tables Figures ◭ ◮ ◭ ◮ Back Close
Full Screen / Esc
Printer-friendly Version Interactive Discussion
EGU
Table 1. Comparison of experiments with different antecedent precipitation. Details are given
of antecedent soil moisture and precipitation intensity for each test slope.
Site Schluessberg Lutertal Im Sertel Identification in text first
experiment second experiment first experiment second experiment first experiment second experiment Precipitation intensity [mm h−1] 8 10/increase
to 20
11.6 14.4 8.4 8.4
Precipitation sum [mm] 89 126 152 98 85 80 Antecedent soil moisture [mm] 220 240 125 140 540 584
HESSD
4, 2143–2167, 2007
Temporal variability of subsurface stormflow formation
P. M. Kienzler and F. Naef
Title Page Abstract Introduction Conclusions References Tables Figures ◭ ◮ ◭ ◮ Back Close
Full Screen / Esc
Printer-friendly Version Interactive Discussion
EGU
Table 2. Comparison of experiments with different precipitation intensities. Details are given of
antecedent soil moisture and precipitation intensity for each test slope.
Site Schluessberg Lutertal Im Sertel Identification in text low intensity high intensity low intensity high intensity low intensity high intensity Precipitation intensity [mm h−1] 10/increase
to 20
37 11.6 50.4 8.4 50.4 Precipitation sum [mm] 126 164 152 194 80 118 Antecedent soil moisture [mm] 240 237 125 138 584 613
HESSD
4, 2143–2167, 2007
Temporal variability of subsurface stormflow formation
P. M. Kienzler and F. Naef
Title Page Abstract Introduction Conclusions References Tables Figures ◭ ◮ ◭ ◮ Back Close
Full Screen / Esc
Printer-friendly Version Interactive Discussion
EGU
Table 3. Locations of the experimental slopes.
Site Schluessberg Im Sertel Lutertal
Location (Long./ Lat:) 8◦45′06′′/47◦16′48′′ 7◦58′49′′/47◦14′17′′ 8◦00′37′′/47◦14′10′′
Altitude [m asl] 520 540 690
Exposition SW NE S
Slope [%] 28 40 30
HESSD
4, 2143–2167, 2007
Temporal variability of subsurface stormflow formation
P. M. Kienzler and F. Naef
Title Page Abstract Introduction Conclusions References Tables Figures ◭ ◮ ◭ ◮ Back Close
Full Screen / Esc
Printer-friendly Version Interactive Discussion
EGU
Table 4. Soil characteristics of the experimental slopes. The pipette method was applied to
determine percentages of sand (63 µm to 2 mm), silt (2 µm to 63 m) and clay (<63 µm). Packing density and percentage of coarse fragments were estimated according to Finnern et al. (1994). Macropore density was assessed by visual count in horizontal cross-sections of 2500 cm2 at different soil depths.
Site Soil classification Geological parent material
Depth [cm] Horizon particle size distribution [%] coarse frag-ments [%] packing density macropore density pH
Sand Silt Clay [g cm−3] [m−2]
Schluessberg Calcaric cambisol Ground moraine
0–10 Ah 34 34 32 3 1.1 224 5 11–24 A/B 34 34 32 5 1.3 136 5 24–80 Bw 31 35 34 10 1.4 111 5
>80 C 31 35 34 15 2 35 8
Lutertal Cambisol Siltstone of “Oeningien” Molasse
0–10 A 26 51 23 <1 1.2 184 5 10–25 B 26 51 23 <1 1.3 248 6 25–40 B/Cv 26 51 23 2-5 1.4 132 6
>42 C 2.2 0 7
Im Sertel Cambisol Sandstone of “Helvetien” Molasse
0–20 A 41 29 30 <1 1.2 284 5 20–80 B 47 29 24 <1 1.3 216 5 80–160 B/Cv 51 27 22 <1 1.3 344 5
160–270 Cv 1.8 126 8
HESSD
4, 2143–2167, 2007
Temporal variability of subsurface stormflow formation
P. M. Kienzler and F. Naef
Title Page Abstract Introduction Conclusions References Tables Figures ◭ ◮ ◭ ◮ Back Close
Full Screen / Esc
Printer-friendly Version Interactive Discussion
EGU
Fig. 1. Experimental set-up during the sprinkling experiments in a view from above. Installation
depths of the probes and tracer injection varied at different experimental slopes according to soil depth.
HESSD
4, 2143–2167, 2007
Temporal variability of subsurface stormflow formation
P. M. Kienzler and F. Naef
Title Page Abstract Introduction Conclusions References Tables Figures ◭ ◮ ◭ ◮ Back Close
Full Screen / Esc
Printer-friendly Version Interactive Discussion
EGU
precipitation [mm]
0 20 40 60 80 100 120 140 160
fraction of pre-event water in SSF [%] 0 20 40 60 80 100 precipitation [mm] 0 20 40 60 80 100 120 140 160 runoff coefficient 0.0 0.1 0.2 0.3 Koblenz Im Sertel Lutertal Schluessberg Koblenz Im Sertel Lutertal Schluessberg
Fig. 2. Intercomparison of differently responding hillslopes (Kienzler and Naef, 2007). Directly
fed subsurface storm flow starts quickly and contains little pre-event water (Koblenz). Indirectly fed subsurface storm flow starts delayed and consists mainly of pre-event water (Im Sertel). Experimental slopes Lutertal and Schluessberg responded in between these extremes. Re-sults of pre-event water fraction and cumulative runoff coefficient are plotted against cumulated precipitation sum.
HESSD
4, 2143–2167, 2007
Temporal variability of subsurface stormflow formation
P. M. Kienzler and F. Naef
Title Page Abstract Introduction Conclusions References Tables Figures ◭ ◮ ◭ ◮ Back Close
Full Screen / Esc
Printer-friendly Version Interactive Discussion
EGU time since stop of sprinkling [h]
0 2 4 6 8 10 12 soil drainage [%] 0 20 40 60 80 100
soil moisture decrease [%]
soil moisture decrease [%]
soil moisture decrease [%]
decrease of piezometric head [%]
decrease of piezometric head [%]
decrease of piezometric head [%] soil suction decrease [%]
time since stop of sprinkling [h]
0 2 4 6 8 10 12 soil drainage [%] 0 20 40 60 80 100
soil suction decrease [%] Schluessberg
precipitation sum [mm] 0 20 40 60 80 100 120 140 160
cumulative runoff coefficient
0,0 0,1 0,2 0,3 0,4 SSF first experiment SSF second experiment OF second experiment Lutertal precipitation sum [mm] 0 20 40 60 80 100 120 140 160
cumulative runoff coefficient
0,0 0,1 0,2 0,3 0,4 SSF first experiment SSF second experiment OF first experiment OF second experiment precipitation sum [mm] 0 20 40 60 80 100 120 140 160
cumulative runoff coefficient
0,0 0,1 0,2 0,3 0,4
SSF second experiment Im Sertel
time since stop of sprinkling [h]
0 2 4 6 8 10 12 soil drainage [%] 0 20 40 60 80 100
soil suction decrease [%]
Schluessberg
Lutertal
Im Sertel
Fig. 3. Left: Comparison of cumulative runoff coefficients of overland flow (OF) and
subsur-face flow (SSF) in response to two follow-up sprinkling experiments with different antecedent precipitation. Right: Drainage after sprinkling. Measurements at single probes of soil mois-ture, soil suction and water level were averaged. To allow for comparison, not the absolute values, but percentages are given, where 100% corresponds to the maximum increase of a given parameter related to its value before the experiment.
HESSD
4, 2143–2167, 2007
Temporal variability of subsurface stormflow formation
P. M. Kienzler and F. Naef
Title Page Abstract Introduction Conclusions References Tables Figures ◭ ◮ ◭ ◮ Back Close
Full Screen / Esc
Printer-friendly Version Interactive Discussion EGU Schluessberg precipitation sum [mm] 0 20 40 60 80 100 120 140 160 SSF flow rate [mm h -1] 0 2 4 6 8 10 SSF low shallow SSF high Lutertal precipitation sum [mm] 0 20 40 60 80 100 120 140 160 SSF flow rate [mm h -1] 0 2 4 6 8 10 SSF low SSF high precipitation sum [mm] 0 20 40 60 80 100 120 140 160 SSF flow rate [mm h -1] 0 2 4 6 8 10 SSF low SSF high Im Sertel Schluessberg precipitation sum [mm] 0 20 40 60 80 100 120 140 160
cumulative runoff coefficient
0,0 0,1 0,2 0,3 0,4 SSF low shallow SSF high OF high Lutertal precipitation sum [mm] 0 20 40 60 80 100 120 140 160
cumulative runoff coefficient
0,0 0,1 0,2 0,3 0,4 SSF low SSF high OF low OF high precipitation sum [mm] 0 20 40 60 80 100 120 140 160
cumulative runoff coefficient
0,0 0,1 0,2 0,3 0,4 SSF low SSF high Im Sertel OF low OF high
Fig. 4. Runoff response to low-intensity sprinkling and high intensity sprinkling. Compared are
HESSD
4, 2143–2167, 2007
Temporal variability of subsurface stormflow formation
P. M. Kienzler and F. Naef
Title Page Abstract Introduction Conclusions References Tables Figures ◭ ◮ ◭ ◮ Back Close
Full Screen / Esc
Printer-friendly Version Interactive Discussion
EGU
infiltration until start of soil moisture increase [mm]
0 10 20 30 40 50 60 soil depth [cm] -80 -60 -40 -20 0 high intensity
infiltration until start of soil moisture increase [mm]
0 10 20 30 40 50 60 -40 -30 -20 -10 0 high intensity
infiltration until start of soil moisture increase [mm]
0 10 20 30 40 50 60 -80 -60 -40 -20 0
low intensity low intensity high intensity
low intensity
Schluessberg Lutertal Im Sertel
Fig. 5. Comparison of infiltration response to low-intensity and to high-intensity sprinkling.
HESSD
4, 2143–2167, 2007
Temporal variability of subsurface stormflow formation
P. M. Kienzler and F. Naef
Title Page Abstract Introduction Conclusions References Tables Figures ◭ ◮ ◭ ◮ Back Close
Full Screen / Esc
Printer-friendly Version Interactive Discussion
EGU
Schluessberg - high intensity
time since start of sprinkling [h]
0 5 10 15 20 soil depth [cm] -80 -60 -40 -20 0
Schluessberg - low intensity
time since start of sprinkling [h]
0 5 10 15 20 soil depth [cm] -80 -60 -40 -20 0 saturation: soil moisture related to pore volume 50 %
100 % Lutertal - low intensity
time since start of sprinkling [h]
0 5 10 15 20 soil depth [cm] -40 -30 -20 -10 0
Lutertal - high intensity
time since start of sprinkling [h]
0 5 10 15 20 soil depth [cm] -40 -30 -20 -10 0
Im Sertel - low intensity
time since start of sprinkling [h]
0 5 10 15 20 soil depth [cm] -160 -100 -80 -60 -40 -20 0
Im Sertel - high intensity
time since start of sprinkling [h]
0 5 10 15 20 soil depth [cm] -160 -100 -80 -60 -40 -20 0
Fig. 6. Soil moisture dynamics at different sites in response to different precipitation intensities.
Values of soil moisture are given in relation to pore volume, which was estimated according to Sponagel et al. (2005) from grain size distribution and packing density. Grey shaded boxes indicate sprinkling periods.
HESSD
4, 2143–2167, 2007
Temporal variability of subsurface stormflow formation
P. M. Kienzler and F. Naef
Title Page Abstract Introduction Conclusions References Tables Figures ◭ ◮ ◭ ◮ Back Close
Full Screen / Esc
Printer-friendly Version Interactive Discussion
EGU
Fig. 7. Schematic concept of runoff formation during low precipitation intensity (left) and high