Data-driven Optimization with Behavioral
Considerations: Applications to Pricing
by
Rim Hariss
M.S., Ecole Polytechnique (2014)
B.S., Ecole Polytechnique (2013)
Submitted to the Sloan School of Management
in partial fulfillment of the requirements for the degree of
Doctor of Philosophy in Operations Research
at the
MASSACHUSETTS INSTITUTE OF TECHNOLOGY
September 2019
c
○ Massachusetts Institute of Technology 2019. All rights reserved.
Author . . . .
Sloan School of Management
August 1, 2019
Certified by . . . .
Georgia Perakis
William F. Pounds Professor of Management
Sloan School of Management
Thesis Supervisor
Certified by . . . .
Yanchong Zheng
Associate Professor of Operations Management
Sloan School of Management
Thesis Supervisor
Accepted by . . . .
Patrick Jaillet
Dugald C. Jackson Professor
Co-Director, Operations Research Center
Data-driven Optimization with Behavioral Considerations:
Applications to Pricing
by
Rim Hariss
Submitted to the Sloan School of Management on August 1, 2019, in partial fulfillment of the
requirements for the degree of
Doctor of Philosophy in Operations Research
Abstract
This thesis aims to introduce descriptive and predictive models that guide more in-formed pricing strategies in practice, drawing from interdisciplinary work of current OM, behavioral theories and recent machine learning advances.
In chapter 2, we integrate a consumer purchase experiment and an analytical model to investigate how consumers’ price-based quality perception, expected mark-down, and a product’s availability information influence a retailer’s markdown pricing strategy. We subsequently develop a consumer model that incorporates consumers’ price-based quality perception observed from the experimental data and consumers’ potential loss aversion. We embed this consumer model into the retailer’s markdown optimization and examine the impact of these behavioral factors on the retailer’s op-timal strategy.
In chapter 3, we study a retailer’s optimal promotion strategy when demand is affected by different classes of customers’ status in the rewards program and their heterogeneous redemption behavior. We formulate the retailer’s problem as a dy-namic program and prove a unique optimal threshold discounting policy. We also propose an approximation algorithm of the optimal price as a convex combination of the optimal prices for each class separately. Using data from a fast food chain, we assess the performance of the algorithm and the optimal pricing compared to current practice.
In chapter 4, we are concerned with accurately estimating price sensitivity for listed tickets in the secondary market. In the presence of endogeneity, binary out-comes and non-linear interactions between ticket features, we introduce a novel loss function which can be solved using several off-the-shelf machine learning methods. On a wide range of synthetic data sets, we show that our approach beats state-of-the-art machine learning and causal inference approaches for estimating treatment effects in the classification setting.
In chapter 5, we consider an optimization problem with a random forest objective function and general polyhedral constraints. We formulate this problem using Mixed Integer Optimization techniques and show it can be solved to optimality efficiently using Pareto-optimal Benders cuts. We prove analytical guarantees for a random forest approximation that consists of only a subset of trees. We also propose heuris-tics inspired by cross-validation and assess their performance on two real-world case studies.
Thesis Supervisor: Georgia Perakis
Title: William F. Pounds Professor of Management Sloan School of Management
Thesis Supervisor: Yanchong Zheng
Title: Associate Professor of Operations Management Sloan School of Management
Acknowledgments
First and foremost, I would like to express my immense gratitude to my advisors Professors Georgia Perakis and Karen Zheng. I consider myself doubly fortunate to have had both of you as my advisors. Your work ethic and dedication as professors, researchers, and advisors was invaluable, providing me with a great example for my future academic career. I am beyond grateful for your support in exploring research topics that I am passionate about, as well as for broadening my research horizon and teaching me about new fascinating and emerging topics. I would also like to thank Professor Vivek Farias for serving in my thesis committee and for his insightful questions and comments. It was a great pleasure to be his teaching assistant for his class during my third year. I would also like to thank Laura Rose and Andrew Carvalho who always offered their help over the years as well as all the ORC faculty members.
Next, I would like to acknowledge my co-authors for work in this thesis. I would like to thank Max Biggs with whom I spent countless hours working closely on Chap-ters 3 and 4. We shared many exciting discussions both about meaningful and non meaningful topics equally. He has been an amazing colleague who motivated me to persevere and think creatively. Not only that, he has been a generous friend whose calm and insightful advice I can always rely on. I would also like to thank Park Sinchaisri who I collaborated with on Chapter 2 and with whom I enjoyed learn-ing behavioral research tremendously. His cheerful and kind nature made research meetings much more fun and productive, and I am happy to call him a dear friend. Chapter 4 is also joint work with Charles Herrmann and Michael Li whose dedication and valuable input to this work is stellar. Thanks are due to Michael Alley for his industrial expertise and for offering us the opportunity to work with real world data in Chapter 4. Many thanks to Nicholas Baladis for his assistance with data wrangling and analysis in Chapter 3.
My time at MIT would have not been nearly as special if it wasn’t for an army of friends and colleagues whose support I could count on. The work in this thesis
has been advanced by numerous discussions with labmates and friends in the ORC including Charles Thraves, Andrew Li, Nishanth Mundru, Jonathan Amar, Lennart Baardman, Divya Singhvi, Somya Singhvi and Elizabeth Paulson. In particular, special thanks to Ali Aouad, Maxime Cohen, Jean Pauphilet and Yee Sian Ng who provided me judicious advice during this critical year. Thank you to Tamar Cohen-Hillel and Deeksha Sinha for many sweet and thoughtful conversations. Many thanks to Amine Anoun, Colin Pawlowski, Daisy Zhuo, Arthur Flajolet, Ludovica Rizzo, Ilias Zadig, Virgile Galle, Anna Papush and anyone else I may have missed for a wonderful ORC journey together.
Thank you to my past roommates Konstantina Mellou and Aicha Ben Dhia for sharing many memorable times together. I am grateful to my French girls squad Isabelle Su, Elise Ledieu and Anne Colin, who have been so helpful and supportive throughout these five years. I am blessed to have met Hiba Tazi, Yousef Aroub, Yacine Zerkdi, Bahia El Oddi and Mariam Dahbi who brought some moroccan warmth to the bostonian cold when I was feeling the most homesick.
Last but not least, I would like to thank my family for the never ending amount of support, love, motivation and guidance throughout my entire life. Thank you for your trust and encouragements to pursue my dreams abroad. To my father Dr. Abdelmajid Hariss, thank you for instilling in me a lifelong love for learning and striving to excellence. I thank my brother Oualid Hariss for his wise advice, constant cheer and for supporting me in everything. Finally, thanks to my mother Najat Kehil, for her unconditional love and many sacrifices that are the fuel for my success. I dedicate this thesis to her.
Contents
1 Introduction 17 1.1 Summary . . . 17 1.2 Motivation . . . 18 1.3 Thesis Contributions . . . 21 1.3.1 Methodology . . . 21 1.3.2 Managerial Impact . . . 242 Markdown Pricing with Quality Perception 27 2.1 Introduction . . . 27
2.2 Research Setup and Methodology . . . 31
2.3 The Online Consumer Study . . . 32
2.3.1 Study Design and Procedure . . . 33
2.3.2 Study Results . . . 36
2.3.3 Robustness Study: The Impact of Product Availability . . . . 42
2.4 The Model . . . 43
2.4.1 The Consumer Model . . . 45
2.4.2 Consumers’ Purchase Decisions . . . 48
2.4.3 The Retailer’s Optimal Markdown Strategy . . . 52
2.4.4 The Impact of Inventory . . . 54
2.4.5 The Impact of Quality Perception . . . 57
2.4.6 The Impact of Consumers’ Expected Markdown . . . 60
2.5 Quantifying the Impacts of Quality Perception and Optimism . . . . 62
3 Promotions in the Presence of Rewards Programs 69
3.1 Introduction . . . 69
3.2 Related Literature: . . . 72
3.3 Model and Setup . . . 74
3.3.1 Rewards Programs and Customers’ Redemption Behavior . . . 75
3.3.2 Retailer’s Revenue and Decisions . . . 76
3.3.3 Demand Model . . . 76
3.4 Dynamic Programming Forumulation . . . 77
3.4.1 Model for One Class of Consumers . . . 78
3.4.2 Multi-class Model . . . 82
3.4.3 Approximation Algorithm to the Multi-class Problem . . . 84
3.4.4 Testing the Algorithm: Simulation on Synthetic Data . . . 84
3.5 Case Study: Data from a Fast-food Chain . . . 87
3.5.1 Data and Background . . . 87
3.5.2 Prediction Model Analysis . . . 90
3.5.3 Backtesting Framework: Optimizing Promotions . . . 90
3.6 Conclusions . . . 93
4 Pricing for Heterogeneous Products: Analytics of Ticket Reselling 95 4.1 Introduction . . . 95
4.2 Literature Review . . . 99
4.2.1 Causal Inference . . . 99
4.2.2 Ticket Pricing for Sporting Events . . . 101
4.2.3 Data-driven Pricing . . . 101
4.3 Heterogeneous Treatment Effect Estimation for Classification . . . 102
4.3.1 Method . . . 104
4.3.2 Consistency and Stability of Estimator ^𝜏 (·) . . . 107
4.4 Testing the Method: Experiments on Synthetic Data . . . 109
4.4.1 Homogeneous Treatment Effect Simulations . . . 109
4.5 Arbitrage Opportunity Identification . . . 116
4.5.1 Static Pricing . . . 116
4.5.2 Time-varying Pricing . . . 118
4.5.3 Global Optimization for Purchasing a Ticket Portfolio . . . 120
4.5.4 Business Considerations . . . 121 4.6 Implementation . . . 122 4.6.1 Feature Generation . . . 122 4.6.2 Instrumental Variables . . . 122 4.6.3 Predictive Accuracy . . . 124 4.6.4 Probability Calibration . . . 124 4.6.5 Back-testing Optimization . . . 126 4.7 Pilot . . . 128 4.8 Conclusions . . . 128
5 Optimizing Objective Functions Determined From Random Forests131 5.1 Introduction . . . 131 5.2 Relevant Literature . . . 136 5.3 Outline . . . 139 5.4 Model . . . 139 5.4.1 MIP Formulation . . . 141 5.5 Benders Decomposition . . . 142
5.6 Approximating Large Random Forests . . . 146
5.6.1 Cross-validation for Optimization . . . 155
5.7 Case study: Property Investment . . . 156
5.7.1 Data . . . 157
5.7.2 Prediction . . . 157
5.7.3 Formulation . . . 158
5.8 Jury Selection Case Study . . . 160
5.8.1 Background . . . 160
5.8.3 Jury Selection Formulation . . . 163
5.9 Numerical Experiments . . . 164
5.9.1 Testing Environment . . . 164
5.9.2 Solution Time . . . 164
5.9.3 Cross-validation Experiments . . . 165
5.10 Comparison with Optimizing over Other Machine Learning Objective Functions . . . 167 5.10.1 Testing Environment . . . 167 5.10.2 Results . . . 169 5.10.3 Synthetic Data . . . 171 5.11 Conclusions . . . 172 6 Conclusion 175 A Appendix of Chapter 2 177 A.1 Detailed Results of the Online Consumer Study . . . 177
A.1.1 Regression Analysis on Early Consumers’ Quality Perception . 177 A.1.2 Regression Analysis on Late Consumers’ Quality Perception . 179 A.1.3 Model Selection for the Relationships between Quality Percep-tion and Price-Related InformaPercep-tion . . . 179
A.1.4 Estimating Gain/Loss Utilities from the Consumer Study . . . 181
A.1.5 Regression Results for Robustness Study . . . 182
A.2 Proofs of Analytical Results . . . 182
A.2.1 Proof of Proposition 2.1 . . . 182
A.2.2 Proof of Proposition 2.2 . . . 184
A.2.3 Proof of Lemma 2.1 . . . 184
A.2.4 Proof of Theorem 2.1 . . . 185
A.2.5 Proof of Proposition 3 . . . 190
A.2.6 Proof of Proposition 4 . . . 191
A.2.7 Proof of Proposition 5 . . . 192
A.2.9 Proof of Proposition 7 . . . 196
B Appendix of Chapter 4 197 B.1 Derivation of Loss Function with Endogeneity . . . 197
B.2 Proof of Theorem 1 . . . 198
B.3 Optimal Price Strategy . . . 203
B.4 Feature Importance and Few Feature Formulation . . . 205
B.4.1 Feature Importance . . . 205
B.4.2 Few Feature Formulation . . . 205
B.5 Correlation Between Tickets . . . 206
B.5.1 Technical Details for Covariance Test . . . 208
B.6 Additional Numerical Experiments . . . 209
B.6.1 Treatment Effect Error with Sample Size . . . 209
B.6.2 Optimal Treatment Prescription Simulations . . . 209
B.7 Backtesting Framework . . . 211
C Appendix of Chapter 5 215 C.1 Benders Subproblem Results . . . 215
C.1.1 Calculation of Optimal Dual Solution . . . 215
C.1.2 Benders Pareto-optimal Cuts . . . 217
C.2 Hoeffding Difference Proof . . . 219
C.3 Bound of Suboptimality in the Size of M . . . 220
C.4 Hazard Rate Dominance Numerical Experiments . . . 220
C.5 Proof of Bounds for Cross Validation . . . 221
C.6 Optimizing over a Logistic Regression Objective . . . 223
C.7 Cross-validation . . . 223
C.7.1 Cross-validation, Tree Size and Overfitting . . . 224
List of Figures
2-1 Treatment Conditions and Study Flow . . . 34
2-2 Early Consumers’ Quality Perception in Period 1 . . . 37
2-3 Late Consumers’ Quality Perception . . . 39
2-4 Model Timeline . . . 44
2-5 Segmentation of Early Consumers (Proposition 2.1) . . . 50
2-6 Segmentation of Late Consumers (Proposition 2.2) . . . 51
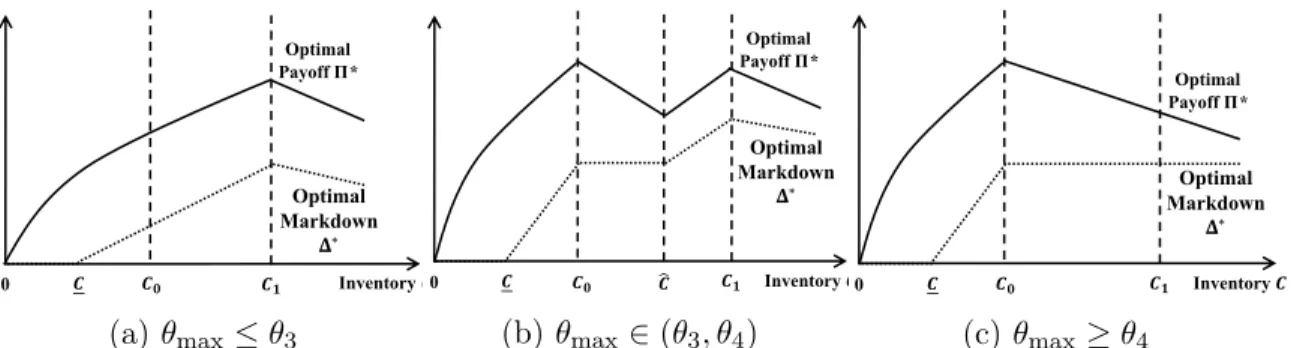
2-7 The Retailer’s Optimal Markdown Strategy (Theorem 2.1) . . . 53
2-8 Impact of Inventory 𝐶 on Optimal Markdown Δ* and Payoff Π* (Propositions 2.3 and 2.4) . . . 55
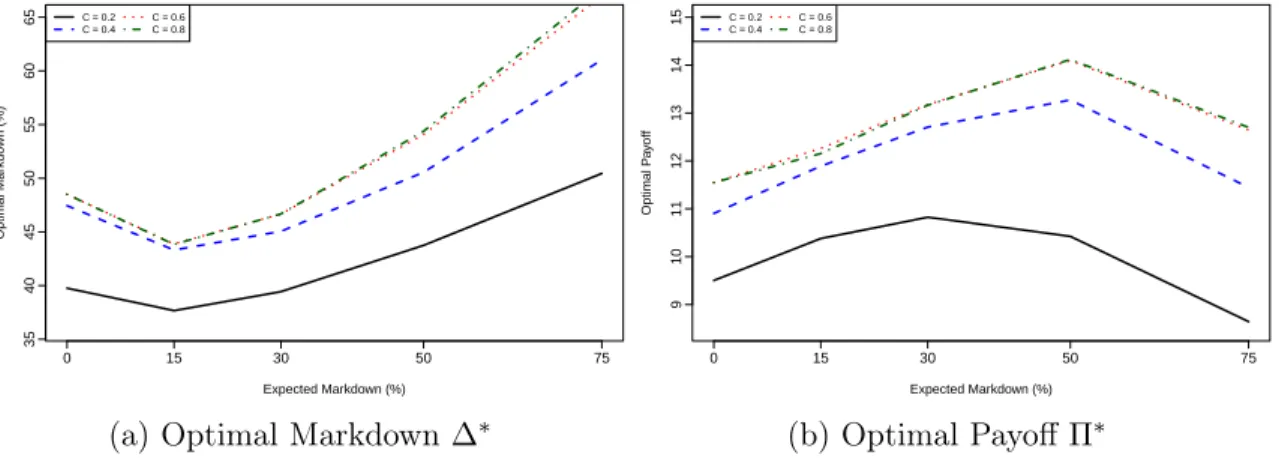
2-9 Impact of Consumers’ Expected Markdown on the Retailer’s Optimal Markdown and Payoff . . . 61
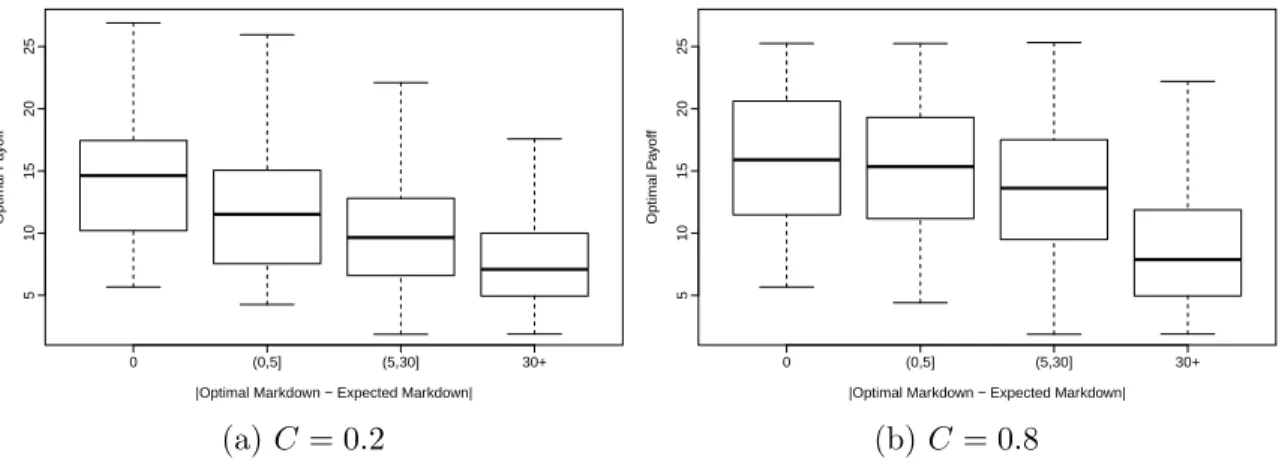
2-10 Retailer’s Optimal Payoff versus the Difference between Optimal and Expected Markdown ⃒ ⃒ ⃒Δ *− ˜Δ⃒⃒ ⃒ . . . 62 2-11 Distribution of (︂ Δ 𝑆 𝑝 − Δ* 𝑝 )︂ across Scenarios with Incorrect Assump-tions of Consumer Behavior . . . 65
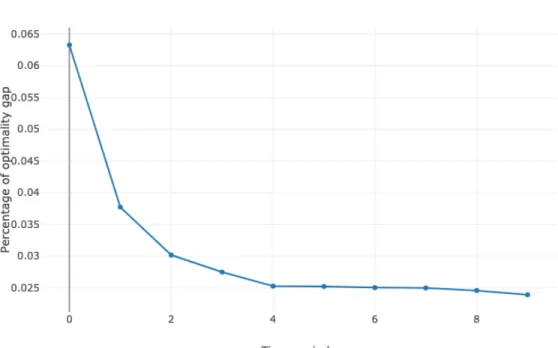
3-1 Percentage of Optimality Gap . . . 86
3-2 Optimal Price 𝑝*0 . . . 87
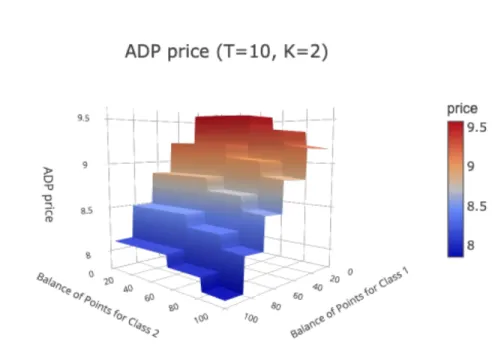
3-3 ADP Price ˜𝑝0 . . . 88
4-1 Homogeneous Treatment Effect Estimate Accuracy (𝑛 = 1000) . . . . 111
4-2 Estimating Treatment Effect for Changing Sample Size . . . 114
4-4 Sensitivity of Optimal Price and Revenue to Magnitude of Treatment
Effect . . . 118
4-5 Performance on NBA Data with IV: ROC Curve . . . 125
4-6 Calibration Curves on NBA Data . . . 126
5-1 Example Tree for Classifying Gender . . . 134
5-2 Example Tree to Illustrate Formulation with Given 𝑥 Belonging to Leaf 6140 5-3 Time Taken to Solve Algorithms for Increasing Forest Size . . . 165
5-4 Number of Juries (out of 100) which are Predicted to Return a Guilty Verdict According to Out-of-sample Model, if Optimized for Guilty Verdict . . . 169
5-5 Performance on Synthetic Data . . . 171
A-1 Participants’ Expected Discount . . . 178
B-1 Feature Importance as Evaluated by Boosted Trees . . . 205
B-2 Estimating Treatment Effect for Changing Sample Size . . . 210
C-1 Hazard Rate Dominance for 𝑌𝑖 as the Number of Trees Sampled (𝑛) Grows . . . 222
C-2 In Forest Vs out of Forest Behavior . . . 225
List of Tables
2.1 Summary of Participants’ Purchase Decisions . . . 36
2.2 Suboptimal Decision and Payoff Loss When Ignoring Quality Percep-tion and Optimism . . . 64
3.1 Statistics of customers’ redemption behavior . . . 89
3.2 Demand Estimation Regression Results . . . 91
3.3 Comparing the Pricing Policies’ Total Revenue . . . 92
4.1 Regression of Ticket and Market Features and the Average Historical Price Difference on Price . . . 123
4.2 Probit Regression of Price, Ticket and Market Features and Price Residual (from IV Model) on Selling Outcomes . . . 123
4.3 Predictive Accuracy and Miscalibration on NBA Data . . . 124
4.4 Comparison of Backtesting Profit Between Methods with LGBM IV Baseline (Limited to Purchasing 50 Tickets a Day) . . . 127
5.1 Examples of Optimization Problems with an Uncertain Relationship Between Actions and Outcomes . . . 132
5.2 Variables of Housing Dataset . . . 157
5.3 Predictive Accuracy House Sales Prices . . . 158
5.4 Variables of Our Dataset . . . 162
5.5 Predictive Jury Verdict Averaged over 20 Data Splits . . . 162
5.6 Cross-validation Performance on the Jury Dataset . . . 166
5.8 Difference in Sale Price of the Property Chosen Using Random Forest
(RF) vs Linear Regression as Evaluated on OOS XGBoost . . . 170
5.9 Difference in Sale price of Property Chosen Using Random Forest (RF) vs Linear Regression as Evaluated on OOS Random Forest . . . 170
A.1 Regression Estimates of Various Models on Early Consumers’ Quality Perception . . . 178
A.2 Regression Estimates of Various Models on Late Consumers’ Quality Perception . . . 179
A.3 Comparison of Candidate Models for Consumers’ Quality Perception 180 A.4 Comparison of Candidate Utility Models for Returning Consumers . . 181
A.5 Comparison of Candidate Utility Models for Late Consumers . . . 181
A.6 Regression Estimates of Various Models on Early Consumers’ Quality Perception (All Data) . . . 182
B.1 Predictive Accuracy on NBA Data IV . . . 206
B.2 Difference Between Revenue at Prescriptive Price ^𝑇 and True Optimal Price 𝑇* . . . 211
C.1 Cross-Validation Performance on Jury Dataset . . . 223
C.2 cross Validation Performance on Housing Dataset . . . 224
Chapter 1
Introduction
1.1
Summary
With the growing availability of consumer data across all industries, both praction-ners and researchers have been keen on understanding and investigating the impact of human behavior in operations management problems. The current OM and behav-ioral literature provides guidance in building hypotheses about relevant behavbehav-ioral factors in human decision making. Moreover, recent advances in machine learning have enabled the estimation of sophisticated functional relationships from data with increasing accuracy.
In this thesis, we introduce descriptive and predictive models that guide more informed pricing strategies/decisions in practice, drawing from interdisciplinary work of current OM, behavioral theories as well as recent machine learning advances. In Chapter 2, we investigate how consumers’ price based quality perception and their expectation on a future markdown influence a retailer’s markdown pricing strategy under fixed inventory; in Chapter 3, we study a retailer’s optimal promotion strat-egy when demand is affected by the customers’ engagement in the rewards program, where price sensitivity is a function of the customer’s current balance of points; in Chapter 4, we provide a data-driven study of the secondary ticket market and present a novel method for heterogeneous treatment effect estimation for classification prob-lems; and in Chapter 5, we show how to solve optimization problems with random
forest objective functions and general polyhedral constraints.
1.2
Motivation
Using real data, research in behavioral pricing investigates how consumers’ behavioral regularities in their purchase decisions impact retailers’ revenue management strate-gies. The goal is to use empirical findings to build more realistic analytical models that capture missing but salient behavioral factors. Such models not only predict hu-man behavior well but also prescribe more effective operational strategies/decisions in practice.
Two of the most important dimensions that consumers consider when making a purchase decision are price and quality. Consumers often perceive higher-priced products to have higher quality. The question of quality perception is particularly relevant for fashion retailers who frequently practice price markdowns. In fact, less is known on how quality perception is affected by price markdowns, especially when multiple price-related information (e.g., the initial price, the markdown applied, the final selling price) is presented simultaneously. Furthermore, it is an open question whether early consumers (those who first observe the product sold at its initial price and later observe it sold at markdown) versus late consumers (those who only observe the product already sold at markdown) use price information differently to form quality perception. This directly motivates the primary goal of Chapter 2, where we integrate a consumer purchase experiment and an analytical model to investigate how consumers’ price-based quality perception, expectation on the future markdown, and a product’s availability information influence a retailer’s markdown pricing strategy. We design our experiment to address these questions, both of which are highly relevant to a markdown setting. Our experimental results demonstrate that early and late consumers form distinctive quality perception that can be modeled through a unified framework. We subsequently develop a consumer model that incorporates consumers’ price-based quality perception observed from the experimental data and consumers’ potential gain/loss emotion due to an expectation on the future markdown. We embed this consumer model into the retailer’s markdown optimization and examine
the impact of these behavioral factors on the retailer’s optimal strategy.
To drive customer demand and increase store traffic, one of the most common mar-keting strategies that retailers adopt is price discounts/promotions. A related strategy is the use of loyalty or rewards programs, which can affect consumers’ purchase de-cisions and thus affect the seller’s pricing strategy. When designing its promotional strategy, the retailer needs to reliably predict market demand and estimate revenue when both strategies are adopted; as customers not only purchase repeatedly from the retailer but also earn and redeem points. Thus, in Chapter 3, we study a retailer’s optimal promotion strategy when demand is affected by the customers’ status in the rewards program. We model demand as a general linear function with price in which both the intercept and the price sensitivity coefficient are functions of the customers’ current point balance. The model accounts for different classes of customers based on their heterogeneous inter-temporal dynamics of their redemption behavior. We model the retailer’s decision problem as a dynamic program (DP), where the states are given by the vector of average points’ balances for each class. Under some assumptions on the demand parameters, we show that a unique optimal threshold discounting policy exists; where the store would discount a product to a particular price only if the aver-age customer’s balance of points is above a certain threshold. Furthermore, when the number of classes increases, the DP suffers from the curse of dimensionality. We thus propose an approximation algorithm of the optimal price as a convex combination of the optimal prices for each class separately. Finally, we test the performance of the algorithm and the optimal pricing strategy on data from an established North American fast food chain, compared to the retailer’s current pricing strategy.
In the first two chapters, we have studied two pricing contexts (markdowns and promotions) when demand is affected by some particular behavioral considerations (price-based quality perception and customers’ status in the rewards program). It remains that firms have difficulty in accurately estimating demand and its price sen-sitivity, particularly in information-rich environments such as ticket marketplaces. Demand in secondary markets have a high elasticity to price, that varies heteroge-neously across different tickets. In Chapter 4, we provide a data-driven study of the
secondary ticket market. In particular, we are primarily concerned with accurately estimating price sensitivity for listed tickets. In this setting there are many issues including endogeneity, heterogeneity in price sensitivity for different tickets, binary outcomes and non-linear interactions between ticket features which make the estima-tion problem challenging. Our secondary goal is to highlight how this estimaestima-tion can be integrated into a prescriptive trading strategy for buying and selling tickets in an active marketplace. Accurate specification of the demand function is an often over-looked area within the pricing and revenue management community. If the model is not able to accurately capture the causal effects of price, any price optimization risks being suboptimal. We present a novel method for heterogeneous treatment effect esti-mation for classification tasks. Furthermore, we introduce a novel loss function which can be easily incorporated into powerful, off-the-shelf machine learning algorithms, including gradient boosted trees. We show how we can also incorporate instrumental variables to address hidden confounding factors. We prove consistency and rates of convergence for our estimation procedure. Using a wide range of synthetic data sets, we show this approach beats state-of-the-art machine learning and causal inference approaches for estimating treatment effects in the classification setting.
Many optimization problems arise in operations management applications due to firms wanting to improve their performance by leveraging the data they have avail-able. For example, often firms have data in terms of demand (possibly censored) at different prices, and would like to set prices in an intelligent way so as to maximize revenue or profit. In particular, the goal of this stream of work is to study a class of problems where machine learning is used to predict the outcome of a given decision, for example revenue in response to a set of prices for different goods. Subsequently, the goal of this work has been to show how to optimize over that machine learning function, directly using its structure, as an objective function. In Chapter 5, we ex-amine a data-driven optimization approach, where an uncertain objective function is estimated using a random forest. We explore how to make optimal decisions, as evaluated by the random forest, where these decisions can be constrained by an arbi-trary polyhedral set. We model this optimization problem as a Mixed Integer Linear
Program (MILP). We show this model can be solved to optimality efficiently using Pareto-optimal Benders cuts for ensembles containing a modest number of trees. We consider a random forest approximation that consists of only a subset of trees and establish that this gives rise to near-optimal solutions by proving analytical guaran-tees. Motivated by this result, we propose heuristics inspired by cross-validation that optimize over smaller forests rather than one large forest. We present case studies on a property investment problem and a jury selection problem. We show this approach performs well against benchmarks, while providing insights into the sensitivity of the algorithm’s performance for different parameters of the random forest.
1.3
Thesis Contributions
We next describe in details the contributions of each part of the thesis, first in terms of methodology and subsequently, in terms of managerial/practice insights.
1.3.1
Methodology
In this thesis, we have used methods from experimental design, machine learning, dynamic optimization, econometrics and data analysis. With the aim of proposing algorithms that yield good solutions, we seek to complement it with theoretical justi-fication and motivation, as well as computational results with synthetic data, testing both the model and the algorithm’s performance.
In Chapter 2, we first integrate an online consumer study together with an ana-lytical model to investigate how consumers’ price based quality perception and their expectation on a future markdown influence a retailer’s markdown pricing strategy under fixed inventory. In the online consumer study, participants from Amazon Me-chanical Turk and from the MIT Executive MBA class face a hypothetical situation of shopping for different categories of products. The study is designed to answer the following main questions: (i) How do a product’s initial price and early consumers’ expectation of future markdown affect their quality perception of the product? (ii) Do early consumers who decide to wait for a markdown change their quality perception when they observe the markdown in the future? (iii) How do a product’s initial price,
the level of markdown applied, and late consumers’ expected markdown affect their quality perception of the product? (iv) Does the discrepancy between consumers’ expected markdown and the actual markdown create any gain or loss feelings that af-fect their purchase decisions? We then leverage the resulting data to derive functional relationships between consumers’ perceived quality and the relevant price informa-tion. We develop a consumer model that incorporates consumers’ price-based quality perception and their emotional loss when their expected markdown is too optimistic as compared to the actual markdown. By grounding our consumer model in the data, we enhance our model’s capability to capture the actual customer behavior. This in turn improves the practicality of the resulting markdown optimization. Second, we embed the consumer model into the retailer’s markdown optimization and examine the impact of inventory and consumers’ behavioral factors (price-based quality per-ception, price reference dependence, loss aversion) on the retailer’s optimal strategy. Through extensive numerical simulations, we highlight that ignoring the behavioral factors captured in our model can substantially hurt the retailer’s payoff. As such, we contribute to the recent literature that capture consumers’ behavioral regularities beyond the full-rationality regime in RM models. We believe this approach adds to the growing literature that advances consumer research by studying the joint impacts of multiple salient behavioral factors in revenue management.
In Chapter 3, we study a retailer’s optimal promotion strategy for a single product in the presence of rewards programs. Our approach incorporates price-sensitivity based on points balance into the optimization of dynamic promotion pricing strategies. We consider general demand models that are affected by different classes of customers’ status in the rewards program. The retailer’s promotion problem can be modeled as a DP where the states (the balance of points of 𝐾 different classes of customers) evolute endogeneously across time. The inter-temporal dynamics of the redemption behavior, and the heterogeneous price sensitivity in the demand model makes the problem more realistic but also harder to solve in practice. Not only the DP suffers from the curse of dimensionality (with respect to the number of classes), but also the non concavity of the value function makes it difficult to derive any structural results on the optimal
strategy. Motivated by this, we (a) derive conditions on the demand function under which the value function is concave and the optimal pricing strategy is decreasing with the consumers’ balance of points; (b) propose an approximation pricing policy that finds the optimal price for each class of consumers and computes a weighted average of these prices. The solve time of the model drops from being exponential to being linear in the number of classes. Furthermore, synthetic experiments show the algorithm have a small optimality gap.
In Chapter 4, we introduce a semi-parametric model for classification, where price sensitivity is heterogeneous with respect to the high-dimensional market and product features. In the context of secondary markets, price is endogeneous with the ticket’s covariates and each ticket is thought of as a unique product (binary outcome). The es-timation procedure in this case is particularly challenging. We show how to accurately estimate the heterogeneous price sensitivity in this model by introducing a general dou-ble/orthogonalized machine learning method for classification problems. The resulting loss function is novel, supports general functional forms for price sensitivity and can be optimized using sophisticated machine learning algorithms, such as XGboost and Neural Networks. Moreover, we extend the model to incorporate instrumental vari-ables when the data suffers from hidden confounders. We prove consistency and rates of convergence for our estimation procedure. Furthermore, over a wide range of synthetic data sets, we show our approach beats state-of-the-art machine learning and causal inference approaches for estimating treatment effects in the classification setting. We also note that the methodology introduced in this chapter can be gener-alized to pricing other heterogeneous products, as well as healthcare applications for estimating intervention effects with binary outcomes.
Finally, in many optimization problems machine learning is used to predict the outcome of a given decision, for example revenue in response to a set of prices for different goods. In Chapter 5, we show how to optimize over objective functions that are determined from a class of machine learning algorithms (random forests), under general polyhedral constraints. The class of optimization problems we introduce is general and is applicable when there is observational data on previous decisions and
resultant outcome, as occurs in online retail, personalized medicine and insurance. Furthermore, random forests are a very powerful and popular prediction algorithm; it captures high dimensional, non-linear and complex interactions of features and re-quires minimal feature engineering. Plus, random forests, and more generally tree based ensemble methods (XGBoost, AdaBoost among others) have special combina-torial structure. This in turn allow us to formulate this problem using techniques from mixed-integer linear optimization and show it can be decomposed and solved iteratively using Pareto-optimal Benders cuts. This is because the subproblem is shown to be naturally integer, and using duality, we can consider Benders cuts that yield a significant speed improvement. However, for large scale random forest opti-mization problems, we introduce an approximation approach that samples the trees and optimizes over a smaller, sampled forest. We show that the sub-optimality of the approximate solution decays exponentially with the number of trees in the smaller random forest. This insight is confirmed in our numerical studies as optimizing over a smaller forest gives sufficient performance in a fraction of the time. We then propose heuristic algorithms which optimize over smaller forests using an approach inspired by cross-validation. We also derive analytical upper and lower bounds on the perfor-mance of the optimal solution from the heuristic.
1.3.2
Managerial Impact
The work in this thesis combines different streams of techniques to propose models that unravel interesting key tradeoffs and new insights about real-world business problems. In particular, two out of the four parts are in collaboration with industry practitioners: Chapter 3 is joint with a North American fast food chain and Chapter 4 with a major ticket resaler platform. In Chapter 3, we leverage transactional data from the company to assess the performance of the algorithm and the optimal pricing strategy. We perform counterfactual analysis to evaluate the revenue impact of the proposed approximate promotion strategy compared to the current practice of the retailer. In average, the ADP achieves 19% relative improvement, and is able to achieve more than 95% of optimality under a fraction of time it takes to solve for
the optimal prices. Insights from this analysis can be offered to the fast food chain company to help with current efforts on redesigning its promotion strategy.
In Chapter 4, using NBA ticket listings from the 2014-2015 season, we show that IV probit methods previously used for price estimation of tickets in the resale market are significantly less accurate and potentially misspecified relative to our proposed approach. Through pricing simulations we show our proposed method is able to achieve an 11% ROI by buying and selling tickets, while existing techniques are not profitable. The knowledge of how to price tickets on its platform offers a range of potential opportunities for our collaborator, both in terms of understanding sellers on their platform and in developing new products to offer them.
We also consider alternative sources of data, other than from industry collabora-tors. In Chapter 2, we gather data through a designed online experiment to study the particular context of markdown pricing with quality perception. This allows us to quantitatively model quality perception’s relationship with price, and embed it in an optimization framework. We obtain a few unique insights that to the best of our knowledge, are new relative to the current literature, and can guide retailers in practice in deciding their markdown strategy. Finally in Chapter 5, we demon-strate the effectiveness of our approach using two exciting and unconventional real world case studies, namely jury selection and the property investment problem. We show this method outperforms other machine learning objective functions, yielding near-optimal solutions in a fraction of time.
Chapter 2
Markdown Pricing with Quality
Perception
2.1
Introduction
1 Price and quality are two important dimensions that consumers consider when
making a purchase decision. Interestingly, it has long been shown that the selling price of a product is a critical signal of product quality perceived by consumers (e.g., Monroe 1973, Rao and Monroe 1988, Gneezy et al. 2014). A higher price often induces higher quality perception (e.g., Rao and Monroe 1989, Rao and Bergen 1992, Bagwell and Riordan 1991, Lichtenstein et al. 1991, Plassmann et al. 2008). Less is known about the role of price discounts in affecting consumers’ quality perception. Some have shown that price discounts positively affect consumers’ perception of product value (e.g., Compeau and Grewal 1998, Darke and Dahl 2003), while others show the opposite (e.g., Raghubir and Corfman 1999).
Better understanding the price–(perceived) quality relationship is particularly rel-evant for fashion retailers who frequently practice price markdowns. Under a mark-down strategy, the retailer sells a product at a high initial price and marks the price
1The authors thank Gad Allon, Xuanming Su, the participants in the 2015 MSOM Conference
(Toronto, Canada), the 2016 INFORMS Revenue Management and Pricing Section Conference (New York, NY), the 2016 Annual Behavioral Operations Conference (Madison, WI), and research seminar at MIT for their helpful feedback. The authors gratefully acknowledge financial support from NSF grants CMMI-1162034 and CMMI-1563343.
down as the product approaches the end of its selling season. Recent statistics show that sales under price markdowns have contributed to more than 30% of total rev-enues in department and specialty stores in the United States, up from less than 10% in the 1970s (Fisher and Raman 2010). Frequent practice of price markdowns has gradually changed consumers’ purchase patterns, and such changes have caught the attention of both practitioners and researchers. We have seen a surge of studies in revenue management that investigate forward-looking consumer behavior (where consumers postpone their purchase to take advantage of markdowns) and the impact of such behavior on the retailer’s optimal strategy (e.g., Besanko and Winston 1990, Aviv and Pazgal 2008, Gallego et al. 2008, Levin et al. 2009). However, this body of research has not examined how markdowns impact consumers’ quality perception of the product and the associated purchase behavior.
Another behavioral impact of the frequent practice of markdowns is to induce consumers to form a certain expectation about the potential markdown that would be applied in the future. For example, if consumers frequently observe a 50% mark-down in past seasons, then they may naturally expect the same markmark-down being applied in the current season. Researchers have shown that historical prices and dis-counts substantially influence consumers’ reference prices for future transactions (e.g., Kalwani et al. 1990, Kalwani and Yim 1992, Briesch et al. 1997). Whether and how consumers’ expected markdown impacts their perceived quality of the product is yet another open question. In addition, consumers’ expected markdown does not nec-essarily match the actual markdown applied. When discrepancy occurs, consumers may experience emotional gain or loss depending on whether the discrepancy yields a lower-than-expected or a higher-than-expected price. This emotional gain or loss affects consumers’ tendency to purchase the product at markdown. Therefore, it is important for the retailer to account for these emotional effects when devising its markdown strategy.
In this chapter, we examine how consumers’ price-based quality perception and gain/loss emotion due to a pessimistic or optimistic markdown expectation impact their purchase decisions, and as a result, affect the retailer’s optimal markdown
strat-egy. To do so, we employ a methodology that combines an online consumer study with a markdown optimization model. We leverage our consumer study to derive functional relationships between consumers’ perceived quality and price-related in-formation, as well as to motivate the key behavioral factors captured in our consumer model. Subsequently, we incorporate both consumers’ quality perception and their potential gain/loss emotion in an analytical framework to study the retailer’s opti-mal markdown decision and the resulting payoff. We characterize and quantify the operational and financial impacts of these behavioral factors. Our results offer valu-able insights on how a retailer’s optimal markdown strategy should be adapted in the presence of these factors.
Related Literature and Contributions: Our work is closely related to the re-cent stream of revenue management (RM) literature that focuses on developing richer and more realistic consumer models. A large group of researchers examine consumers’ forward-looking behavior in various RM contexts, such as dynamic pricing (e.g., El-maghraby et al. 2008, Li et al. 2014, Besbes and Lobel 2015, Harsha et al. 2016), promotions (e.g., Su 2010, Cohen et al. 2014, 2016a), and capacity management (e.g., Liu and van Ryzin 2008, Cachon and Swinney 2009, Osadchiy and Vulcano 2010). See Shen and Su (2007) and Aviv and Vulcano (2012) for comprehensive reviews. More recently, researchers have begun to capture consumers’ behavioral regularities beyond the full-rationality regime. Some of the behavioral factors that have been studied in-clude reference dependence (e.g., Popescu and Wu 2007, Heidhues and Kőszegi 2008, Nasiry and Popescu 2011, Tereyagoglu et al. 2014, Baron et al. 2015), anticipated re-gret (e.g., Nasiry and Popescu 2012, Özer and Zheng 2016), availability misperception (Özer and Zheng 2016), time inconsistency (Su 2009, Baucells et al. 2016), and social comparison (Zhou et al. 2016). Recent experimental studies have investigated sim-ilar settings. For example, Osadchiy and Bendoly (2015) study whether consumers are forward-looking and find that consumers’ decisions to wait for future discounts heavily depend on their perceived risk of future availability.
We contribute to this literature in two ways. First, we integrate an online con-sumer study with analytical modeling to examine the role of concon-sumers’ behavioral
factors in affecting a retailer’s markdown pricing strategy. Within the behavioral op-erations management field, research that combines human-subject experiments with modeling and utilizes the experimental data to develop operations models is only recently gaining attention (e.g., Becker-Peth et al. 2013, Scheele et al. 2018). The only paper related to RM that we are aware of employing such an approach is Bau-cells et al. (2016). These authors focus on consumers’ risk and time preferences. We instead study a completely different dimension – consumers’ price-based quality perception.
Second, to the best of our knowledge, we are the first in the RM field to incorporate price-based quality perception into the optimization of markdown pricing strategies. While a large body of studies exist in marketing that examine how price-based qual-ity perception affects purchase intention (e.g., Rao and Monroe 1989, Raghubir and Corfman 1999, Suk et al. 2012, Gneezy et al. 2014), none of them formally analyze how pricing models should be adapted in light of such perception. We bridge this gap. In addition, following the well-established literature on reference pricing (e.g., Briesch et al. 1997, Popescu and Wu 2007), we also capture consumers’ potential gain/loss emotion due to a discrepancy between their expected markdown and the actual markdown being applied. Allowing consumers to have incorrect expectation of future markdown differs from the common assumption of rational expectations in previous RM models and captures more realistic scenarios. Our approach also follows calls for advancing consumer research by studying the joint impacts of multiple salient behavioral factors (Narasimhan et al. 2005, Ho et al. 2006).
Our analysis yields a number of new insights. For example, we show that the retailer’s optimal markdown level is nonmonotone in its inventory. In particular, the retailer should apply a larger markdown with higher inventory only up to a certain level of inventory, after which it should reduce the magnitude of its markdown to maintain the product’s perceived quality among its consumers. Furthermore, it is in the retailer’s best interest to pre-announce and commit to a markdown strategy to prevent a mismatch between consumers’ expectation about the markdown and the actual markdown applied. This approach benefits the retailer by eliminating the
neg-ative effect on sales of the consumers’ loss emotion due to an optimistic expectation. Finally, we highlight that ignoring the behavioral factors captured in our model can substantially hurt the retailer’s payoff. When inventory is tight, correctly capturing consumers’ price-based quality perception has the most significant impact on the re-tailer’s payoff (an average of 9% and worst-case of 249% loss in payoff if ignored). When instead inventory is sufficient, the retailer should be particularly mindful of the potential emotional loss that its price markdown could create among its consumers.
2.2
Research Setup and Methodology
We consider a retailer who sells one product over two periods. The product is sold at its initial price in Period 1, and it may be marked down to a lower price in Period 2. A fraction of consumers arrive in Period 1. We call them “early consumers.” The remaining fraction of consumers arrive in Period 2 and are called “late consumers.” Early consumers observe the product sold at its initial price when they arrive in Period 1. They are aware that the retailer may apply a markdown to the product in Period 2; however, they do not know the level of markdown that will be applied. Early consumers choose among three purchase options: (i) buying the product right away, (ii) waiting for the potential markdown and returning in Period 2, or (iii) leaving the market without buying. For those who wait and return in Period 2, they join the late consumers and observe the same product offered at either the initial price (if the retailer decides not to mark down) or at a discounted price (if the retailer decides to mark down). All consumers present in Period 2 either buy the product or leave the market without buying.
We model this setup as a bi-level optimization problem. The lower level mod-els consumers’ purchase decisions. Consumers need to decide whether and when to purchase the product to maximize their utilities. Both early and late consumers’ util-ities are affected by their quality perception of the product and the product’s selling price. We model the consumers’ quality perception based on the data from our online consumer study. In addition, when early consumers arrive in Period 1, they form an expectation of the potential markdown in Period 2, and some of them may choose to
wait for the markdown. The expected markdown creates a reference markdown price for these consumers. When they return in Period 2, they may observe that the actual markdown is different from their expected markdown. When a discrepancy occurs, they experience emotional gain or loss due to paying a price different than expected. Such emotional gain or loss eventually affects their utility of buying the product in Period 2. In the upper level of the optimization problem, the retailer perfectly antic-ipates consumers’ purchase decisions, and the retailer chooses the optimal markdown strategy based on this anticipation.
Our research methodology consists of two steps. First, we design and conduct an online consumer study to examine how consumers’ quality perception of a product is influenced by the available price-related information and the time (i.e., early versus late) they arrive to the market. The study setup contains two selling periods, and a markdown may be applied to the product in the second period. We utilize the data to derive functional forms that best describe the relationship between quality perception and relevant price-related information for both early and late consumers. We also examine whether consumers’ potential gain/loss emotions stemming from their markdown expectation affect their purchase decisions. Second, we incorporate results from the consumer study into the consumer utility model, and characterize consumers’ optimal purchase decisions as well as the retailer’s optimal markdown strategy. In what follows, we first discuss the design and analysis of our consumer study, followed by the discussion of the analytical model.
2.3
The Online Consumer Study
We design and implement an online consumer study in which participants face a hypothetical situation of shopping for a new dress shirt (for male participants) or a new blouse (for female participants). The study is designed to answer the following main questions: (i) How do a product’s initial price and early consumers’ expectation of future markdown affect their quality perception of the product? (ii) Do early consumers who decide to wait for a markdown change their quality perception when they observe the markdown in the future? (iii) How do a product’s initial price,
the level of markdown applied, and late consumers’ expected markdown affect their quality perception of the product? (iv) Does the discrepancy between consumers’ expected markdown and the actual markdown create any gain or loss emotions that affect their purchase decisions?
2.3.1
Study Design and Procedure
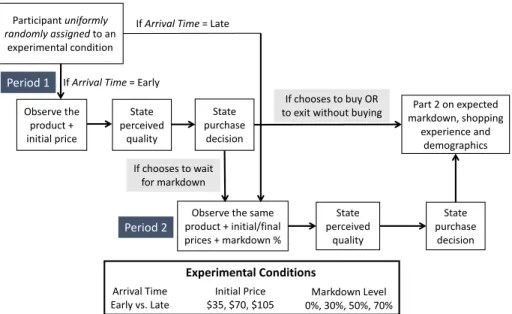
Study design: The key treatment variables we manipulate in the study are a par-ticipant’s arrival time to the store, the initial price of the product in Period 1, and the level of markdown applied to the product in Period 2 (in percentage off from the initial price). We employ a 2 (arrival time: early vs. late) × 3 (initial price: $35, $70, $105) × 4 (markdown level: 0%, 30%, 50%, 70%) between-subject factorial design. That is, each participant only experiences one of the twenty-four treatment conditions. We randomly assign participants to these treatment conditions in a balanced fashion so that each condition involves 20 participants. We choose the initial prices by sampling actual market prices of similar items.2 We include a 0% markdown to capture the
scenario where the product is not marked down in Period 2. Participants assigned to the early arrival time condition (early consumers) arrive in Period 1 when the product is sold at its initial price. They are informed that the product may be marked down at a later time. Conversely, participants assigned to the late arrival time condition (late consumers) arrive in Period 2 when the product is already marked down (if any). The gap between these two periods is fixed to be three months and is explicitly shown to the participants. To solely focus on the effect of price information on consumers’ quality perception, we assure early consumers that the product will be available in Period 2 should they decide to wait for a markdown.3 Thus, the only friction against waiting for a markdown in our study is the time spent waiting for Period 2 to come (simulated by a delay in the study).
2Specifically, we observe that the average market price for a dress shirt sold on Macy’s.com is
$70.00. We take the lower (higher) price to be 50% (150%) of this average price and use the same set of initial prices for the blouse.
3In §2.3.3, we confirm the validity of our results in a robustness study where a stockout is possible
Participant uniformly randomly assigned to an experimental condition Observe the product + initial price State perceived quality
Observe the same product + initial/final prices + markdown % If Arrival Time = Early
If Arrival Time = Late
If chooses to wait for markdown Period 1 State perceived quality Period 2 State purchase decision If chooses to buy OR
to exit without buying markdown, shopping Part 2 on expected experience and demographics State purchase decision Arrival Time
Early vs. Late $35, $70, $105Initial Price 0%, 30%, 50%, 70%Markdown Level
Experimental Conditions
Figure 2-1: Treatment Conditions and Study Flow
Participants and procedure: We conducted the study on Amazon Mechanical Turk. In total, 958 participants completed the study.4 50% of them were male; the
median age was 33 years old with a standard deviation of 11 years. Participants received a flat rate compensation of $2.00 for completing the study, which took on average 7.5 minutes. The study consists of two parts. In part 1, participants evaluate the product shown, state their quality perception, and make purchase decisions. In part 2, they answer questions regarding their general experience of buying similar products and their demographics. We next explain in more detail the general flow that a participant goes through during the study, as illustrated in Figure 2-1.
If a participant is assigned to be an early consumer, then the participant is shown a picture of the product along with some descriptions of the product’s characteristics, including its initial price at which the product is currently sold, and the fact that it may be marked down to a lower price in three months. The participant is asked to state his or her quality perception of the product on a 0–100 scale. A higher value means the product is perceived to have higher quality. The participant then answers how much discount (in % off) he or she expects to be applied to the product in three months. Afterwards, the participant chooses one of three options: (a) buying the
4We collected data from 24 (treatments) × 2 (genders) × 20 = 960 participants. Two of the
product now at its initial price, (b) waiting for a markdown and returning in Period 2, or (c) leaving the store without buying. If the participant chooses (a) or (c), then he or she will be directed to part 2 of the study. If instead, the participant chooses (b), then he/she will be directed to Period 2 and will observe the exact same product with markdown information, including the initial price, the % discount off, and the final selling price. Given the new information, the participant is again asked to state his or her quality perception of the product. Finally, the participant indicates whether to buy the product or leave the store without buying, after which he or she is directed to part 2 of the study.
If a participant is assigned to be a late consumer, then the participant is directed to Period 2 immediately. This means that the participant observes the product, its characteristics, and the markdown information as discussed above. The participant is also told that the product was sold at its initial price three months ago. He or she then states his or her quality perception of the product on a 0–100 scale and indicates his or her purchase decision: buy the product or leave without buying. The participant is finally directed to part 2 of the study.
In part 2 of the study, all participants answer a series of questions regarding their general experience of shopping for similar products. One key question is that we ask them to provide the typical markdown level they observe when they shop for similar products. We consider their answers to this question as an approximate measure of their expected markdown for the product. In addition, we use Likert-scale questions to measure participants’ familiarity with the product, their frequency of purchasing similar products, and how well their pre-purchase quality perception typically matches with their post-purchase experience. Finally, we elicit participants’ demographic information including gender, age, income level, and highest education. Because the study involves hypothetical purchase scenarios and is conducted on-line, we follow best practices and established protocols used by academic researchers to ensure our participants provide careful and informative answers (e.g., Paolacci et al. 2010, Buhrmester et al. 2011, Mason and Suri 2012). In particular, a participant was allowed to participate in our study only if he or she satisfied all of the following
cri-teria: (i) his or her HIT approval rate must be greater than or equal to 99%; (ii) he or she must have completed at least 1,000 HITs approved by Mechanical Turk Requesters; and (iii) he or she must be located in the United States.5 Furthermore, we include an attention check question in a random position within the study. The data we use for our analysis considers only those participants who have passed the attention check.
2.3.2
Study Results
Table 2.1 presents a summary breakdown of the participants’ purchase decisions. The categories Return-Buy and Return-Exit correspond to early consumers who choose to wait for a markdown and eventually purchase the product or exit the market without buying. We note that our results on quality perception apply to all consumers regard-less of their purchase decisions. We next analyze the four main research questions outlined at the start of §4.4.
Table 2.1: Summary of Participants’ Purchase Decisions Buy Exit Return-Buy Return-Exit Total
Early consumers 24 179 190 82 475
Late consumers 189 294 – – 483
Total 213 473 190 82 958
Early consumers’ quality perception in Period 1.
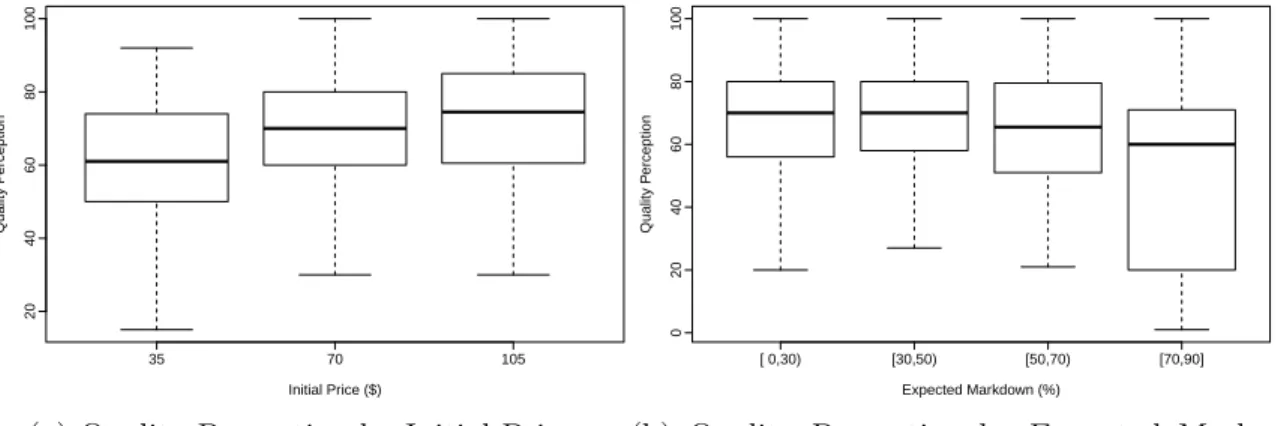
A total of 475 participants (49.6%) are assigned to be early consumers; i.e., they arrive in Period 1. Figure 2-2 shows the distribution of quality perception stated by early consumers conditional on the initial price (Figure 2-2a) and the expected markdown stated by the participants (Figure 2-2b).6 We observe that quality perception tends
5A HIT is a survey or a task posted on Amazon Mechanical Turk by a Mechanical Turk Requester
(such as a researcher). A requester must approve a participant’s satisfactory completion of a HIT before paying the participant. Thus, the higher approval rate and the larger number of approved HITs for a participant, the better performance this participant has demonstrated in past studies.
6In our study, early consumers both stated their expected markdown for the product shown
(in part 1 of the study) and the typical markdown level they observed when shopping for similar products (in part 2 of the study). We verify that their responses to these two questions are not significantly different (Wilcoxon signed rank test, 𝑝 = 0.61). In Figure 2-2b and our subsequent analysis, we use the expected markdown they stated in part 1 of the study.
35 70 105 20 40 60 80 100 Initial Price ($) Quality P erception
(a) Quality Perception by Initial Price
[ 0,30) [30,50) [50,70) [70,90] 0 20 40 60 80 100 Expected Markdown (%) Quality P erception
(b) Quality Perception by Expected Mark-down
Figure 2-2: Early Consumers’ Quality Perception in Period 1
to increase in the initial price and decrease in the expected markdown. To formally analyze the relationship among early consumers’ quality perception, the product’s initial price, and the consumers’ expected markdown, we estimate a series of regression models with the participants’ quality perception as the dependent variable and the initial price and the expected markdown as key independent variables (Appendix A.1.1).7 We observe a significantly positive coefficient for the initial price and a significantly negative coefficient for the expected markdown. Hence, we conclude that early consumers’ quality perception in Period 1 increases with the product’s initial price but decreases with their expected markdown.
Returning consumers’ quality perception in Period 2.
We next examine whether early consumers who choose to wait for a markdown change their quality perception when they observe the discounted price in Period 2. Out of the 272 early consumers who choose to wait, only 38 (13.97%) of them report a change in their quality perception in Period 2. Among these 38 participants, the average percentage change in their quality perception is 1.77%. For all returning consumers, their quality perception in Period 2 is not significantly different from that in Period 1 (Wilcoxon signed rank test, 𝑝 = 0.70). Therefore, we conclude that early
7We also control for the participants’ demographics and general experience of shopping for similar
products. Only gender has a significant effect and thus is included in the results presented in the appendix.
consumers who choose to wait for a markdown rarely change their quality perception when they observe the markdown in Period 2.8
Late consumers’ quality perception.
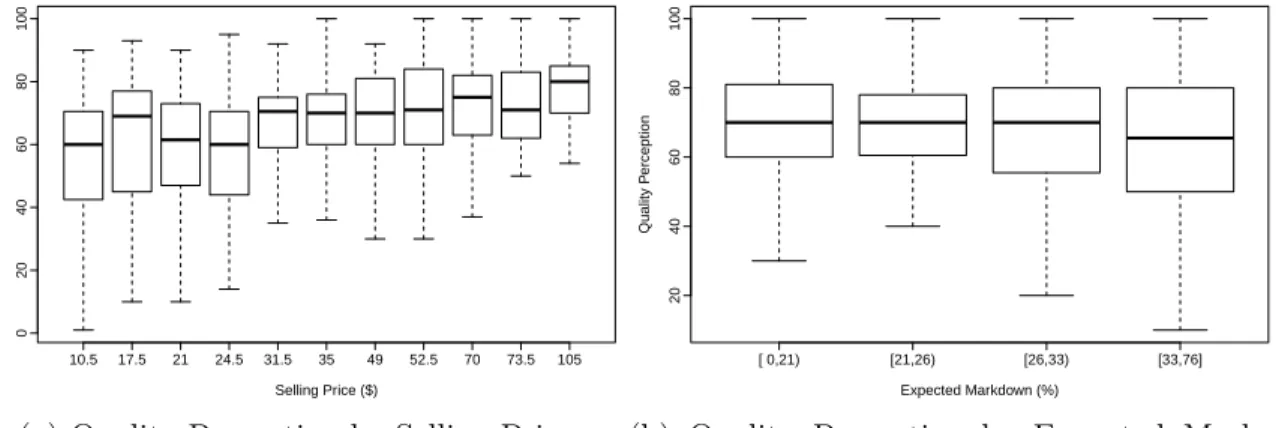
A total of 483 participants (50.4%) are assigned to be late consumers; i.e., they arrive in Period 2. Figure 2-3 presents the distribution of late consumers’ quality percep-tion condipercep-tional on the final selling price (i.e., the initial price minus the markdown) and their expected markdown.9 We observe from Figure 2-3a that late consumers’
quality perception tends to increase in the final selling price. Conversely, Figure 2-3b demonstrates that late consumers’ quality perception decreases only slightly with their expected markdown. To formally test these relationships, we estimate a set of regression models in which the dependent variable is late consumers’ quality per-ception and the three key independent variables are the product’s initial price or selling price, the markdown applied, and the participants’ expected markdown. We observe significantly positive coefficients for the initial/selling price and significantly negative coefficients for the actual/expected markdown. Therefore, we show that late consumers’ quality perception increases with the product’s initial/final selling price but decreases with the actual/expected markdown. Our results relate to findings by Raghubir and Corfman (1999), who find that price promotion negatively affects con-sumers’ pretrial quality perception of a new service if the consumers are unfamiliar with the service and promotions are uncommon in the industry. We demonstrate in a product purchase setting that price markdown has a similar negative effect on the perceived quality of the product, even if consumers are familiar with the product and price markdowns are common practices.
8To rule out the possibility that this result may be driven by the participants conveniently
reporting the same numbers between the two periods, we conducted a robustness study with a new set of participants in which returning consumers were asked to state their quality perception only in Period 2. Everything else remains exactly the same as in our main study. We verify that given the same treatment condition (a combination of initial price and markdown), returning consumers’ stated quality perception in this robustness study is not significantly different than what we observe in our main study (Wilcoxon rank sum tests, 𝑝 > 0.30).
9For late consumers, their expected markdown is approximated by their response to the question
10.5 17.5 21 24.5 31.5 35 49 52.5 70 73.5 105 0 20 40 60 80 100 Selling Price ($) Quality P erception
(a) Quality Perception by Selling Price
[ 0,21) [21,26) [26,33) [33,76] 20 40 60 80 100 Expected Markdown (%) Quality P erception
(b) Quality Perception by Expected Mark-down
Figure 2-3: Late Consumers’ Quality Perception
Estimating the functional relationship between consumers’ quality percep-tion and price-related informapercep-tion.
One objective of our study is to use the data to develop good functional relationships between consumers’ quality perception and relevant price-related information. Our earlier analyses show that consumers’ quality perception is affected by the product’s selling price (initial price for early consumers and final price for late consumers) and their expected markdown. In addition, early consumers who choose to wait for a markdown do not change their quality perception when they observe the actual markdown in Period 2. Therefore, we focus on estimating the consumers’ quality perception as a function of the product’s selling price and their expected markdown.10 We employ the following procedure to estimate the functional relationship. First, we perform a stepwise model selection that begins with a general model that contains polynomials of the relevant independent variable(s) up to the fourth degree and the square root(s) of the independent variable(s). The stepwise model selection process compares different nested versions of the general model that include different subsets of the independent variables and chooses the model with the best in-sample fit based
10For late consumers, an alternative is to model their quality perception as a function of the
initial price, actual markdown, and expected markdown as three separate variables. We consider this alternative model and observe non-statistically different goodness-of-fit compared to the simpler model with the final selling price and expected markdown being the main variables. Therefore, we choose to focus on the simpler formulation.
on the Akaike Information Criterion (AIC, Bozdogan 1987).11 Second, we compare the best model selected by the stepwise process to a parsimonious linear model in terms of both in-sample fit and out-of-sample prediction. To do so, we perform 5-fold cross validation for each model. Specifically, we first randomly partition the data into 5 equal-sized subsets in a stratified manner; i.e., we ensure that the proportion of data points corresponding to each treatment condition in the study (regarding gender, initial price, and markdown level) is the same in each subset as in the entire data. Next, we treat each subset as a hold-out sample, use the other 4 subsets as the training data to estimate the model coefficients, and predict the quality perception for the hold-out sample. We perform this estimation and prediction for each subset given a random partition, which constitutes one iteration of 5-fold validation. After one iteration, we compute the averages of a few performance measures for both in-sample fit (adjusted 𝑅2, AIC) and out-of-sample prediction (out-of-sample adjusted 𝑅2, mean squared errors or MSE, and mean absolute deviation or MAD). We repeat
this validation for 100 iterations, using a different random partition in each iteration. Based on these 100 iterations, we finally compute the 95% confidence intervals for the above performance measures. Appendix A.1.3 summarizes the detailed results.
Compared to the best model resulted from the stepwise selection procedure, a simple model in which quality perception is a linear function of the product’s selling price and the consumer’s expected markdown achieves comparably good in-sample and out-of-sample performance. In addition, the simple linear model affords better tractability for us to subsequently analyze the retailer’s markdown strategy. Hence, we characterize early and late consumers’ quality perception, 𝑞1 and 𝑞2, as 𝑞1 =
𝑞0 + 𝑎1𝑝 − 𝑡1Δ and 𝑞˜ 2 = 𝑞0 + 𝑎2(𝑝 − Δ) − 𝑡2Δ. To gain more insights about the˜
magnitude of the four parameters 𝑎1, 𝑡1, 𝑎2, and 𝑡2, we perform 5,000 iterations of
stratified bootstrapping to obtain the 95% confidence interval of each coefficient. Comparing these confidence intervals reveals that 𝑡1 > 𝑎1 ≥ 𝑎2 > 𝑡2. This ordering is
consistent with our previous regression results (see Appendices A.1.1 and A.1.2).
11AIC is a common measure for goodness of fit that favors smaller residual error but penalizes for
Potential gain/loss emotions due to discrepancy between expected and actual markdown.
A final behavioral question we address with the consumer study is whether consumers experience any gain or loss emotions when the actual markdown applied is different from their expected markdown. This behavioral phenomenon can potentially apply to both returning consumers (i.e., those early consumers who choose to wait for a markdown) and late consumers (who may have anticipated a markdown before arriving to the market). There is a vast literature showing that consumers often form internal reference prices which affect their purchase decisions (see Mazumdar et al. 2005, Özer and Zheng 2012, for reviews). Historical prices and markdowns are shown to significantly impact consumers’ reference prices (e.g., Kalwani and Yim 1992, Briesch et al. 1997). In our context, consumers may form an expected markdown based on their past experience of purchasing similar products. This expectation creates a reference markdown price that they anticipate in Period 2. If the actual markdown applied is larger than consumers’ expectation, then they would experience a feeling of gain because they pay a lower price than expected. If, instead, the actual markdown is smaller than consumers’ expectation, then they would experience a feeling of loss because they pay a higher price than expected. Furthermore, the feeling of a loss is often stronger than the feeling of an equal-size gain, based on the well-known phenomenon of loss aversion (e.g., Kahneman and Tversky 1979, Tversky and Kahneman 1992).
To examine whether such gain/loss emotions exist to affect the participants’ purchase decisions, we adopt a simple but well-established utility framework for our estimation (e.g., Zeelenberg et al. 2000, Kőszegi and Rabin 2006, Ho et al. 2010, Nasiry and Popescu 2011). In particular, we model returning and late con-sumers’ utility of purchasing the product at the markdown price (𝑝 − Δ) as 𝑈Buy =
𝜃𝑄 − (𝑝 − Δ) + Ψ(Δ − ˜Δ), where Ψ(Δ − ˜Δ) = 𝜆1(Δ − ˜Δ) if Δ − ˜Δ ≥ 0 and
Ψ(Δ − ˜Δ) = 𝜆2(Δ − ˜Δ) if Δ − ˜Δ < 0; 𝜃 is uniformly distributed on [𝑎, 𝑏]; and 𝑄 is the