HAL Id: halshs-00556696
https://halshs.archives-ouvertes.fr/halshs-00556696
Preprint submitted on 17 Jan 2011
HAL is a multi-disciplinary open access archive for the deposit and dissemination of sci-entific research documents, whether they are pub-lished or not. The documents may come from teaching and research institutions in France or abroad, or from public or private research centers.
L’archive ouverte pluridisciplinaire HAL, est destinée au dépôt et à la diffusion de documents scientifiques de niveau recherche, publiés ou non, émanant des établissements d’enseignement et de recherche français ou étrangers, des laboratoires publics ou privés.
Thresholds in Aid Effectiveness
Laurent Wagner
To cite this version:
CERDI, Etudes et Documents, E 2008.22
Document de travail de la série
Etudes et Documents
E 2008.22
THRESHOLDS IN AID EFFECTIVENESS
by Laurent Wagner
CERDI-CNRS, Université d’Auvergne
This version: September 2008 27 p.
Postal Address: CERDI-CNRS, Université d’Auvergne, 65 Boulevard François Mitterrand, 63000 Clermont-Ferrand, France
Email: [email protected]
Phone 1: + (33) 04 7317 75 07 Phone 2: + (33) 06 98 76 97 89 Fax: + (33) 04 73 17 74 28
CERDI, Etudes et Documents, E 2008.22
THRESHOLDS IN AID EFFECTIVENESS
Abstract: Is the big push hypothesis consistent with capacity constraints in the study of aid effectiveness? Big push hypothesis suggests the existence of a minimum threshold below
which aid is not effective, while the constraints referred to by the concept of absorptive
capacity suggests the existence of another threshold above which aid is no longer effective.
This paper addresses the issue of multiple thresholds characterizing the aid/growth
relationship. Using a semiparametric econometric method we do find that aid become
effective only above a critical level but also become detrimental to growth for higher value of
aid flows. We also investigate how the quality of economic policies and vulnerability
modifies the level of those two thresholds. We finally propose a dynamic explanation of the
aid/growth relationship.
JEL: F35, C14, O40
Keywords: Economic Growth, Aid Effectiveness, Threshold Models, Semiparametric Regressions.
1 - Introduction
Since the seminal work of Burnside and Dollar [2000], the question of the conditions on
which aid effectiveness depends has become central in the aid debates. Basically, these two
authors found that aid is effective only if the quality of the recipient country economic policy
is good enough. Consequently in order to maximize aid efficiency, donors have to condition
their disbursements on country policy and institutions ratings Collier and Dollar [2002]. This
recommendation is still today widely carried out within the World Bank as well as in some
national aid agencies, although serious doubts have been cast by many authors on the
robustness and relevance of its grounds (see Roodman [2007] and Easterly et al. [2004] for
recent formulations of the criticism). Besides country policies or institutions (or instead of
them), Guillaumont and Chauvet [2001], Chauvet and Guillaumont [2004,2007] and Collier
and Dehn [2001] put forth that macroeconomic vulnerability stemming from terms of trade or
climatic shocks were to be accounted for to disentangle the effect of aid on growth,
vulnerability being likely to increase the marginal impact of aid on growth.
Not independently from this first stream of thought, a second line of research argues that an
important part of the story is ignored by not taking into account that the aid/growth
relationship might display diminishing returns. Arguments in favor of such a hypothesis are
numerous. Thus, Hadjmichael et al. [1995] referred to absorptive capacity constraints,
Dubarry et al. [1998] discussed Dutch disease problems and capacity constraints and Lensik
and White [2001] consider inappropriate technology and institutional destruction caused by
the aid inflow as an explanation for what they called an “aid Laffer curve”. Heller and Gupta
[2002] review the empirical evidence that very large aid flows can induce overwhelmed
opportunities for corruption, among other impediments to growth. In those studies, as well as
in Dalgaard and Hansen [2000] and Hansen and Tarp [2000, 2001], by introducing an
“aid-squared” term in the regression, results displayed a strong, unconditional non-linear impact of
aid on growth. Collier and Dollar [2001, 2002], combining diminishing returns and
conditional effects of aid introduce the aid squared term besides the multiplicative "aid x
policy" variable, what was needed to solve the problem of an optimal aid allocation.
Gomanee et al. [2003] offer a different perspective: by implementing a threshold regression,
they find no evidence of diminishing returns but do find a non linear impact of aid. They
argue that aid stimulates growth positively and significantly only if the ODA to GNP ratio is
above 2%. The evidences they put forth come in support for the big push thesis, whereas most
of the literature focused on non-linearities in aid-growth relationships refers to capacity
constraints.
Examining how to reconcile big push and absorptive capacity, Guillaumont and Guillaumont
Jeanneney [2006a] suggest the existence of two successive turning points, a lower one
corresponding to the aid level required for the big push, the upper one corresponding to
absorptive capacity. But they consider that that these two points cannot be properly estimated
simply by introducing squared and cubic aid terms (how to interpret the negative marginal
returns below the lower threshold?) and that it would make difficult to treat simultaneously
the possibly conditional effects of aid.
In this paper we argue that the assumption of two turning points is consistent and that multiple
thresholds might characterize the aid/growth relationship as countries overcome or encounter
new constraints. Our objective here is to readdress the non-linearity issue by implementing an
econometric strategy allowing us to uncover the way growth respond to aid in a more
complex but yet more understandable manner than the studies mentioned above. The
component to enter additively. Whereas the traditional semi-parametric partially linear
regression formulation treats the variables that enter the non-linear part of the model as
nuisance variables, the semiparametric additive model allows for explicit estimation of the
marginal effects of the non-linear components on the dependant variable. Furthermore, such
estimation procedure offers graphical representations that provide a useful way of analyzing
the data.
In the next section we present the basic econometric framework that we use to analyze our
data. We then proceed to discuss our empirical findings. Finally, we conclude.
2 – Methodological issues
The core hypothesis of the literature that study nonlinear effects of aid on growth is that aid
displays diminishing returns and above a certain threshold become detrimental to growth for
particularly high aid to GNP ratio. Hence, some countries that receive aid flows above a
particular ceiling should see their aid reduced to avoid those detrimental effects, as argued in
Lensink and White [2001]. However, as shown in Gomanee and al. [2003], if there is a
threshold where the aid/growth relationship reverse, the simple inclusion of a squared term
might not be efficient to identify those turning points. Nevertheless, the threshold regression
suffers from its own caveats. As the estimation process is sequential, the initial threshold
values are never revised has the number of splits is rising. Hence, small change in the data
might have a significant impact on the stability of the model.
Our objective here is to propose an empirical strategy that might address these several issues
in a common framework. Nonparametric regression relaxes the usual assumption of linearity
and enables the researcher to explore the data more flexibly, uncovering structure in the data
Hastie and Tibshirani [1986, 1990] proposed additive models. These models estimate an
additive approximation to the multivariate regression function. The benefits of an additive
approximation are at least twofold. First, since each of the individual additive terms is
estimated using a univariate smoother, the “curse of dimensionality”, Bellman [1961], is
avoided, at the cost of not being able to approximate universally. Second, estimates of the
individual terms explain how the dependent variable changes with the corresponding
independent variables. Such methods usually combine features of parametric and
nonparametric techniques. As a consequence, they are usually referred to as semiparametric
methods. Further advantage of semiparametric method is the possible inclusion of categorical
as well as continuous variables, which can be included in a parametric way. Additive
semiparametric models are also interesting from a statistical point of view. They allow for a
componentwise analysis and combine flexible nonparametric modeling of multidimensional
inputs with a statistical precision that is typical of a one-dimensional explanatory variable.
A generalized linear model (GLM) is a regression model of the form
( | ) ( ' )
E Y X =G X β ,
Where Y is the dependent variable, here the rate of growth of GDP per capita, X is a vector of
explanatory variables, with the aid to GDP ratio our variable of interest and the main other
control variables used in the aid literature, β an unknown parameter vector and G(.) a known
link function. The generalized additive partial linear model (GAPLM) extends the GLM by a
nonparametric component and takes the form
( | , ) { ' ( )}
where ( |E Y X Aid, )denotes the expected value of the dependent variable Y given X and Aid,
the variable for which we want to explore non-linearities, here, the aid to GDP ratio. The
index X 'β+ f Aid( )is linked to the dependent variable Y via a known link function G(.).
The parameter vector β and the function f Aid( ) need to be estimated. The flexibility and
convenience of using a GLM formulation comes at the cost of two theoretical problems. It is
necessary to determine how to smooth this component and also to determine how smooth it
has to be. We then rely on regression splines for our previous to become linear. We have to
choose a basis, defining the space of functions on which f is an element. Choosing a basis
amounts to choosing some basis functions, which will be treated as completely known: if
( )
j
t Aid is the th
j such basis function, then f is assumed to have a representation
1 ( ) ( ) q j j j f Aid t Aid
θ
= =∑
,for some values of the unknown parameters,θj. Combining those two equations clearly yields
to a linear model. The second issue is about the level of smooth. If the objective is only to
minimize the sum of squared residual, such method will yields to an estimation of f not
smoothed enough to detected clear breaks. It is then necessary to set a penalty to the least
squared objective for our estimation to become the best trade off between smoothing and
fitting the data. Rather than fitting the model by minimizing,
2
' ( )
Y −X β− f Aid ,
it could be fitted by minimizing,
2
2 ''
' ( ) ( )
where the integrated square of second derivative penalizes models that are not smoothed
enough. The trade off between model fit and model smoothness is controlled by the
smoothing parameter, λ. λ→ ∞ leads to a straight line estimate for f , while λ = results in 0
an un-penalized regression spline estimate. In this study, this penalty parameter will be
estimated by generalized cross validation while other parameters are estimated using
iteratively reweighted least squares (P-IRLS).
This methodology will allow us to estimate the non-linear component of the aid/growth
relationship. The advantage of using this methodology is that we are not making any
assumptions regarding the nature of the marginal returns (by including a aid-squared or cubic
term) and the number of thresholds, providing us with a straightforward graphical
representation of the GDP growth response on the whole range of the aid to GDP ratio. It also
enables us to explore more efficiently some aspects of aid the conditional to other variables,
as it is also possible to specify a function of multiple variables.
3 – Data presentation
The empirical analysis is based on data for 61 countries from the Roodman [2007] database.
We use pooled cross-country data averaged over 8 four-years-periods from 1970 to 2001.
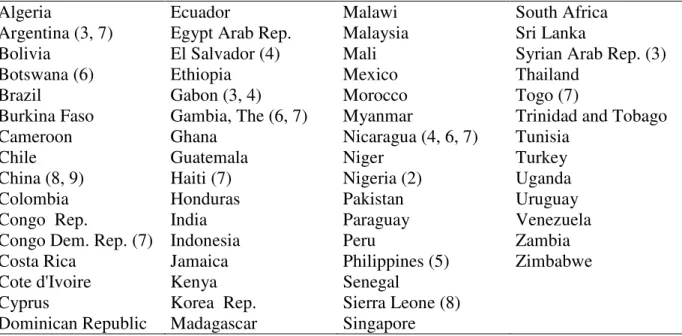
Table 1 presents the list of countries included in the sample. We estimated a classical
Barro-type growth equation with the 4 years average growth rate, GDPG as our regressand. In order
to make our result more comparable with the current literature, we first choose to stay as close
as possible to the Hansen and Tarp’s [2001] main specification, although we use an extended
sample. They include the initial level of GDP per capita, LGDP; an indicator of institutional
quality from the international country guide, ICRGE; the natural logarithm of 1+consumer
Warner [1995] openness dummy variable updated by Wacziarg and Welch [2002], SACW;
the state of the financial system proxied by M2 relative to GDP lagged of one period, M21;
the ethnolinguistic fractionalization used by Easterly and Levine [1997], ETHN; the
assassination variable to capture civil unrest, ASSAS; and the product of the last two,
ETHNASSAS. We also include a regional dummy for each of the 4 region in the sample:
Sub-saharan Africa, Central America, East Asia and Mediterranean countries, as well as a
period dummy for each of our 8 period. This set of exogenous variables is composing the
parametric part of our semiparametric specification.
As for our variable of interest, we use the Net Overseas Development Assistance to real GDP
ratio provided by the World Bank, AID; in the nonparametric part of our estimation. Our
sample mean value equals the one of Burnside and Dollar but it is still interesting to
investigate on the distribution of this variable. The most striking figure in this respect is that
75% of our observations correspond to aid to GDP level below 2%.
Even if the estimation strategy is substantially different from the rest of the literature, the
well-known endogeneity issue still troublesome. As shown by Sperlich [2005], it is possible
to obtain consistent estimates by using instrumental variables in a two step procedure that is
close the classical 2SLS estimator. This approach only requires a non, semi or even
parametric construction of regressors of interest in the first step. In order to stay as close as
possible of the current state of the art, we again chose to use the instruments proposed by
Burnside and Dollar [2000] and Hansen and Tarp [2001] [1]. This set of instruments includes
the lagged arms imports to total imports ratio, ARMS1; dummies for specific donors interests
in the Franc zone in Africa, FRZ; in Central America, CENTAM; and in Egypt; EGYPT;
lagged values for the aid, AIDL1 and policy, POL1 variables; an interaction term between
AIDL12 and policy, POL2 variables and interaction terms between policy and AIDL1,
POLAIDL1 and AIDL12, POLAIDL12. The AID variable we use from now is the fitted value
obtained, in a first step, by regressing parametrically our original Net ODA / GDP variable on
all the variables mentioned above.
The last estimation issue concerns outliers. The Burnside and Dollar specification excludes
five observations that are highly influential with respect to the coefficient on their aid*policy
variable. This raises the general question about the extent to which significant results in this
literature are driven by outliers. As a robustness test, we run at first a classical 2SLS
regression in which we flagged outliers using the Cook’s D statistics. Hence, we dropped
from our sample observations for which the Cook’D was higher than the conventional
threshold of 4/n, with n the original number of observations. Then we apply our main
estimation strategy to this cleared sample (22 outliers discarded out of 393 observations, see
Table 2 for details). As the results do not seem conditioned on outliers exclusion, we only
report results from the full sample.
4 – Estimation results
<Table 1 about here>
In the first column we test our alternative specification using generalized additive partially
linear model. We choose to rely on thin plate regression splines with shrinkage as basis for
our GAPLM formulation. Our sample being relatively small the nice properties of this basis
are not offset by the computational costs. Using a χ2- test comparing the deviance between
the full model and the model without the nonlinear part, it appears that the smooth term is
Bayesian’s confidence interval for the smooth term. Using our estimation strategy allow us to
obtain a significant a more complex nonlinear pattern than specification with only a squared
term on a large set of data.
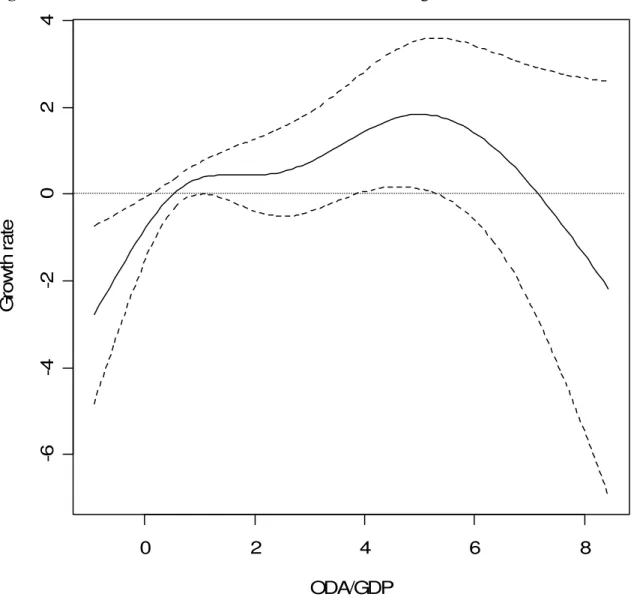
<Figure 1 about here>
The first implication of this figure is that it confirms the Laffer curve view of Lensink and
White [2001] as well as the minimum effort one of Gomanee et al. [2003]. Hence the aid to
growth relationship is slightly decreasing (nearly constant and close to zero) for low level of
aid flows. However, there is a turning point around 2% where the marginal returns increase.
This pattern matches Gomanee et al. [2003] findings. There is a minimum level of aid flows
for aid to efficiently stimulate economic growth. Our results seem to come in support of the
“Big Push” theory requiring a scaling up of aid to overcome some kind of “poverty trap” or,
at least, that only a large inflow of Aid might overcome structural rigidities or fixed costs
implied by the management of aid, as we can not investigate on the reasons of such findings
here. However, as aid flows reach around 5% of the country real GDP, marginal returns turn
out again to be decreasing and, even if the significance level of our nonlinear trend decrease
sharply, there are evidence that an increase of aid might become harmful to growth for a high
level of ODA to GDP ratio (around 6%) everything equal. This second point confirms the
former idea that aid beyond some level displays diminishing returns leading to an aid “Laffer
curve”: reflecting a limited absorptive capacity of recipient countries, due to capacity
constraints, “Dutch disease” reactions or any other factors (as analyzed in Guillaumont and
Guillaumont Jeanneney 2006a, 2006b). The overall conclusion we can drawn from this figure
is that even if the pattern of the curve supports our hypothesis of multiple thresholds, only a
small part of the aid distribution seems to be only effective with regard to growth as it is
located around the second thresholds according to the confidence interval. Nevertheless, we
“mixed bag” and that we have to expect the significance level to be quite low as every aspects
of aid do not have a direct impact on growth.
As previously mentioned, a substantial part of the aid-effectiveness literature argues that
donors should concentrate their effort on countries with “good policies”. In Figure 2, we try to
investigate how the aid-growth relationship changes with the quality of policies led by
recipient countries. We follow Burnside and Dollar [2000] to build up our policy variable [2].
Instead of estimating a linear coefficient for the policy variable and the smooth
function (f Aid), we now specify a smooth function of two arguments (f Aid Policy, ). The
convenience and flexibility of the GAPLM formulation is made quite clear in that case
compared to a more classical 2SLS estimation for which we would have to include arbitrarily
numerous multiplicative and squared terms. As the two variables are not on the same scale,
we do not expect that the same degree of smoothness is appropriate with respect to both
covariate axes. Hence, we choose to rely on tensor product smooth rather than on isotropic
smooth. The smooth of the function (f Aid Policy, )is then a tensor product of two thin plate
regression splines with shrinkage basis.
The fourth column of Table 2 and Figure 2 display estimation results. For the sake of
visibility, we choose not to report the confidence interval in the figure (available upon
request). Our results can be compared with those of the existing literature. As stated by
Burnside and Dollar [2000], aid seems more efficient in country implementing good policies.
Indeed, and consistently with the traditional view, it appears that good economic policy
makes aid less likely to harm growth at low level of aid and lead to a growth response to aid
which is at its maximum level far above the one when less efficient policies are considered.
countries running those kinds of policies need a higher level of aid to reach the area of
marginal positive returns (and experiment an effective big push).
Moreover they seem to be able to sustain efficiently higher level of aid relative to their real
GDP, suggesting a higher absorptive capacity. Then, on average, countries with weak
economic policies can still hope to experience growth enhancement for relatively high level of
aid. This can be interpreted as an effect of aid on institutions, as enlightened by Chauvet and
Guillaumont (2004) in a different framework, an effect denied by Burnside and Dollar. From
this second figure it does appears that thresholds seem to be state dependent on the quality of
economic policy. Countries implementing good policies reach the area of positive marginal
growth returns earlier than countries with less efficient policies (the first threshold even
disappears as policy quality rise), then they experiment decreasing marginal returns earlier (at
around 3% instead of around 6%): countries with bad economic policies could thus exhibit
positive returns of aid, for a high aid level, when countries with good policies do not.
It so appears that thresholds in aid effectiveness are also conditional on the recipient countries
specific features already highlighted by the literature. As we mentioned, in addition to the
policy focused studies by Burnside and Dollar [2000], interaction between aid effectiveness
and economic vulnerability has also received an important attention. Guillaumont and
Chauvet [2001] and Chauvet and Guillaumont [2004, 2007] state the economic vulnerability
of aid receiving countries is one of the main factors conditioning aid effectiveness. For
countries suffering from such vulnerability, foreign aid allows dealing more efficiently with
the effects of negative shocks. Aid is then supposed to smooth public expenditures, to
stabilize budget balance and to some extent to avoid economic and social collapses, which
may often result from shocks in low income countries. Accordingly, the marginal returns of
as evidenced from an analysis of the factors determining the rate of success of World Bank
projects (Guillaumont and Laajaj 2006).
<Figure 2 about here>
To build up a vulnerability variable, we use, as a proxy, the instability of total exports of
goods and services in 2000 US Dollars from the World Bank. We use an instability indicator
on 12 previous years with regard to a single rolling adjustment covering at least 12 years (as
calculated at CERDI) and take the averaged value to match the four years periods of our
panel. We include this variable in our specification, EXPVOL. As earlier, we now define our
smooth function as (f Aid Expvol, ). The results, using the same basis, are reported in the final
column of Table 2.
<Figure 3 about here>
It is rather difficult to draw conclusion from the analysis of the returns of aid when
vulnerability is relatively low, as the marginal returns do not exhibit clear thresholds.
Nevertheless, for countries that are less vulnerable it appears that aid impact is limited and
close to zero as it rises above 2% and that the marginal returns are becoming close from
constant. The understanding of non-linearities in the aid/growth relationship for vulnerable
countries is, on the opposite, clearly an important issue.
Countries that are vulnerable display some very interesting non-linearities in the aid/growth
relationship. We saw earlier that two distinct thresholds characterized this relationship and,
more particularly that, at low level of aid, countries experience negative marginal returns. It
then appears that it is not the case when economic vulnerability is high. Between zero and two
percent of aid to real GDP, the marginal returns are still slowly increasing and the growth
change and marginal returns rise, until around 4%, and become negative only as aid goes
above 6%. If absorptive capacity is still an issue here, the stabilizing effects of aid is visible at
low level of aid as there is no minimum effort from the donors to get positive return of aid.
Here again, it appears that the optimum level of aid and the implied thresholds are varying
with economic conditions. However, from those results it is difficult to draw any conclusions
about the dynamic behind this particular relationship. One intuitive way to deal with this issue
is to once again modify slightly our specification and to estimate f AID Lgdp( , ). Our
intuition is simple: As aid will strengthened the growth process, the GDP per capita level
should rise mechanically. Hence, as the thresholds seem to depend on economic condition we
should be able to see how their level and nature vary as recipient countries gets richer and
escapes poverty.
As can be seen on Figure 4, which presents the estimate of the smooth function
( , )
f AID Lgdp , there are two distinct thresholds when LGDP is low (the natural logarithm of
the real GDP per capita). The first one seems to support the big push theory. Indeed, to
witness positive marginal returns aid has to be higher than 2% of real GDP. The dynamic of
that threshold is also very interesting and comforts our hypothesis. As LGDP rises over 7.5,
which is also the sample median for LGDP, this first threshold disappears. If we combine
those findings with the fact that 75% of our observations display aid values below 2%, it
certainly helps to understand why it is difficult to draw clear conclusions on the way aid
supports or hinders the growth process or to find evidence backing up the “Big Push” theory
with the commonly used econometric techniques, as most of the observations are being
clustered in the bottom left quarter of the figure.
The dynamic of the second threshold also presents a very interesting pattern, close form the
to receive relatively more aid to reach that second threshold and experience the maximal
growth response to aid.
<Figure 4 about here>
Nevertheless, as aid goes over 6%, countries run into some limited capacity constraint that
appears to be harmful to growth. Furthermore, as their GDP rises, they seem to face that
constraint earlier, as aid almost reaches 4% of the real GDP.
The main conclusion we can draw from this particular figure, that also supports our previous
results, is that one must be very aware of the nature and level of the different thresholds in the
aid/growth relationship for the design of the optimal aid allocation.
5 – Conclusion
Concluding a paper, Hansen and Tarp [2001] stated that “We also note that empirical
conclusions about aid effectiveness that are based on cross-country growth regressions depend on poorly understood nonlinearities and critical methodological choices”.
Alternatively, Guillaumont and Guillaumont Jeanneney [2006a] highlighted that the inclusion
of an aid-squared term (and a cubic one) in the classical aid/growth equation was not
appropriate to uncover the nature of the non-linearities crucial for this particular relation. Our
attempt to address the nonlinear pattern of the aid growth relationship may overcome some of
the main drawbacks highlighted so far. The methodology presented here allows us to
investigate graphically on non-linearities without making any assumptions on the nature of
the nonlinear trend. Our findings lead to augment results from Burnside and Dollar [2000],
Lensink and White [2001] and Gomanee et al. [2003] altogether within a common empirical
thresholds. The first one confirms the view of researchers backing up the “big push” theory. It
appears that many countries do not experience positive marginal returns from aid because
they are just not receiving enough of it. As a matter a fact, for the period ranging from 1970 to
2001, the majority of countries seems to be trapped in a situation where the aid they receive
do more harm than good. If we take the ODA to real GDP value for our last period,
1998-2001, only 10 countries out of 60 received enough aid to witness, everything equal, a
significant and positive growth response. Nevertheless, as there exist a second threshold that
confirm the hypothesis of limited absorptive capacity, our results also suggest that for very
high level of aid the marginal returns after decreasing might become negative. However, this
statement must be considered with extra caution as we show that these thresholds are
conditioned by the implementations of "good" economic policy in recipient countries or by its
economic vulnerability. If our results confirm that aid is more useful in good policy
environment provided, it does not do so above a particular threshold. It is also worthwhile
mentioning that aid might display increasing returns despite less efficient politics. This
reinforces the view that the aid allocation rules relying mainly on policy rating should, as
argued by Hansen and Tarp [2001] and many authors, be considered with a lot of
circumspection. Furthermore, the level of country economic vulnerability appears to be
critical to understand how growth responds to aid flows. Our results support the view that aid
is more useful in countries where vulnerability is high. They also point out that those country
do not seem to suffer from possibly negative returns of aid when this one is at a low level, as
aid stabilizing effect help to deal with exogenous shocks. Finally, our results, by showing how
those thresholds are modified as countries are escaping poverty, clearly define the aid/growth
relationship as a complex dynamic process and help us to understand the difficulties that the
References
Bellman, R. (1961), Adaptive Control Processes: A Guided Tour, Princeton University Press. Boone, P. (1996). Politics and the effectiveness of foreign aid. European Economic Review, vol. 40 (2), pp. 289-329..
Burnside, C. and Dollar, D. (2000). Aid, Policies, and Growth, American Economic Review, vol. 90(4) (September), pp. 847–68.
Chauvet, L., and Guillaumont, P. (2004). Aid and Growth Revisited: Policy, Economic Vulnerability and Political Instability. In Toward Pro-Poor Policies – Aid, Institutions and
Globalization, ed B.Tungodden, N.Stern and I.Kolstad. Washington, DC: World Bank/Oxford University Press.
Clemens, M., Radelet, S. and Bhavnani, R. (2004). Counting Chickens When They Hatch: The Short-Term Effect of Aid on Growth, Working Paper 44, Center for Global Development, Washington, DC.
Collier, P. and Dehn, J. (2001). Aid, Shocks, and Growth, Working Paper 2688, The World Bank, Washington, D.C. (October).
Collier, P. and Dollar, D. (2002). Aid Allocation and Poverty Reduction, European Economic
Review, vol. 45(1) (September), pp. 1–26.
Dalgaard, C. and Hansen, H. (2001). On Aid, Growth and Good Policies, Journal of
Development Studies, vol. 37(6) (August), pp. 17–41.
Durbarry, R., Gemmell, N. and Greenaway, D. (1998). New Evidence on the Impact of Foreign Aid on Economic Growth, CREDIT Research Paper 98r8, University of Nottingham.
Easterly, W. and Levine, R. (1997). Africa’s Growth Tragedy: Policies and Ethnic Divisions,
Quarterly Journal of Economics, vol. 112(4) (November), pp. 1203–50.
Easterly, W., Levine, R. and Roodman, D. (2004). New Data, New Doubts: A Comment on Burnside and Dollar’s “Aid, Policies, and Growth” (2000), American Economic Review, vol. 94(2) (June).
Guillaumont, P. and Chauvet, L. (2001). Aid and Performance: A Reassessment, Journal of
Development Studies, vol. 37(6) (August), pp. 66–92.
Guillaumont, P., and S. Guillaumont-Jeanneney (2006a), Big Push versus Absorptive Capacity: How to Reconcile the Two Approaches? United Nations University WIDER Conference "Aid: Principles, Policies and Performance" Final plenary, Helsinki, June 2006 and CERDI, Etudes et documents, E 2006.14, October, 32p.
Guillaumont, P., and S. Guillaumont-Jeanneney (2006b), Efficacité, sélectivité et conditionnalité de l'aide, in Cohen D., Guillaumont Jeanneney S., Jacquet P., in La France
et l'aide publique au développement, Conseil d'Analyse Economique, La Documentation Française, 2006.
Guillaumont P. and R. Laajaj (2006) When Instability Increases the Effectiveness of Aid Projects, World Bank Policy Research Working Paper, n°4034, 2006, 29 p.
Hadjimichael, M. T., Ghura, D., Muhleisen, M., Nord, R. and Ucer, E. M. (1995). Sub-Saharan Africa: Growth, Savings, and Investment, 1986–93, Occasional Paper 118, International Monetary Fund, Washington, DC.
Hansen, H. and Tarp, F. (2000). Aid Effectiveness Disputed, Journal of International
Development, vol. 12(3) (April), pp. 375–98.
Hansen, H. and Tarp, F. (2001). Aid and Growth Regressions, Journal of Development
Eco-nomics, vol. 64(2) (April), pp. 547–70.
Hastie, T.J. and Tibshirani, R.J. (1986). Generalized Additive Models, Statistical Science, vol. 1, pp 297-318.
Hastie, T.J. and Tibshirani, R.J. (1990). Generalized Additive Models, New York: Chapman and Hall.
Lensink, R. and White, H. (2001). Are There Negative Returns to Aid?, Journal of
Develop-ment Studies, vol. 37(6) (August), pp. 42–65
Rajan, R.G. and Subramanian A., (2005b), Aid and Growth: What Does the Cross-Country Evidence Really Show?, IMF Working Paper WP/05/127.
Roodman, D. (2007). The Anarchy of Numbers : Aid, Development, and Cross-country Empirics, The World Bank Economic Review, vol. 21(2), pp. 255-277.
Sachs, J. D. and Warner, A. (1995). Economic Reform and the Process of Global Integration, in Brookings Papers on Economic Activity, pp. 1–118, Washington, DC: The Brookings Institution.
Sperlich, S. (2005). A Note on Nonparametric Estimation with Constructed Variables and Generated Regressors, Working Paper, Universidad Carlos III.
Tavares, J., (2003), Does Foreign Aid Corrupt?, Economics Letters, Elsevier, vol. 79, n°. 1, pp. 99-106.
Wacziarg, R. and Welch, K. H. (2002). Trade Liberalization and Growth: New Evidence, mimeo, Stanford University (November).
Notes
[1] This set of instruments has been extensively criticized (Rajan and Subramanian [2007] among others). Alternative instruments have been proposed. (see Tavares [2004], Guillaumont & Laajaj [2006])
Data sources (see Roodman [2007] for complete description)
Variable Code Data source Notes
Per-capita GDP growth GDPG World Bank, 2003
Initial GDP per capita LGDP Summers and Heston,
1991, updated using GDPG
Natural logarithm of GDP/capita for first year of period; 1985 constant dollars
Ethno-linguistic fractionalization, 1960
ETHN Roeder, 2001 Probability that two individuals will belong to different ethnic groups
Assassinations/capita ASSAS Banks, 2002 Assassinations/capita
Institutionnal quality ICRGE PRS Group’s IRIS III
data set (see Knack and Keefer, 1995)
Revised version of variable. Computed as the average of three components still reported after 1997
M2/GDP, lagged one period
M21 World Bank, 2003
Budget surplus BB World Bank, 2003;
IMF, 2003
World Bank primary data source.
Additional values extrapolated from IMF using series 80 and 99b (local currency budget surplus and GDP)
Inflation INFL World Bank, 2003;
IMF, 2003
Natural logarithm of 1+inflation rate.
Sachs-Warner updated SACW Sachs and Warner,
1995; Easterly et al., 2004; Wacziarg and Welch, 2002 Net Overseas Development Assistance/real GDP
AID DAC, 2002; World Bank, 2003
Population LPOP World Bank, 2003 Natural Logarithm
Arms imports/total imports lagged
ARMS1 U.S. Department of State, various years
Volatility of exportation of goods and services
EXPVOL World Bank, 2006 Cerdi, 2007
2000 constant dollars. on 12 previous years with regard to a single rolling adjustment covering at least 12 years
Table 1: Estimation results
Dependant variable: 4-years growth rate
(1) (2) (3) (4) LGDP -0.1023 (0.3428) -0.0103 (0.3492) 0.1995 (0.3692) - ICRGE 0.3874*** (0.1058) 0.3407*** (0.1079) 0.3944*** (0.1237) 0.3933*** (0.1025) INFL -3.2941*** (0.8489) - -3.0214*** (0.8779) -3.0525*** (0.8374) BB 9.0263** (3.8316) - 8.9590** (4.1391) 9.5387** (3.7353) SACW 0.8232* (0.4284) - 0.8957** (0.4520) 0.8538** (0.4115) M21 0.0054 (0.0121) 0.0160 (0.0118) 0.0076 (0.0134) 0.0080 (0.0117) ETHNF -0.5407 (0.7215) -0.6103 (0.7157) -0.3749 (0.7673) -0.6653 (0.7002) ASSAS -0.4479* (0.2279) -0.4834** (0.2277) -0.3352 (0.2352) -0.4375* (0.2229) ETHNASSAS 0.9672* (0.5097) 0.9376* (0.5131) 0.7367 (0.5228) 0.8820* (0.4946) ( ) f AID
Approximate significance of the smooth term.
Estimated degrees of freedom
0.0275
3.678
- - -
Aid effectiveness conditional to economic policy
( , )
f AID Policy
Approximate significance of the smooth term.
Estimated degrees of freedom
- 0.0000 14.91
- -
Aid effectiveness conditional to exports volatility
( , )
f AID Expvol
Approximate significance of the smooth term.
Estimated degrees of freedom
- - 0.0737 8.462
-
Aid effectiveness conditional to initial GDP
( , )
f AID Lgdp
Approximate significance of the smooth term.
Estimated degrees of freedom
- - - 0.0045
4.541 Number of observations 389 389 330 389 Adjusted R-squared 0.36 0.36 0.35 0.38 % of explained deviance 39.8 41.1 40.3 41.1
Regressand is per capita GDP growth. Each regression includes a constant term, as well as period and regional dummies, which are not reported. Column (1), (2), (3) and (4) are estimated using GAPLM formulation. AID corresponds to the first step fitted value of our original aid variable.
As stated before, the exclusions of outliers from our sample does not change much the results. In this particular case it even strengthens our conclusions as the significance level rise and the first threshold appears more clearly.
Table 2: Country list Algeria Argentina (3, 7) Bolivia Botswana (6) Brazil Burkina Faso Cameroon Chile China (8, 9) Colombia Congo Rep.
Congo Dem. Rep. (7) Costa Rica
Cote d'Ivoire Cyprus
Dominican Republic
Ecuador
Egypt Arab Rep. El Salvador (4) Ethiopia Gabon (3, 4) Gambia, The (6, 7) Ghana Guatemala Haiti (7) Honduras India Indonesia Jamaica Kenya Korea Rep. Madagascar Malawi Malaysia Mali Mexico Morocco Myanmar Nicaragua (4, 6, 7) Niger Nigeria (2) Pakistan Paraguay Peru Philippines (5) Senegal Sierra Leone (8) Singapore South Africa Sri Lanka
Syrian Arab Rep. (3) Thailand
Togo (7)
Trinidad and Tobago Tunisia Turkey Uganda Uruguay Venezuela Zambia Zimbabwe
Periods where countries are identified as outliers are in parenthesis. 3 stand for the 1974-1977, 4 for 1978-1981, 5 for 1982-1985, 6 for 1986-1989, 7 for 1990-1993, 8 for 1994-1997.
Figure 1: Estimation of the nonlinear effect of aid on GDP growth 0 2 4 6 8 -6 -4 -2 0 2 4 ODA/GDP G ro w th r a te
The graph shows the estimate of the function f AID( ) using GAPLM with thin plate regression splines (with shrinkage) as basis. The dashed curves represent the 5% Bayesian’s confidence interval. (Source: author calculations)
Figure 2: Aid marginal impact with respect to policy quality 0 2 4 6 -2 -1 0 1 2 3 4 -10 -5 0 5 10 ODA/GDP Policy Growth
The graph shows the estimate of the function f AID Policy( , ) using GAPLM, with tensor products of thin plate regression splines (with shrinkage) as basis, on the space of available data. The parametric variables of the estimated equation are evaluated at their sample mean. The Bayesian’s confidence interval is not reported for the sake of visibility. (Source: author calculations)
Figure 3: Aid marginal impact with respect to exports volatility 0 2 4 6 0 5 10 15 20 25 30 0 2 4 6 ODA/GDP Volatility Growth
The graph shows the estimate of the function f AID Expvol( , ) using GAPLM, with tensor products of thin plate regression splines (with shrinkage) as basis, on the space of available data. The parametric variables of the estimated equation are evaluated at their sample mean. The Bayesian’s confidence interval is not reported for the sake of visibility. (Source: author calculations)
Figure 4: Aid marginal impact with respect to the logarithm of initial GDP 0 2 4 6 6.5 7.0 7.5 8.0 8.5 -1 0 1 2 3 4 ODA/GDP GDP Growth
The graph shows the estimate of the function f AID Lgdp( , ) using GAPLM, with tensor products of thin plate regression splines (with shrinkage) as basis, on the space of available data. The parametric variables of the estimated equation are evaluated at their sample mean. The Bayesian’s confidence interval is not reported for the sake of visibility. (Source: author calculations)
Acknowledgments
We are most grateful to Patrick Guillaumont for constructive comments and numerous background discussions during the several stages of the above research. We also want to thank Jan Gunning, Paul Collier, Jean-Claude Berthelemy, Lisa Chauvet and Jean-Louis Arcand for their comments and helpful suggestions.