HAL Id: hal-02631480
https://hal.inrae.fr/hal-02631480
Submitted on 27 May 2020
HAL is a multi-disciplinary open access
archive for the deposit and dissemination of
sci-entific research documents, whether they are
pub-lished or not. The documents may come from
teaching and research institutions in France or
abroad, or from public or private research centers.
L’archive ouverte pluridisciplinaire HAL, est
destinée au dépôt et à la diffusion de documents
scientifiques de niveau recherche, publiés ou non,
émanant des établissements d’enseignement et de
recherche français ou étrangers, des laboratoires
publics ou privés.
Performance of a five category front-of-pack labelling
system - the 5-colour nutrition label - to differentiate
nutritional quality of breakfast cereals in France
Chantal Julia, Emmanuelle Kesse-Guyot, Pauline Ducrot, Sandrine Péneau,
Mathilde Touvier, Caroline Mejean, Serge Hercberg
To cite this version:
Chantal Julia, Emmanuelle Kesse-Guyot, Pauline Ducrot, Sandrine Péneau, Mathilde Touvier, et
al.. Performance of a five category front-of-pack labelling system - the 5-colour nutrition label - to
differentiate nutritional quality of breakfast cereals in France. BMC Public Health, BioMed Central,
2015, 15, pp.179. �10.1186/s12889-015-1522-y�. �hal-02631480�
R E S E A R C H A R T I C L E
Open Access
Performance of a five category front-of-pack
labelling system
– the 5-colour nutrition label – to
differentiate nutritional quality of breakfast
cereals in France
Chantal Julia
1,2*, Emmanuelle Kesse-Guyot
1, Pauline Ducrot
1, Sandrine Péneau
1, Mathilde Touvier
1,
Caroline Méjean
1and Serge Hercberg
1,2Abstract
Background: Breakfast cereals exhibit a wide variability in nutritional quality, and differences are not easily grasped by consumers. A simplified nutritional information system might contribute to help consumers make healthier food choices. A five-category colour label based on the Food Standards Agency Nutrient profiling system (FSA score) has been proposed in France to be implemented on the front-of-pack of foods (the five-colour nutrition label - 5-CNL). Objectives were to evaluate the ability of the 5-CNL to discriminate nutritional quality between types of breakfast cereals, within a category and in equivalent products, as well as its ability to change through product reformulation. Methods: Nutritional information was collected through an Internet and supermarket research for N = 433 breakfast cereals (N = 380 complete data included in the analyses). Breakfast cereals were categorized according to common attributes in terms of processing and/or ingredients used. The FSA score and 5-CNL category allocation were computed for each cereal. Nutrient content and FSA score were compared across types of cereals. Distribution within the 5-CNL categories was assessed across types of cereals and for equivalent products. Impact of reformulation (reduction of 5 and 10% in simple sugar, saturated fat and sodium) on the 5-CNL category allocation was compared to original allocation with Bapkhar’s tests of homogeneity of marginal distribution.
Results: Variability in nutritional quality of breakfast cereals was high, as reflected by the FSA score (range−7- 22 for a theoretical range of−15-40) and the 5-CNL (all five categories represented). The 5-CNL allowed for discrimination across types of cereals, within categories of breakfast cereals and for equivalent products (at least 3 categories of the 5-CNL represented). Reformulation scenarios allowed for significant change in 5-CNL allocation: 5% reduction in sugar lead to a modification of the label for 4.21% of products while a reduction of 10% of sugar, saturated fat and sodium lead to a modification of the label for 19.2% of products.
Conclusion: The 5-CNL adequately discriminates between breakfast cereals. It would therefore be an adequate tool for consumer information on nutritional quality of foods in the French context.
Keyword: Nutritional quality, Nutrient profiling systems, Reformulation, Nutritional labelling, Breakfast cereals
* Correspondence:c.julia@uren.smbh.univ-paris13.fr
1Université Paris 13, Equipe de Recherche en Epidémiologie Nutritionnelle
(EREN), Centre de Recherche en Epidémiologie et Statistiques, Inserm (U1153), Inra(U1125), Cnam, COMUE Sorbonne Paris Cité, 93017 Bobigny, France
2Hôpital Avicenne (AP-HP), Département de Santé Publique, 93017 Bobigny,
France
© 2015 Julia et al.; licensee BioMed Central. This is an Open Access article distributed under the terms of the Creative Commons Attribution License (http://creativecommons.org/licenses/by/4.0), which permits unrestricted use, distribution, and reproduction in any medium, provided the original work is properly credited. The Creative Commons Public Domain Dedication waiver (http://creativecommons.org/publicdomain/zero/1.0/) applies to the data made available in this article, unless otherwise stated.
Background
In France, 75.2% of children and 84.9% of adults system-atically have breakfast [1,2]. Moreover, 16.8% of adults and 60.4% of children are breakfast cereals consumers [1,2]. Breakfast cereals are therefore significant contribu-tors to daily energy and nutrient intake [3-7].
However, nutritional quality of breakfast cereals is variable [8-10]. They can be considered as highly proc-essed [11], and those marketed to children have regularly been found to have higher contents in sugar than those marketed for adults [12]. Given current knowledge as to content in sugar of breakfast cereals, parents are cau-tioned against excessive intake of sweet cereals for chil-dren [13]. However, currently no specific mean is given as how to distinguish ‘sweet’ cereals from healthier choices. Available information to do so currently includes adver-tisement or nutritional labelling on food packages [14].
Current legislation in the EU regulates nutritional la-belling, with mandatory information on content (per 100 g) in energy, carbohydrates, simple sugars, fat, satu-rated fat, proteins and sodium, and fibres as optional [15]. Nutritional values are given at the back of every package, but are regarded as difficult to understand, es-pecially for subjects with low educational level [16,17]. To help consumer information, a voluntary complemen-tary nutritional information label can be added at the front-of-pack [15]. Some manufacturers have already de-veloped their own, often giving information on content in several nutrients (energy, sugars, saturated fat an so-dium), based on the percentage of Guidelines for Daily Amounts (GDA). However, no single simplified format has been implemented in France [18]. The EU regulation leaves the possibility for each European country to de-velop its own nutritional information label, and to apply this single format to the entire food supply [15]. Nutri-ent profiling systems can be viewed as potNutri-ential support tools for such a simplified nutritional information label. They aim at positioning individual foodstuffs based on their nutritional characteristics [19-21], by giving a gen-eral assessment of the‘nutritional quality’ of a given food or beverage, taking into account current knowledge in nutrition and health relationships.
Multiple nutrient profiling systems have been devel-oped in the world [19,20,22], with varying degrees of val-idity [23-29]. They usually take into account content in energy, macronutrients and micronutrients of foods, bal-ancing between ‘unhealthy’ components (such as satu-rated fat or added sugar) and‘healthy’ components (such as vitamins and minerals). Computation leads to a single global score of the nutritional quality of the food. Subse-quently, the score can be used either as a continuous score, or as categorical. Cut-offs need then to be defined, which can lead to dichotomous ‘healthy’ and ‘less healthy’ foods, or to multiple categories. Among nutrient
profiling systems having been developed in Europe, some are currently in use for food labeling (namely the Green Keyhole [30] and Choices [31]) or for regulation of advertising to children (the Food Standards Agency (FSA) nutrient profiling system [23,32,33]). One the most scientifically validated nutrient profiling systems in the European context is the FSA nutrient profiling sys-tem [23,32,33].
Public health authorities in France are currently exam-ining the opportunity of introducing a comprehensive and simplified nutritional information label on foodstuff, based on the FSA score and including five different cat-egories of nutritional quality [34]. The adoption of a simplified nutrition label is the object of a law, which should be reviewed by the Parliament in the first semes-ter of 2015. This simplified nutritional information sys-tem would appear on the front-of-package of every foodstuff and would be colour-coded with five colours from ‘green’ (highest nutritional quality) to ‘red’ (lowest nutritional quality). The five categories would be pre-sented in the form of a chain of five discs of the different colours (Green/yellow/orange/pink/red), with a larger disc representing the nutritional quality of the product (see Additional file 1: Table S1). Corresponding letters from A to E would be added in each disc.
Recent research data tends to confirm the possible use of the FSA score in a five-category classification of foods [35], however, data on application of such a scheme to the actual food supply in France is inexistent.
Our objective was to investigate the ability of a five-category system for nutritional information to discrimin-ate nutritional quality of foodstuffs in the French context. Breakfast cereals were used as an exemplary case for this system. Performance was investigated according to the ob-jectives formulated for the nutritional information label: 1) Discrimination between categories of cereals and within a category of cereals; 2) Discrimination between apparently equivalent products and 3) Potential change in the label category according to reformulation scenarios.
Methods
Data collection
Nutritional information on breakfast cereals was col-lected by trained dieticians from Internet websites from April, 1st, 2014 to October 1st, 2014. Corporate brand sites, online supermarkets and consumers’ nutritional in-formation websites were visited. Data collection was com-pleted with an additional supermarket research from three different sites in Paris, representing three major food re-tailers (Simply (Auchan chain), Casino, Carrefour). Some common references from supermarkets and Internet web-sites were checked for consistency, and duplicates were re-moved. Supermarket data was used mainly to complete nutritional information from websites.
For each product, brand name, commercial product name and nutrition labelling information at the back of the package were recorded. Energy per 100 g was recal-culated from information on content in carbohydrate, fat and proteins.
Internet research obtained nutritional data for 402 ref-erences (327 with complete nutritional data for the com-putation of the FSA score and 75 with incomplete data). Additional supermarket data collection retrieved complete nutritional information for 22 existing Internet references and added 31 complete references. A total of 380 (87.8% of total sample) references with complete nutritional data were used in the analyses.
Classification of products
Breakfast cereals were classified according to the type of cereals, taking into account common attributes in terms of processing and/or ingredients used. Classification was made using product name and allegation, as follows: chocolate-flavoured cereals (e.g. chocolate flavoured wheat flakes, Nestle’s Chocapic®), honey/caramel cereals (e.g. honey puffed wheat cereals, Kellogg’s Honey Smacks®), light cereals (e.g. cereals marketed for dieting subjects and/or whole-grain cereals, Kellogg’s Special K®), muesli flakes (e.g. mixed granola including rolled ce-reals such as oats, cornflakes, wheat or rye flakes, Kel-logg’s Granola®), crunchy mueslis (e.g. mueslis with an additional bakery process, Jordan’s Country Crisps®), oat flakes (e.g. Quaker’s Oat Flakes®), cornflakes/other plain cereals (e.g. Kellogg’s Cornflakes®), fibre-rich flakes (e.g. cereals marketing their richness in fibres, All Bran®), whole wheat cereals (bite-size, e.g. Weetabix®) and filled cereals (bite-size cereals filled with chocolate, Kellogg’s Krave®). Classification used was similar to the one used by the French Observatory of Food Quality (OQALI), for comparison purposes [9]. Whenever possible, match-ing products from different brands were identified for each type of cereals, taking into account description of the product and final aspect (e.g. chocolate flavoured wheat flakes, similar to Kellogg’s Chocapic®). These products are hereafter termed ‘equivalent products’. Classification ac-cording to type of brand included three categories: na-tional brands, store brands and discount brands. Organic and regular products were also identified.
Nutrient profiling system and labelling category allocation For each product, the FSA score was computed taking into account nutrient content for 100 g. It allocates posi-tive points (0–10) for content in energy (KJ), total sugar (g), saturated fatty acids (g) and sodium (mg). Negative points (0–5) are allocated to content in fruits, vegetables and nuts, fibers and proteins. Final score is based on a discrete continuous scale from −15 (most healthy) to +40 (less healthy) (see Additional file 1: Table S1).
Products were then classified in five categories. The statistical quintiles of the FSA score observed in the nu-tritional composition database of the Nutrinet-santé study were used as cut-offs [35]. This published database reflects foods usually consumed in the French diet. These categories were used to define the nutritional in-formation labelling, as the following colours [35]:‘Green’ (−15 to −2), ‘Yellow’ (−1 to 3), ‘Orange’ (4 to 11), ‘Pink’ (12 to 16) and‘Red’ (17 and above). This categorization is hereafter termed Five-colour nutritional information label or‘5-CNL’ (see Additional file 1: Table S1). Products were also categorized taking into account the British OfCom cut-off for‘Healthy’ and ‘Less healthy’ foods (FSA score ≤4 for‘Healthy’ and >4 for ‘Less healthy’ foods) [36,37]. Statistical analysis
Median and interquartile range (IQR) of the nutrients accounted for in the score (energy, simple sugars, satu-rated fat, sodium, proteins and fibres), total fat and car-bohydrates and total FSA score were compared across types of cereals, using the non-parametric Kruskall-Wallis tests. The 5-CNL categorization was compared across types of cereals by a chi-square test. Discriminat-ing performance of the 5-CNL within types of cereals and for equivalent products (whenever more than 10 products were considered equivalent) was assessed. Number of categories represented within each type of cereals and for equivalent products was considered as indicators of discriminating performance of the 5-CNL. Discriminating performance was deemed high if at least three categories were represented.
Reformulation scenarios included reductions by 5 or 10% for sugar, saturated fat and sodium, respectively, both alone and in combination. Reformulation scenarios were chosen based on observed reformulation objectives made by manufacturers in the framework of the PNNS [38,39]. The impact of such reformulation on the 5-CNL was compared with original composition with Bapkhar’s tests of homogeneity of marginal distribution.
All tests were two-sided and a P value < 0.05 was con-sidered significant. Statistical analyses were performed using SAS® software (9.3 version, Cary, NC, USA).
Results
The most represented type was crunchy mueslis (N = 99, 26.1% of total), followed by chocolate-flavoured cereals (N = 89, 23.4% of total), light cereals (N = 60, 15.8% of total), filled cereals (N = 40, 10.5% of total) and honey/ caramel sweet cereals (N = 35, 9.2% of total) (Table 1).
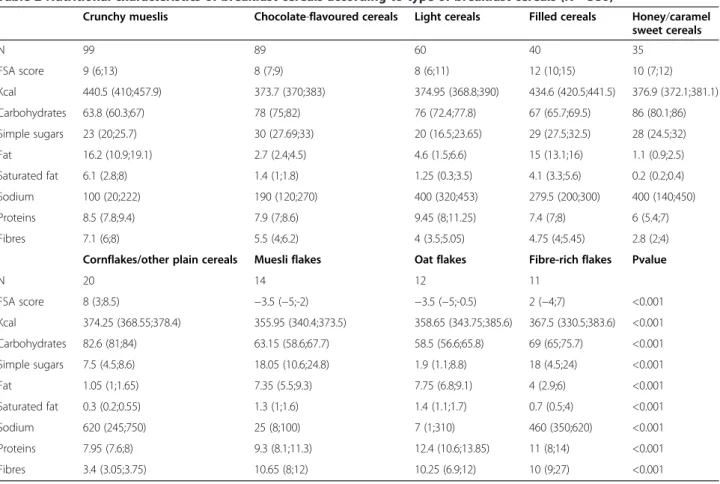
Nutritional content across types of cereals exhibited high variability for all nutrients, but more particularly for simple sugars (P < 0.001 across all categories), so-dium (P < 0.001 across all categories) and saturated fat (P < 0.001 across all categories) (Table 2).
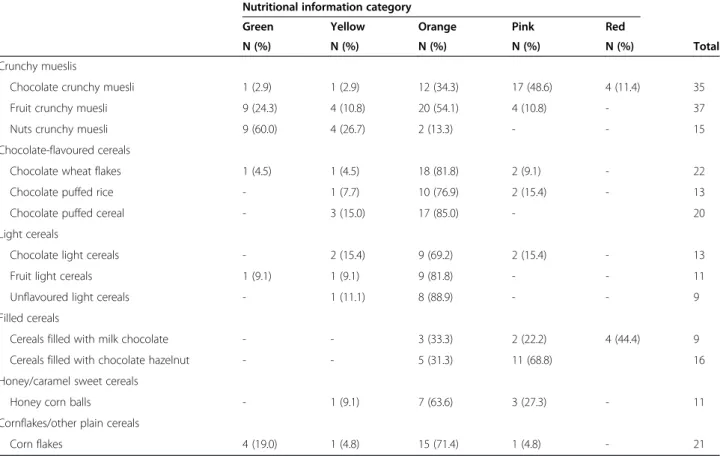
Overall, for breakfast cereals, FSA score ranged from−7 (most healthy, for a fruit muesli flake) to 22 (least healthy, for a chocolate filled cereal). FSA score was highest for filled cereals (median score 12 (IQR = 10;15) and lowest for muesli flakes (median score −3.5 (IQR = 5;-2), P < 0.001 across all categories) (Table 2). Types of breakfast cereals significantly differed in their 5-CNL allocation: the majority of muesli flakes and oat flakes were categorized as ‘Green’, while the majority of chocolate-flavoured ce-reals and light cece-reals were categorized as ‘Orange’ (Table 3). For crunchy mueslis and filled cereals, some products were even categorized as‘Red’ (Table 3). Vari-ability within types was the most important for crunchy mueslis, corn flakes/other plain cereals and was rela-tively low for chocolate-flavoured cereal and muesli flakes (Figure 1). All types of cereals were distributed in three or more categories of the 5-CNLshowing high dis-criminating performance of the system (Table 3 and Figure 1). Variability in 5-CNL was also important in equivalent products, as all products were distributed in at least three categories, and even five categories for chocolate crunchy mueslis (Table 4).
Reformulation scenarios lead to significant modifica-tions in the 5-CNL allocation (Table 5). Reduction in sugar lead to the most significant modifications (4.21% change in 5-CNL for 5% reduction in sugar alone, P =
0.002) (Table 5). Reduction by 10% for sugar, saturated fat and sodium combined lead to 19.2% of change in the 5-CNL categorization (Table 5).
Discussion
Our results show that through the example of breakfast cereals, a five-category nutritional information label (the 5-CNL) based on the FSA nutrient profiling system dis-plays high performance to discriminate nutritional qual-ity across types of breakfast cereals, within a category of breakfast cereals, within equivalent products. Moreover, reformulation would allow significant modifications in 5-CNL category allocation.
Our study used breakfast cereals as an exemplary case for the application of the 5-CNL in the actual French market. However, data suggests that nutritional variabil-ity in most groups of foods is very large, and that our re-sults would be reproducible in the French market at large [35].
One of the strengths of our study is the high number of data collected. Our database included 427 products, though all did not have complete information. As a comparison, the French OQALI database included 449 products in 2011, corresponding to 74.6% of the market in volume [40]. However, public OQALI data do not contain information on specific products, therefore not allowing for a direct comparison between apparently equivalent product, as we did. Although we did not col-lect data on market volume share, a high degree of over-lap between the two databases can be expected, and our data could therefore be considered as representative of the whole breakfast cereals market in France.
Our study is subject to some limitations. First, the ma-jority of data were collected through Internet search. While company websites gave reliable and complete in-formation for the majority of their products, inin-formation was less detailed for other types of brands. Moreover, while we have been able to check consistency for some common references in both Internet and supermarket search, we were not able to test reliability of web sources, or thoroughly compare web to supermarket sources, and some data might have been incorrect. However, data col-lection was performed by trained dieticians, who were able to identify implausible nutritional data. Second, we were not able to take into account market share of each prod-uct, which would have strengthened our analyses concern-ing the impact of reformulation. Third, we limited our analyses on breakfast cereals only as an exemplary case of the application of the FSA score to foods. A more general-ized investigation of food products currently on the French market would allow for the drawing of more defin-ite conclusions as to its potential as a front-of-pack nutri-tional labelling system. Finally, we used cut-offs obtained from an analysis using the French Nutrinet-Study food Table 1 Characteristics of the sample of breakfast cereals
in the French market, 2014 (N = 380)
N % Type of cereals Crunchy muesli 99 26.05 Chocolate-flavoured cereals 89 23.42 Light cereals 60 15.79 Filled cereals 40 10.53 Honey/caramel sweet cereals 35 9.21 Cornflakes/other plain cereals 20 5.26 Muesli flakes 14 3.68 Oat flakes 12 3.16 Fibre-rich flakes 11 2.89 Type of brands Store brands 179 47.11 Discount brands 27 7.11 National brands 174 45.79 Regular/Organic Organic 110 28.95 Regular 270 71.05 Ofcom category
Healthy (FSA score < =4) 80 21.05 Less healthy (FSA score > 4) 300 78.95
composition data, which reflects foods consumed in France, but not the French food market. Modification of the cut-offs might modify some results. However, as distribution in the continuous FSA score appeared homogenous, effect of the modification of the cut-off would be of limited impact.
Variability in nutritional composition of breakfast ce-reals observed in our sample, both across cereal type and within a type are in line with results from the OQALI [9]. As in our study, variability in nutritional composition was higher for crunchy mueslis compared with chocolate-flavoured cereals [9]. However, the study
Table 3 Distribution across categories of the 5-CNL nutritional information system according to type of breakfast cereals (N = 380)
Nutritional information category
Green Yellow Orange Pink Red
N (%) N (%) N (%) N (%) N (%) Pvalue Crunchy mueslis 11 (11.1) 9 (9.1) 46 (46.5) 27 (27.3) 6 (6.1) <0.001 Chocolate-flavoured cereals - 8 (9.0) 75 (84.3) 6 (6.7)
-Light cereals 3 (5.0) 7 (11.7) 43 (71.7) 7 (11.7) -Filled cereals - - 15 (37.5) 18 (45.0) 7 (17.5) Honey/caramel sweet cereals - 2 (5.7) 23 (65.7) 10 (28.6) -Cornflakes/other plain cereals 4 (20.0) 1 (5.0) 14 (70.0) 1 (5.0) -Muesli flakes 11 (78.6) 2 (14.3) 1 (7.1) - -Oat flakes 8 (66.7) 2 (16.7) 2 (16.7) - -Fibre-rich flakes 3 (27.3) 3 (27.3) 5 (45.5) -
-P value obtained from Chi square test.
Table 2 Nutritional characteristics of breakfast cereals according to type of breakfast cereals (N = 380)
Crunchy mueslis Chocolate-flavoured cereals Light cereals Filled cereals Honey/caramel sweet cereals N 99 89 60 40 35 FSA score 9 (6;13) 8 (7;9) 8 (6;11) 12 (10;15) 10 (7;12) Kcal 440.5 (410;457.9) 373.7 (370;383) 374.95 (368.8;390) 434.6 (420.5;441.5) 376.9 (372.1;381.1) Carbohydrates 63.8 (60.3;67) 78 (75;82) 76 (72.4;77.8) 67 (65.7;69.5) 86 (80.1;86) Simple sugars 23 (20;25.7) 30 (27.69;33) 20 (16.5;23.65) 29 (27.5;32.5) 28 (24.5;32) Fat 16.2 (10.9;19.1) 2.7 (2.4;4.5) 4.6 (1.5;6.6) 15 (13.1;16) 1.1 (0.9;2.5) Saturated fat 6.1 (2.8;8) 1.4 (1;1.8) 1.25 (0.3;3.5) 4.1 (3.3;5.6) 0.2 (0.2;0.4) Sodium 100 (20;222) 190 (120;270) 400 (320;453) 279.5 (200;300) 400 (140;450) Proteins 8.5 (7.8;9.4) 7.9 (7;8.6) 9.45 (8;11.25) 7.4 (7;8) 6 (5.4;7) Fibres 7.1 (6;8) 5.5 (4;6.2) 4 (3.5;5.05) 4.75 (4;5.45) 2.8 (2;4) Cornflakes/other plain cereals Muesli flakes Oat flakes Fibre-rich flakes Pvalue
N 20 14 12 11 FSA score 8 (3;8.5) −3.5 (−5;-2) −3.5 (−5;-0.5) 2 (−4;7) <0.001 Kcal 374.25 (368.55;378.4) 355.95 (340.4;373.5) 358.65 (343.75;385.6) 367.5 (330.5;383.6) <0.001 Carbohydrates 82.6 (81;84) 63.15 (58.6;67.7) 58.5 (56.6;65.8) 69 (65;75.7) <0.001 Simple sugars 7.5 (4.5;8.6) 18.05 (10.6;24.8) 1.9 (1.1;8.8) 18 (4.5;24) <0.001 Fat 1.05 (1;1.65) 7.35 (5.5;9.3) 7.75 (6.8;9.1) 4 (2.9;6) <0.001 Saturated fat 0.3 (0.2;0.55) 1.3 (1;1.6) 1.4 (1.1;1.7) 0.7 (0.5;4) <0.001 Sodium 620 (245;750) 25 (8;100) 7 (1;310) 460 (350;620) <0.001 Proteins 7.95 (7.6;8) 9.3 (8.1;11.3) 12.4 (10.6;13.85) 11 (8;14) <0.001 Fibres 3.4 (3.05;3.75) 10.65 (8;12) 10.25 (6.9;12) 10 (9;27) <0.001
Figure 1 Distribution of FSA scores across categories of breakfast cereals (N = 380). The boundary of the box nearest to the right indicates the 25th percentile, the line within the box marks the median, and the boundary of the box furthest from the right indicates the 75th percentile. Whiskers (error bars) above and below the box indicate the lower limit (25th percentile– 1.5 *(Inter-quartile range) and the upper limit (75th percentile + 1.5 *(Inter-quartile range)). The circles are individual outlier points.
Table 4 Distribution across categories of the 5-CNL nutritional information system for matching products
Nutritional information category
Green Yellow Orange Pink Red
N (%) N (%) N (%) N (%) N (%) Total Crunchy mueslis
Chocolate crunchy muesli 1 (2.9) 1 (2.9) 12 (34.3) 17 (48.6) 4 (11.4) 35 Fruit crunchy muesli 9 (24.3) 4 (10.8) 20 (54.1) 4 (10.8) - 37 Nuts crunchy muesli 9 (60.0) 4 (26.7) 2 (13.3) - - 15 Chocolate-flavoured cereals
Chocolate wheat flakes 1 (4.5) 1 (4.5) 18 (81.8) 2 (9.1) - 22 Chocolate puffed rice - 1 (7.7) 10 (76.9) 2 (15.4) - 13 Chocolate puffed cereal - 3 (15.0) 17 (85.0) - 20 Light cereals
Chocolate light cereals - 2 (15.4) 9 (69.2) 2 (15.4) - 13 Fruit light cereals 1 (9.1) 1 (9.1) 9 (81.8) - - 11 Unflavoured light cereals - 1 (11.1) 8 (88.9) - - 9 Filled cereals
Cereals filled with milk chocolate - - 3 (33.3) 2 (22.2) 4 (44.4) 9 Cereals filled with chocolate hazelnut - - 5 (31.3) 11 (68.8) 16 Honey/caramel sweet cereals
Honey corn balls - 1 (9.1) 7 (63.6) 3 (27.3) - 11 Cornflakes/other plain cereals
Corn flakes 4 (19.0) 1 (4.8) 15 (71.4) 1 (4.8) - 21
Breakfast cereals (N = 380).
Green Yellow Orange Pink Red Change Pvalue
N (%) N (%) N (%) N (%) N (%) N (%) Number of cereals in each category with change in labeling
Baseline 40 (10.5) 34 (8.9) 224 (58.9) 69 (18.2) 13 (3.4)
-−5% Sugar 42 (11.1) 39 (10.3) 223 (58.7) 64 (16.8) 12 (3.2) 16 (4.2) 0.002 Honey/caramel sweet cereals (N = 6), crunchy muesli (N = 3), chocolate-flavoured cereals (N = 2), filled cereals (N = 2), light cereals (N = 2), muesli flakes (N = 1)
−5% Sodium 40 (10.5) 36 (9.5) 223 (58.7) 68 (17.9) 13 (3.4) 3 (0.8) 0.22 Light cereals (N = 1), fibre-riche cereals (N = 1), corn flakes/other plain cereals (N = 1) −5% Saturated fat 41 (10.8) 34 (8.9) 226 (59.5) 67 (17.6) 12 (3.2) 6 (1.6) 0.19 crunchy muesli (N = 2), filled cereals (N = 2), light cereals (N = 2)
−5% Sugar and Sodium 42 (11.1) 41 (10.8) 221 (58.2) 64 (16.8) 12 (3.2) 18 (4.7) 0.0008 Honey/caramel sweet cereals (N = 6), crunchy muesli (N = 3), chocolate-flavoured cereals (N = 2), filled cereals (N = 2), light cereals (N = 2), muesli flakes (N = 1), fibre-riche cereals (N = 1), corn flakes/other plain cereals (N = 1)
−5% Saturated fat and Sodium
41 (10.8) 36 (9.5) 225 (59.2) 66 (17.4) 12 (3.2) 9 (2.4) 0.0559 filled cereals (N = 3), crunchy muesli (N = 2), light cereals (N = 2), fibre-riche cereals (N = 1), corn flakes/other plain cereals (N = 1)
−5% Saturated fat and Sugar
43 (11.3) 39 (10.3) 225 (59.2) 62 (16.3) 11 (2.9) 22 (5.8) <0.0001 Honey/caramel sweet cereals (N = 6), crunchy muesli (N = 5), filled cereals (N = 4), light cereals (N = 4), chocolate-flavoured cereals (N = 2), muesli flakes (N = 1) −5% Saturated fat,
Sodium and Sugar
43 (11.3) 41 (10.8) 223 (58.7) 62 (16.3) 11 (2.9) 24 (6.3) <0.0001 Honey/caramel sweet cereals (N = 6), crunchy muesli (N = 5), filled cereals (N = 4), light cereals (N = 4), chocolate-flavoured cereals (N = 2), muesli flakes (N = 1), fibre-riche cereals (N = 1), corn flakes/other plain cereals (N = 1)
−10% Sugar 43 (11.3) 48 (12.6) 219 (57.6) 61 (16.1) 9 (2.4) 36 (9.5) <0.0001 Honey/caramel sweet cereals (N = 9), crunchy muesli (N = 8), filled cereals (N = 7), chocolate-flavoured cereals (N = 6), light cereals (N = 4), muesli flakes (N = 1),, corn flakes/other plain cereals (N = 1)
−10% Sodium 40 (10.5) 46 (12.1) 224 (58.9) 59 (15.5) 11 (2.9) 26 (6.8) <0.0001 Light cereals (N = 1), fibre-riche cereals (N = 1), corn flakes/other plain cereals (N = 1)
−10% Saturated fat 41 (10.8) 37 (9.7) 225 (59.2) 68 (17.9) 9 (2.4) 14 (3.7) 0.0058 crunchy muesli (N = 5), filled cereals (N = 5), light cereals (N = 3), chocolate-flavoured cereals (N = 1) −10% Sugar and Sodium 43 (11.3) 65 (17.1) 213 (56.1) 50 (13.2) 9 (2.4) 64 (16.8) <0.0001 Light cereals (N = 14), chocolate-flavoured cereals (N = 13), crunchy muesli
(N = 12), filled cereals (N = 10), honey/caramel sweet cereals (N = 10),
fibre-riche cereals (N = 2), corn flakes/other plain cereals (N = 2), muesli flakes (N = 1) −10% Saturated
fat and Sodium
41 (10.8) 49 (12.9) 226 (59.5) 56 (14.7) 8 (2.1) 40 (10.5) <0.0001 filled cereals (N = 9), light cereals (N = 9), crunchy muesli (N = 8), chocolate-flavoured cereals (N = 5), honey/caramel sweet cereals (N = 5), fibre-riche cereals (N = 2), corn flakes/other plain cereals (N = 2)
−10% Saturated fat and Sugar
44 (11.6) 51 (13.4) 221 (58.2) 57 (15) 7 (1.8) 49 (12.9) <0.0001 crunchy muesli (N = 14), filled cereals (N = 10), honey/caramel sweet cereals (N = 9), chocolate-flavoured cereals (N = 8), light cereals (N = 6), corn flakes/other plain cereals (N = 1), muesli flakes (N = 1)
−10% Saturated fat, Sodium and Sugar
44 (11.6) 68 (17.9) 210 (55.3) 52 (13.7) 6 (1.6) 73 (19.2) <0.0001 Light cereals (N = 16), crunchy muesli (N = 16), chocolate-flavoured cereals (N = 15), filled cereals (N = 11), honey/caramel sweet cereals (N = 10), fibre-riche cereals (N = 2), corn flakes/other plain cereals (N = 2), muesli flakes (N = 1)
Breakfast cereals (N = 380). P value obtained with Bapkhar’s tests.
Public Health (2015) 15:179 Page 7 of 9
from Goglia et al. took into account nutrients one by one, and did not provide a comprehensive validated estimate of nutritional quality of breakfast cereals. Our results suggest that the variability of nutritional composition observed for each nutrient is adequately reflected in the FSA score.
The FSA score was initially designed to categorize foods in two categories: ‘Healthy’ (for foods with FSA scores <4) and‘Less healthy’ (for foods with FSA scores ≥4) [37,41]. Such classification has been validated in the British food environment [23] and in the New Zealand food environment [42]. Using this dichotomized tool, Devi et al. were able to identify differences in nutritional quality across types of cereals [8]. On the whole, 74% of breakfast cereals were considered as ‘Healthy’, the per-centage ranging from 42% for ‘cereals for kids’ to 100% for ‘oats’ [8]. As the ‘Healthy’ category corresponds to the ‘Green’ and ‘Yellow’ categories combined, such di-chotomization would allow for some discrimination across types of cereals in our sample, or even within a category, but would not be so efficient in discriminating the nutritional quality of equivalent products: for ex-ample, all chocolate filled cereals would be categorized as ‘less healthy’. Use of multiple categories ensures a higher discrimination performance of the 5-CNL. More-over, some have argued that the use of binary scores tends to induce the idea of ‘good’ and ‘bad’ foods, pro-moting dichotomous thinking [43].
Research on front-of-package nutrition labelling sug-gests that simple nutrition formats, giving a single global estimate of the nutritional quality of the food are more easily understood by consumers, more particularly among subjects with lower educational levels [44-46]. Moreover, they appear to be more appropriate for use in real purchase situations as they are fast to identify and understand by consumers [47]. The simple format of the 5-CNL would therefore be another argument of its performance.
Cereal reformulation, and more generally, improve-ment in food supply can be regarded as a public health initiative, as it can lead to significant improvement in nu-trient intake of the population [48]. The French public health nutrition program (Programme National Nutrition Santé, PNNS), aims also at improving quality of the food supply, by signed charters of improvements in nutritional quality with manufacturers. However, the monitoring of nutritional quality of breakfast cereals in France between 2008 and 2011 showed significant improvements in sugars only for filled cereal (−7%) and crunchy mueslis (−10%); in sodium only in light cereals (−28%); and no improvement of fat content [40].
Foodstuff labelling can entice manufacturers to refor-mulate their products [17]. Impact can be differential de-pending on the type of labelling information displayed [17]. Indeed, while introduction of the ‘Daily Intake
Guide’ on Australian breakfast cereals did not lead to any significant change in nutritional quality of breakfast cereals [10], the‘Pick the tick’ in new Zealand led to an average 61% reduction in salt content of breakfast ce-reals [49]. Format of the label could in part explain such contrasting results: the ‘Daily Intake Guideline’ label gave complex nutrient-by-nutrient information similar to the GDAs, while the ‘Pick the tick’ label was a single label indicating the product as‘healthy’. Our results sug-gest that the implementation of the 5-CNL in France could lead to substantial product reformulation, as even minor reformulations would lead to significant modifica-tions in 5-CNL categorization.
Conclusion
Our study supports a five-category nutritional informa-tion label to discriminate between breakfast cereals. The 5-CNL would therefore be a useful tool to rapidly and easily inform consumer information about nutritional quality of foods and to stimulate product reformulation by manufacturers in the French context.
Additional file
Additional file 1: Table S1. FSA score computation and CNL5 labeling attribution.
Abbreviations
FSA:Food Standards Agency; OfCom: Office of Communication; PNNS: Programme National Nutrition Santé; 5-CNL: Five-colour nutritional information label.
Competing interest
The authors declare they have no competing interests. Authors’ contributions
CJ wrote the statistical analysis plan, analysed the data, and drafted and revised the paper. EKG participated in statistical analysis plan, analysed the data and critically revised the paper for important intellectual content. CM SP PD MT analysed the data and critically revised the paper for important intellectual content. SH designed data collection tools, implemented the study, monitored data collection for the whole study, and critically revised the draft paper for important intellectual content. All authors have read and approved the final manuscript.
Acknowledgements
We thank Charlotte Voetglin and Cédric Agaesse who participated in data collection (dietitian), and Nathalie Arnault, Fabien Szabo (statisticians). Received: 25 November 2014 Accepted: 11 February 2015
References
1. AFSSA. Synthèse de l'Etude Individuelle Nationale des Consommations Alimentaires 2 (INCA 2) 2006–2007. 2009. Maison-Alfort, AFSSA. Direction de l'évaluation des risques nutritionnels et sanitaires .Ref Type: Report. 2. AFSSA. Etude individuelle nationale des comportements alimentaires
(INCA2) 2006–2007. 2009. Ref Type: Report.
3. Bertrais S, Luque MLP, Preziosi P, Fieux B, de Flot MT, Galan P, et al. Contribution of ready-to-eat cereals to nutrition intakes in French adults and relations with corpulence. Ann Nutr Metab. 2000;44:249–55. 4. Deshmukh-Taskar PR, Radcliffe JD, Liu Y, Nicklas TA. Do breakfast skipping
and breakfast type affect energy intake, nutrient intake, nutrient adequacy,
and diet quality in young adults? NHANES 1999–2002. J Am Coll Nutr. 2010;29:407–18.
5. Grieger JA, Cobiac L. Comparison of dietary intakes according to breakfast choice in Australian boys. Eur J Clin Nutr. 2012;66:667–72.
6. Preziosi P, Galan P, Deheeger M, Yacoub N, Drewnowski A, Hercberg S. Breakfast type, daily nutrient intakes and vitamin and mineral status of French children, adolescents and adults. J Am Coll Nutr. 1999;18:171–8. 7. Williams BM, O'Neil CE, Keast DR, Cho S, Nicklas TA. Are breakfast
consumption patterns associated with weight status and nutrient adequacy in African-American children? Public Health Nutr. 2009;12:489–96. 8. Devi A, Eyles H, Rayner M, Mhurchu CN, Swinburn B, Lonsdale-Cooper E,
et al. Nutritional quality, labelling and promotion of breakfast cereals on the New Zealand market. Appetite. 2014;81:253–60.
9. Goglia R, Spiteri M, Menard C, Dumas C, Combris P, Labarbe B, et al. Nutritional quality and labelling of ready-to-eat breakfast cereals: the contribution of the French observatory of food quality. Eur J Clin Nutr. 2010;64:S20–5.
10. Louie JCY, Dunford EK, Walker KZ, Gill TP. Nutritional quality of Australian breakfast cereals. Are they improving? Appetite. 2012;59:464–70. 11. Cordain L, Eaton SB, Sebastian A, Mann N, Lindeberg S, Watkins BA, et al.
Origins and evolution of the Western diet: health implications for the 21st century. Am J Clin Nutr. 2005;81:341–54.
12. Schwartz MB, Vartanian LR, Wharton CM, Brownell KD. Examining the nutritional quality of breakfast cereals marketed to children. J Am Diet Assoc. 2008;108:702–5.
13. Institut National de Prévention et d'Education pour la Santé: La santé vient en mangeant et en bougeant. Le guide nutrition des enfants et ados pour tous les parents. Paris: INPES; 2004.
14. LoDolce ME, Harris JL, Schwartz MB. Sugar as part of a balanced breakfast? what cereal advertisements teach children about healthy eating. J Health Commun. 2013;18:1293–309.
15. Europa Summary of EU legislation. Labeling of foodstuffs. Regulation (EU) No. 1169/2011. 2012. Brussels, European Union. 29-7-2014.
16. Cowburn G, Stockley L. Consumer understanding and use of nutrition labelling: a systematic review. Public Health Nutr. 2005;8:21–8. 17. Hawley KL, Roberto CA, Bragg MA, Liu PJ, Schwartz MB, Brownell KD. The
science on front-of-package food labels. Public Health Nutr. 2013;16:430–9. 18. Food and Drink Federation. GDAs explained. 2014. Food and Drink
Federation. 6-11-2014. Ref Type: Online Source
19. Azais-Braesco V, Goffi C, Labouze E. Nutrient profiling: comparison and critical analysis of existing systems. Public Health Nutr. 2006;9:613–22. 20. Garsetti M, de Vries J, Smith M, Amosse A, Rolf-Pedersen N. Nutrient profiling
schemes: Overview and comparative analysis. Eur J Nutr. 2007;46:15–28. 21. Tetens I, Oberdoerfer R, Madsen C, de Vries J. Nutritional characterisation of
foods: Science-based approach to nutrient profiling - Summary report of an ILSI Europe workshop held in April 2006. Eur J Nutr. 2007;46:4–14. 22. Townsend MS. Where is the science? What will it take to show that nutrient
profiling systems work? Am J Clin Nutr. 2010;91:1109S–15S. 23. Arambepola C, Scarborough P, Rayner M. Validating a nutrient profile
model. Public Health Nutr. 2008;11:371–8.
24. Chiuve SE, Sampson L, Willett WC. The association between a nutritional quality index and risk of chronic disease. Am J Prev Med. 2011;40:505–13. 25. Clerfeuille E, Vieux F, Lluch A, Darmon N, Rolf-Pedersen N. Assessing the
construct validity of five nutrient profiling systems using diet modeling with linear programming. Eur J Clin Nutr. 2013;67:1003–5.
26. Darmon N, Vieux F, Maillot M, Volatier JL, Martin A. Nutrient profiles discriminate between foods according to their contribution to nutritionally adequate diets: a validation study using linear programming and the SAIN, LIM system. Am J Clin Nutr. 2009;89:1227–36.
27. Katz DL, Njike VY, Rhee LQ, Reingold A, Ayoob KT. Performance characteristics of NuVal and the Overall Nutritional Quality Index (ONQI). Am J Clin Nutr. 2010;91:1102S–8S.
28. Maillot M, Drewnowski A, Vieux F, Darmon N. Quantifying the contribution of foods with unfavourable nutrient profiles to nutritionally adequate diets. Br J Nutr. 2011;105:1133–7.
29. Roodenburg AJC, van Ballegooijen AJ, Dotsch-Klerk M, van der Voet H, Seidell JC: Modelling of Usual Nutrient Intakes: Potential Impact of the Choices Programme on Nutrient Intakes in Young Dutch Adults.PLOS One 2013, 8.
30. Asp NG, Bryngelsson S. Health claims in the labelling and marketing of food products: the swedish food sector's code of practice in a european perspective. Food & Nutrition Research. 2007;51:3. 2007.
31. Choices International Foundation. Product Criteria v2.2. 2011. 18-6-2014. Ref Type: Online Source.
32. Rayner M, Scarborough P, Stockley L, Boxer A. Nutrient profiles: development of Final model. Final Report [online]. London: FSA; 2005. 16-1-2014. Ref Type: Online Source.
33. Rayner M, Scarborough P, Lobstein T. The UK Ofcom Nutrient Profiling Model - Defining 'healthy' and 'unhealthy' food and drinks for TV advertising to children. London: OfCom; 2009. 6-1-2014. Ref Type: Online Source. 34. Hercberg S. Propositions pour un nouvel élan de la politique nutritionnelle
française de santé publique dans le cadre de la stratégie nationale de santé. 1ère partie : mesures concernant la prévention nutritionnelle. 2013. Paris. 28-5-2014. Ref Type: Online Source.
35. Julia C, Kesse-Guyot E, Touvier M, Méjean C, Fezeu L, Hercberg S: Application of the British Foods Standards Agency nutrient profiling system in a French food composition database. Br J Nutr 2014, in press.
36. Arambepola C, Scarborough P, Rayner M. Validating a nutrient profile model. Public Health Nutr. 2008;11:371–8.
37. Rayner M, Scarborough P, Lobstein T. The UK Ofcom Nutrient Profiling Model - Defining 'healthy' and 'unhealthy' food and drinks for TV advertising to children. London: OfCom; 2009. 16-1-2014. Ref Type: Online Source. 38. Ministère de la Santé. Les signataires des chartes d'engagement de progrès
nutritionnel. 10-10-2014. Paris, Ministère de la Santé. 28-1-2015. Ref Type: Online Source
39. Ministère de la Santé. Les chartes d'engagements volontaires de progrès nutritionnel. 10-10-2014. Paris, Ministère de la Santé. 28-1-2015. Ref Type: Online Source.
40. OQALI. Etude d'évolution du secteur des céréales pour le petit déjeuner -OQALI - Données 2008 et 2011. 2013. Paris, INRA - ANSES. Ref Type: Report. 41. Rayner M, Scarborough P, Stockley L. Nutrient profiles: Applicability of
Currently Proposed Model for Uses in Relation to Promotion of Foods in Children Aged 5–10 and Adults. London: FSA; 2005.
42. Foods Standards Agency Australia New Zealand. Short guide for industry to the Nutrient Profiling Scoring Criterion (NPSC) in standard 1.2.7 Nutrition, Health and related claims. 2013. Canberra, FSA Australia New Zealand. 31-10-2014. Ref Type: Online Source.
43. Nitzke S, Freeland-Graves J. Position of the american dietetic association: total diet approach to communicating food and nutrition information. J Am Diet Assoc. 2007;107:1224–32.
44. Campos S, Doxey J, Hammond D. Nutrition labels on pre-packaged foods: a systematic review. Public Health Nutr. 2011;14:1496–506.
45. Mejean C, Macouillard P, Peneau S, Hercberg S, Castetbon K. Consumer acceptability and understanding of front-of-pack nutrition labels. J Hum Nutr Diet. 2013;26:494–503.
46. Mejean C, Macouillard P, Peneau S, Hercberg S, Castetbon K. Perception of front-of-pack labels according to social characteristics, nutritional knowledge and food purchasing habits. Public Health Nutr. 2013;16:392–402. 47. Feunekes GI, Gortemaker IA, Willems AA, Lion R, Van den Kommer M.
Front-of-pack nutrition labelling: Testing effectiveness of different nutrition labelling formats front-of-pack in four European countries. Appetite. 2008;50:57–70. 48. Combris P, Goglia R, Henini M, Soler LG, Spiteri M. Improvement of the
nutritional quality of foods as a public health tool. Public Health. 2011;125:717–24.
49. Young L, Swinburn B. Impact of the pick the tick food information programme on the salt content of food in New Zealand. Health Promot Int. 2002;17:13–9.