HAL Id: hal-00299058
https://hal.archives-ouvertes.fr/hal-00299058
Submitted on 1 Mar 2004
HAL is a multi-disciplinary open access
archive for the deposit and dissemination of
sci-entific research documents, whether they are
pub-lished or not. The documents may come from
teaching and research institutions in France or
abroad, or from public or private research centers.
L’archive ouverte pluridisciplinaire HAL, est
destinée au dépôt et à la diffusion de documents
scientifiques de niveau recherche, publiés ou non,
émanant des établissements d’enseignement et de
recherche français ou étrangers, des laboratoires
publics ou privés.
Retrospective analysis for detecting seismic precursors
in groundwater argon content
P. F. Biagi, R. Piccolo, A. Minafra, T. Maggipinto, L. Castellana, O.
Molchanov, A. Ermini, V. Capozzi, G. Perna, Y. M. Khatkevich, et al.
To cite this version:
P. F. Biagi, R. Piccolo, A. Minafra, T. Maggipinto, L. Castellana, et al.. Retrospective analysis
for detecting seismic precursors in groundwater argon content. Natural Hazards and Earth System
Science, Copernicus Publications on behalf of the European Geosciences Union, 2004, 4 (1), pp.9-15.
�hal-00299058�
© European Geosciences Union 2004
and Earth
System Sciences
Retrospective analysis for detecting seismic precursors in
groundwater argon content
P. F. Biagi1, R. Piccolo1, A. Minafra1, T. Maggipinto1, L. Castellana1, O. Molchanov2, A. Ermini3, V. Capozzi4, G. Perna4, Y. M. Khatkevich5, and E. I. Gordeev5
1Department of Physics-INFM, University of Bari, Via Amendola 173, 70126 Bari, Italy
2United Institute of the Earth’s Physics, Russian Academy of Science, Bolshaya Gruzinskaya 10, 123995 Moscow, Russia 3Department of Physics and Energy Science and Technology, University of Rome Tor Vergata, Via di Tor Vergata, 00133
Rome, Italy
4Department of Biomedical Sciences-INFM, University of Foggia, Via L. Pinto, 71100 Foggia, Italy
5Experimental and Methodical Seismological Department, Geophysical Service, Russian Academy of Science, Pijp Av. 9,
683006 Petropavlovsk-Kamchatsky, Russia
Received: 19 May 2003 – Revised: 17 October 2003 – Accepted: 20 October 2003 – Published: 1 March 2004
Abstract. We examined the groundwater Argon content data
sampled from 1988 to 2001 at two wells in Kamchatka (Rus-sia) and anomalous increases appeared clearly during June– July 1996. On 21 June, a shallow (1 km) earthquake with M=7.1 occurred at a distance less than 250 km from the wells and so the previous increases could be related to this earthquake and, in particular, could be considered premon-itory anomalies. In order to support this raw interpreta-tion, we analysed the data collected in details. At first we smoothed out the high frequency fluctuations arising from the errors in a single measurement. Next we considered the known external effects on the water of a well that are the slow tectonic re-adjustment processes, the meteorology and the gravity tides and we separated these effects applying band-pass filters to the Argon content raw trends. Then we identified the largest fluctuations in these trends applying the 3 σ criterion and we found three anomalies in a case and two anomalies in other case. Comparing the time occurrence of the anomalies at the two wells we found out that a coinci-dence exists only in the case of the premonitory anomalies we are studying. The simultaneous appearance of well def-inite anomalies in the residual trends of the same parameter at two different sites supports their meaning and the possi-bility that they are related to some large scale effect, as the occurrence of a strong earthquake. But, other earthquakes similar to the June 1996 event took place during the Ar-gon content measurements time and no anomaly appeared in this content. In the past, some of the authors of this pa-per studied the Helium content data collected in three natural springs of the Caucasus during seven years. A very similar result, that is the simultaneous appearance of clear premoni-tory anomalies only on the occasion of a strong (M=7.0) but
Correspondence to: P. F. Biagi
shallow (2–4 km) earthquake, was obtained. The correspon-dence with the case of the Caucasus validates the interpreta-tion of the Kamchatkian anomalies as precursors.
1 Introduction
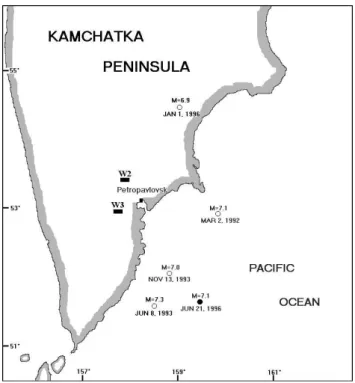
The Kamchatka peninsula, located in the far East of Rus-sia, is characterised by frequent and strong seismic activity (magnitudes up to 8.6). The majority of earthquakes occur in a zone located offshore 60–100 km southeast of the Pa-cific coast of the peninsula (Fig. 1) with focal depths up to 650 km (Gorbatov et al., 1997). For many years, samples for hydrogeochemical analyses have been collected, with a mean sampling frequency of three days, in the form of the most common ions and gases in the groundwater of some deep wells and springs located in the southern area of the Kamchatka peninsula, where the capital city Petropavlovsk is located. The presence of possible precursors in the ground-water ions content on the occasion of the strongest earth-quakes occurred in the area has been reported in Biagi et al. (2000). On 21 June 1996 a shallow (1 km) earthquake with M=7.1 occurred at a distance of about 200 km from Petropavlovsk (Fig. 1). After its occurrence clouding of sur-face waters and local trilling of the sea were observed and afterwards strong seismic crises (4.0≤M≤6.0) happened for more than two months, defining a wide and surface rupture zone. On this occasion, a very clear increase of Argon gas content in the groundwater of two wells (W2and W3) located
in Petropavlovsk area was observed. The content of the Ar-gon dissolved in the water, after thermovacuum degassing, is measured with a 5% accuracy by means of gas chromatogra-phy. The location of the wells is shown in Fig. 1. Details of drilling date, depth and cross-section of the wells are given in Table 1. The possibility that the Argon increase at W2could
10 P. F. Biagi et al.: Retrospective analysis for detecting seismic precursors in groundwater argon content
Table 1. Drilling time, depth and cross-section of the two wells indicated in Fig. 1.
Well Drilling Depth (m) Cross-section
W2 1983 600 0–36 m rubbly-pebbled deposits
36–600 m tuff
W3 1971 1208 0–70 m gravelly-pebbled deposits 70–1208 m succession of andesites, rhyolites and tuffs
Fig. 1. Map showing the southern part of Kamchatka peninsula and
the location of the wells (W2and W3) where the Argon data are col-lected. The dark circle indicates the epicentre of the 21 June 1996 earthquake. The white circles represent the other strong earthquakes which occurred in the zone during the Argon content measurement time. Occurrence dates and earthquakes magnitude are also re-ported.
be a precursor of the previous earthquake was preliminary presented by Biagi el al. (1999). Here we present the result of a retrospective analysis of the Argon content data collected from 1988 to 2001 at the two previous wells in order to spec-ify the presence of a premonitory behaviour.
2 Analysis
At first, let us consider the data collected at W3. First,
tack-ing into account that the data are collected with a mean sam-pling frequency of three days, we derived a data set with one value per day by a linear interpolation of the raw data. This procedure does not change in any way the experimental trend; it allows only to obtain an equal spaced in time data
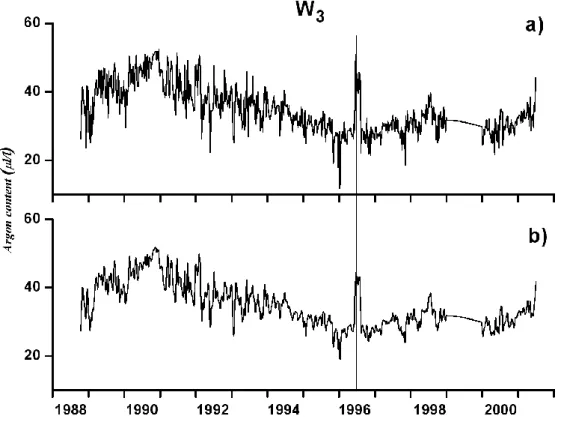
set. Figure 2a shows the trend of the Argon content at W3
we obtained from 15 October 1988 to 30 June 2001. Sec-ondly, in order to reduce the effect of the variations due to a single measurement and the effect of the rapid variations, we applied a low-pass FFT filter to the data with a smooth-ing window of ten days. This smoothed trend is shown in Fig. 2b. This last procedure reduces only the noise existing in the unfiltered trend (Fig. 2a), but it does not change the main side of this trend. In both the Figs. 2 the Argon content increase mentioned in the previous session appears clearly. Then we considered the known external effects on the wa-ter of wells, i.e. the slow tectonic re-adjustment processes, the meteorology and the gravity tides (Barsukov et al., 1979; Barsukov et al., 1984, 1985; King et al., 1981; King, 1986; Thomas, 1988; Wakita et al., 1988) and we separated these effects in the Argon content smoothed trend. The meteoro-logical components are mainly related to the surface-water flow and to the atmospheric contribution. For the long pro-cesses we applied a 36 months low-pass filter. For the me-teorology we applied two band-pass filters: 10–14 months (annual) and 110–130 days (seasonal). For the gravity tides we applied three band-pass filters: 170–200 days (solar semi-annual=182.7 days), 26–30 days (lunar monthly=27.55 days) and 13–15 days (lunar semi-monthly=13.66 days). These fil-tered trends are shown in Fig. 3. Adding these filfil-tered trends we obtained the long-meteo-tidal time-series of the Argon content (Fig. 4b) that can be assumed as the background trend. In Fig. 4a the smoothed time-series of Argon content (the same of Fig. 2b) is shown. Then we obtained the resid-ual trend subtracting this background trend from the starting smoothed trend of the Argon content. This residual trend is shown in Fig. 4c.
At this point, we carried out the normal distribution fitting on the data of the residual trend in order to test the signifi-cance level of this distribution. The fittings were made using the Shapiro-Wilk normality test and no significance level of a normal distribution fitting appeared. This result indicates that the residual trend we obtained is not a totally random sample. So, other external effects on the water of the well exist but they cannot be separated using pass filters or other analysis methods. The only further possibility of analysis is to identify the largest fluctuations and, at this purpose, at first we calculated the standard deviation σ over the sample of the residual Argon content data and then we applied the 3 σ cri-terion. The ±3 σ level is indicated in Fig. 4c by horizontal
Fig. 2. (a) Time-series (one value per day) of Argon content at W3from 15 October 1988 to 30 June 2001. (b) Time-series of the previous data smoothed with a smoothing window of ten days. The vertical line indicates the occurrence of the 21 June 1996 earthquake.
12 P. F. Biagi et al.: Retrospective analysis for detecting seismic precursors in groundwater argon content
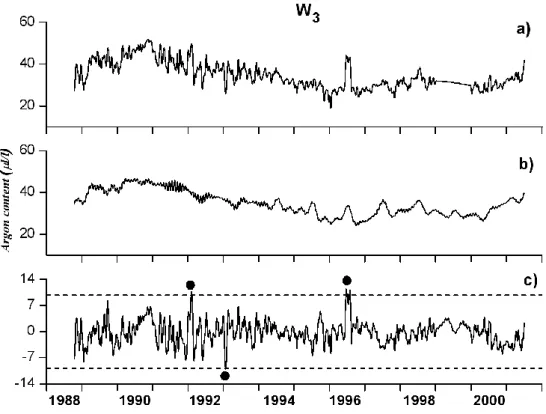
Fig. 4. Argon content at W3: (a) smoothed time-series (Fig. 2b); (b) long-meteo-tidal time-series; (c) residual time series (plot a – plot b). In the plot c the horizontal dashed lines represent the ±3 σ level and the black circles indicate the out level zones.
Fig. 5. (a) Residual time-series of Argon content at W3(plot c in Fig. 4); (b) residual time-series of Argon content at W2. The horizontal dashed lines represent the ±3 σ levels; the black circles indicate the out level zones. The vertical line indicates the occurrence of the 21 June 1996 earthquake; the vertical dashed lines indicate the occurrence of the other four earthquakes shown in Fig. 1.
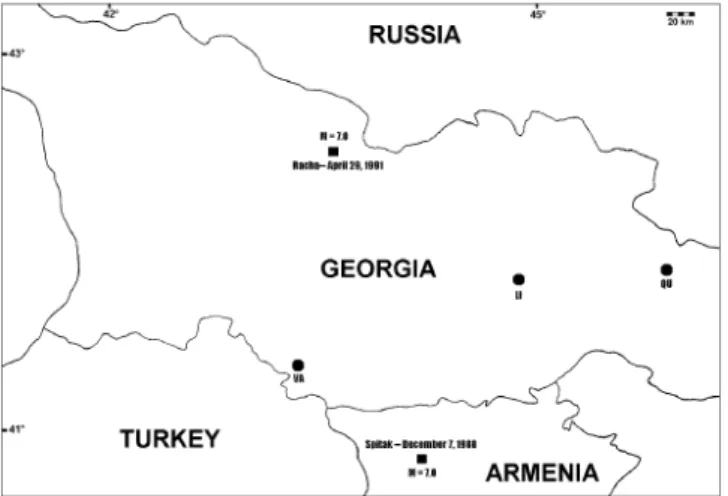
Fig. 6. Map showing the Caucasus and the location of the springs
(LI, QU and VA) where the Helium content data were collected. The epicentres of the Spitak and the Racha earthquake, with the indication of magnitude and occurrence dates, are also shown.
dashed lines. From Fig. 4c three out levels, indicated by black circles, stand out; one of these in correspondence of the increase appearing clearly in the raw and smoothed data (Fig. 2).
Then, we look the Argon content data collected at W2
us-ing the same analysis method and we obtained very similar results. The final result, that is the residual trend with the rel-ative ±3 σ level, is shown in Fig. 5b. From Fig. 5b two out levels appear. In Fig. 5a the residual time-series of Argon content at W3(plot c of Fig. 4) is shown. Finally, we
com-pared the time occurrence of the out levels at the two wells (Fig. 5) and we found out that a coincidence exists only in one case. This case matches with the increase in the Argon content during June–July 1996 pointed out previously for W3
(Fig. 2) and in Biagi et al. (1999) for W2.
3 Discussion
The residual trends of the Argon content at the two wells present some part over the ±3 σ level that should represent effective large anomalous variations. Such variations proba-bly are related to some particular meteorological situation, to some local settlement of the water-bearing stratum or to some local/large tectonic process. But, if we select as an anomaly only the case in which a time coincidence in the out lev-els data exists at the two different wells, the local processes should be debarred. In such a case the anomaly could be jus-tified only with some particular meteorological situation or some large tectonic process. This is the case of the out levels of the Argon content at W2and W3pointed out during June–
July 1996. The duration of these out levels ranges from 38 to 50 days with a difference of six days in the beginning. From now onwards we consider these two out levels as an unique anomaly. The analysis of the meteorological data collected in the Petropavlosk area did not reveal any particular situation
Table 2. Focal depth of the earthquakes indicated in Fig. 1.
Earthquake Focal depth (occurrence time) (km) 2 March 1992 32 8 June 1993 40 13 November 1993 50 1 January 1996 10 21 June 1996 1
during the appearance of this anomaly. So, it is reasonable to look for some large tectonic process. During May–July 1996 no particular volcanic activity happened in southern part of the Kamchatka peninsula. The only large tectonic process was the occurrence of the earthquake on 21 June 1996 with M=7.1 at a distance less than 250 km from the wells. The time occurrence of this earthquake is indicated in Fig. 5 by a vertical line. In this connection a 7–13 days premonitory phase in the Argon anomaly appears. So, a seismic precursor could be detected.
In order to validate this possibility, we checked the seismic activity occurred in the zone during the time of the measure-ments. We found out four more strong earthquakes (M>6.5) occurred at distances within 250 km from the wells. The lo-cation of the epicentres together with the indilo-cation of occur-rence dates and of magnitude is shown in Fig. 1. The focal depth of all the five earthquakes we considered is reported in Table 2. Dashed vertical lines indicate the time occur-rence of these earthquakes in Fig. 5 and no anomaly in the Argon content data corresponds to such cases. Then, we ex-amined the focal depth (Table 2) of all the five earthquakes and we discovered that only one was very shallow, that is the earthquake we connected previously with our anomaly. This coincidence could be significant, but it needs some confirma-tion. In the past, some of the authors of this paper analysed the Helium content data collected with a sampling frequency of one day in natural springs of the Caucasus during seven years (Areshidze et al., 1992a, b; Bella et al., 1995). In this time interval the destructive Spitak and Racha earthquakes took place at distances less than 200 km from three springs (LI, VA, QU), the location of them is shown in Fig. 6. The springs are located in thermal zones; their water temperature ranges from 30◦C (QU) to 56◦C (VA) and the water flows
from depths ranging from 1000 m to 2500 m. The epicentre, occurrence date and magnitude of the previous two earth-quakes are also indicated in Fig. 6. The three Helium content time-series with the indication of the time occurrences of the two earthquakes are reported in Fig. 7. In that analysis only a low-pass FFT filter (in order to reduce the occurrence of ca-sual errors in the measurements) was applied to the raw data before using the 3 σ criterion. In fact the external processes as the meteorology and the gravity tides on the water of nat-ural springs (Caucasus) are not so influent as on the water
14 P. F. Biagi et al.: Retrospective analysis for detecting seismic precursors in groundwater argon content
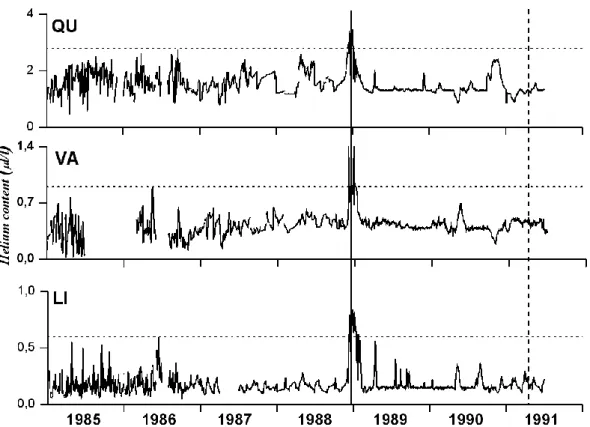
Fig. 7. Smoothed (smoothing window of five days) time-series of Helium content at three springs (LI, QU and VA) from 1 January 1985 to
30 June 1991. The horizontal lines represent the +3 σ level. The vertical line indicates the occurrence of the Spitak earthquake; the vertical dashed line indicates the occurrence of the Racha earthquake.
of wells (Kamchatka). From Fig. 7 clear simultaneous out levels (over the 3 σ level) stand out on the occasion of the Spitak earthquake while none out level appears on the occa-sion of the Racha event. The duration of the out levels ranges from 28 to 42 days and a premonitory phase of 2–6 days ex-ists (Bella et al., 1995). Looking at the focal depth of the two previous earthquakes we discovered that for the Spitak event it was 2–4 km, while for the Racha event a value greater than 10 km is considered (Seismological Notes, 1986–1991; Bella et al., 1995).
The coincidence with the phenomenology pointed out in the Caucasus validates the interpretation as a seismic precur-sor of the Kamchatkian anomaly we presented.
4 Conclusions
At first, this study pointed out that an evident groundwater gas content anomaly in the raw data collected at a single place can became more questionable if a strict data analy-sis for removing known external effects, is carried out. But, if the anomaly remains after the analysis and if a temporal coincidence appears with an anomaly in the same param-eter revealed at another site, the meaning of these anoma-lies is enlarged and the possibility that they are related to some shallow earthquake is supported. Then, this study con-firms that the probability of revealing premonitory anomalies
in groundwater gases content increases strongly if the forth-coming earthquake is shallow. This result seems reasonable: in fact, if gases emanations happen during the preparatory phase of an earthquake, the diffusion can occur easily in the surface underground strata, where the porosity is large, while a diffusion from the depth does not occur easily. In addition, in the first case, an all wards propagation should occur per-mitting the appearance of anomalies simultaneously at dif-ferent sites.
Acknowledgements. This research was partly conducted in the
framework of the NATO Collaborative Linkage Grant 978641. Edited by: M. E. Contadakis
Reviewed by: G. Martinelli and two other referees
References
Areshidze, G., Bella, F., Biagi, P. F., Caputo, M., Chkuaseli, V., Della Monica, G., Ermini, A., Manjgaladze, P., Melikadze, G., Sgrigna, V., Slavina, L., and Zilpimiani, D.: Anomalies in geo-physical and geochemical parameters revealed on the occasion of the Paravani (M = 5.6) and Spitak (M = 6.9) earthquakes (Caucasus), Tectonophysics, 202, 23–41, 1992a.
Areshidze, G., Bella, F., Biagi, P. F., Caputo, M., Della Monica, G., Ermini, A., Manjgaladze, P., Melikadze, G., Sgrigna, V., and Zilpimiani, D.: No preseismic evidence from
hydrogeochemi-cal parameters on the occasion of the 29 April 1991 Georgian earthquake, Caucasus, Tectonophysics, 213, 353–358, 1992b. Barsukov, V. L., Serebrennikov, V. S., Varsha, G. M., and
Garanin, A. V.: Geochemical methods for earthquake prediction, Geokhim., 3, 327–337, 1979.
Barsukov, V. L., Varshal, G. M., and Zamokina, N. S.: Recent re-sults of hydrogeochemical studies for earthquake prediction in USSR, Pure Appl. Geophys. 122, 143–156, 1984/85.
Bella, F., Biagi, P. F., Caputo, M., Cozzi, E., Della Monica, G., Ermini, A., Plastino, W., Sgrigna, V., and Zilpimiani, D.: Helium content in thermal waters in the Caucasus from 1985 to 1991 and correlations with the seismic activity, Tectonophysics, 246, 263– 278, 1995.
Biagi, P. F., Bella, F., Scandone, R., Cozzi, E., Ermini, A., Kings-ley, S. P., Anderson, C. W., Derlien, P. J., Khatkevich, Y. M., and Gordeev, E. I.: Groundwater argon content on the occasion of strong earthquakes in a seismogenetic area of Kamchatka (Rus-sia), Il Nuovo Cimento C, 22, 503–508, 1999.
Biagi, P. F., Ermini, A., Kingsley, S. P., Khatkevich, Y. M., and Gordeev, E. I.: Groundwater ion content precursors of strong earthquakes in Kamchatka (Russia), Pageoph, 157, 302–320, 2000.
Gorbatov, A., Kostoglodov, V., Suarez, G., and Gordeev, E.: Seis-micity and structure of the Kamchatka subduction zone, J. Geo-phys. Res., 102, 17 883–17 898, 1997.
King, C. Y., Evans, W. C., Presser, T., and Husk, R. H.: Anomalous chemical changes in well waters and possible relation to earth-quakes, Geophys. Res. Lett., 8, 425–428, 1981.
King, C. Y.: Gas geochemistry applied to earthquake prediction: An overview, J. Geophys. Res., 91, 12 269–12 281, 1986.
Seismological Notes of the Institute of Geophysics, Academy of Sciences of the Georgian SSR, Tbilisi, Georgia, 1986–1991. Thomas, D.: Geochemical precursors to seismic activity, Pure Appl.
Geophys., 126, 241–265, 1988.
Wakita, H., Nakamura, Y., and Sano, Y.: Short-term and intermediate-term geochemical precursors, Pure Appl. Geo-phys.,126, 267–278, 1988.