RESEARCH OUTPUTS / RÉSULTATS DE RECHERCHE
Author(s) - Auteur(s) :
Publication date - Date de publication :
Permanent link - Permalien :
Rights / License - Licence de droit d’auteur :
Bibliothèque Universitaire Moretus Plantin
Institutional Repository - Research Portal
Dépôt Institutionnel - Portail de la Recherche
researchportal.unamur.be
University of Namur
A requirements Based Model for Effort Estimation in Service-oriented Systems
Verlaine, Bertrand; Jureta, Ivan; Faulkner, Stéphane
Published in:Proceedings of the 9th International Workshop on Engineering Service-Oriented Applications
DOI:
10.1007/978-3-319-06859-6_8
Publication date:
2014
Document Version
Early version, also known as pre-print
Link to publication
Citation for pulished version (HARVARD):
Verlaine, B, Jureta, I & Faulkner, S 2014, A requirements Based Model for Effort Estimation in Service-oriented Systems. in Proceedings of the 9th International Workshop on Engineering Service-Oriented Applications:
Service-Oriented Computing – ICSOC 2013 Workshops. vol. LNCS 8377, Lecture Notes in Computer Science
(including subseries Lecture Notes in Artificial Intelligence and Lecture Notes in Bioinformatics), vol. 8377 LNCS, Springer Verlag, pp. 82-94, 2013 International Conference on Service-Oriented Computing,ICSOC 2013, Berlin, Germany, 2/12/13. https://doi.org/10.1007/978-3-319-06859-6_8
General rights
Copyright and moral rights for the publications made accessible in the public portal are retained by the authors and/or other copyright owners and it is a condition of accessing publications that users recognise and abide by the legal requirements associated with these rights. • Users may download and print one copy of any publication from the public portal for the purpose of private study or research. • You may not further distribute the material or use it for any profit-making activity or commercial gain
• You may freely distribute the URL identifying the publication in the public portal ?
Take down policy
If you believe that this document breaches copyright please contact us providing details, and we will remove access to the work immediately and investigate your claim.
Service-oriented Systems
Bertrand Verlaine, Ivan J. Jureta, and St´ephane Faulkner
PReCISE Research Center University of Namur, Belgium
{bertrand.verlaine, ivan.jureta, stephane.faulkner}@unamur.be
Abstract. Assessing the development costs of an application remains an arduous task for many project managers, and above all when they use new technologies or when they apply new methodologies. In this work, we propose a model for estimating the effort required to develop a service-oriented system. It is based on the system’s specifications. Its output is expressed in staff per period. It takes into account the three types of software complexity, i.e., the structural, the conceptual and the computational complexity.
1
Introduction
“How much will it cost to develop a given Information System (IS)?” remains one of the main issues for project managers. At the same time, more and more Service-oriented Systems (SoS) –i.e.,ISs based on the Service-oriented Computing (SoC) paradigm– are implemented. Its main component, the service, is a black box: only messages sent and received are known. Consequently, some software features are no longer programmed while the exchanges of messages must be organized. These differences are not integrated in most of the existing models used for estimating development costs. In response, we propose a model for estimating a priori the effort needed to develop aSoSpartially or totally built with services. To do so, we adapt and extend an existing model to best suit to the service-oriented paradigm.
This paper proceeds by first analyzing the related literature based on which we conclude that an adapted model forSoSis needed (§2). Then, the methodology followed is detailed (§3) and the model is developed accordingly (§4-5). In §6, an example case illustrates the use of the model. Conclusion and future work are presented in §7.
2
Related work
Existing methods used for estimating a priori the software development costs are either experts-based methods or model-based methods. Model-based methods use algorithms, heuristics computations and/or old projects data. Experts-based methods rely on human expertise and depend on experts’ intuition, knowledge and unconscious processes. Seeing that we focus on a new paradigm, a model-based approach seems to be an attractive solution:SoSare often complex, large and brittle.
Model-based estimation techniques are principally grounded on analogies, empirical studies and/or system-to-be analysis. To be effective, the first kind of techniques needs lots of data collected during previous projects. The objective is to find the similarities with the current project. This technique is close to experts-based methods but it is applied with much more formalism and, often, the use of probabilistic principles. Analogy-based techniques, e.g., [1, 2], face a recurring issue: they need highly skilled workers and they cannot be applied in young organizations because of a lack of historical data. That could be a problem inSoCseeing that it is a young paradigm which evolves quickly.
The second kind of techniques is based on empirical research, whereby situation-based models are proposed. In some sense, they generalize analogy techniques. One well-known initiative isCOCOMO[3]. The core idea is that the development costs grow exponentially when the system-to-be grows in size. The problem is that the development of aSoSoften combines several development strategies and processes: the underlying services can communicate without any restrictions on their own development technolo-gies. As a result,COCOMOmodels and similar techniques are often over calibrated as underlined by Tansey & Stroulia [4]. These authors attempted unsuccessfully to propose an empirical model based onCOCOMOto estimateSoSdevelopment costs. They were
constrained to conclude thatSoSdevelopment also involves developing and adapting declarative composition specifications, which leads to fundamentally different process. The third kind of techniques consists of an analysis of the system-to-be structure in order to measure its characteristics impacting the development costs. One well-known technique is the use of function points based on which the software size is estimated. It is a measurement unit which captures the amount of functionalities of a system-to-be [5, 6]. In this way, Santillo uses theCOSMICmeasurement method and, in fact, mainly focuses on the determination of the boundary of anSoS[7]. He also identifies one critical issue: from a functional point of view,SoCis different from traditional software architectures. New measurement methods are therefore essential for sizingSoS: we need new rules and new attributes appropriate to theSoCparadigm [7]. Nevertheless, his primary idea –using the function points– is relevant and deserves further research, which is what we
aim in this paper.
2.1 Software Development Costs Estimation in Service-oriented Computing In [8], the authors use the Work Breakdown Structure (WBS) for costing SoS. This is a decomposition technique that tries to make a granular list of planned tasks often represented as a tree. It helps to reduce the mean relative error and possible slippages in project deliverables. After theSoSdecomposition in atomic tasks, the authors propose an algorithm to estimate the development costs of the system-to-be.
A second related work tackles the defect prediction issue inSoS[9]. To do so, the authors useCOCOMOto estimate the size of the futureSoS. The paper does not solve the main issue explained above, i.e., many different strategies and processes can be used during aSoCdevelopment project, and one variable used in their model –the infrastructure factor– is not clearly defined. It seems they use aCOCOMOcoefficient estimated based on common software.
In [10], the authors propose an estimation framework forSoSby reducing the total software complexity. They propose to decompose theSoSinto smaller parts. Then, each
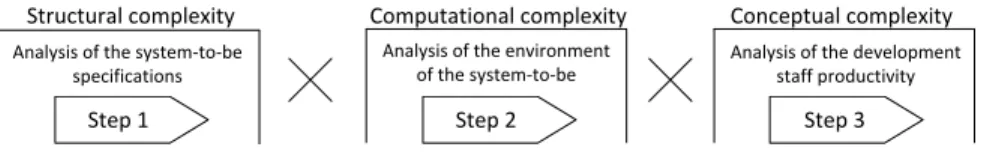
Structural complexity Computational complexity Conceptual complexity
Step 1 Step 2 Step 3
Analysis of the system-to-be specifications
Analysis of the environment of the system-to-be
Analysis of the development staff productivity
Fig. 1. Illustration of the proposed model structure and its components
of them is separately estimated. However, it is not clear how all the values resulting from the individual estimation are aggregated to provide a single figure.
3
Methodology
Instead of measuring theSoSdevelopment costs –which depend on many unrelated variables such as the wage level– we propose to measure the effort needed, i.e., the number of staff per period needed to carry out the development tasks. To do this, we first evaluate theSoScomplexity from which we can deduce the total effort needed. We take into account the three main sources of software complexity [11, Chap. 5]. The structural complexity refers to the software design and structure such as the quantity of data stored, the operations achieved, the user interfaces required and so on. As show in Fig. 1, the structural complexity is captured in our model through the analysis of theSoS
specifications. This step is the starting point. Specifying theSoScould be achieved thanks to a modelling language, e.g.,UML, or with a framework such asIEEE SRS1. In the scope of this work, that choice is not important as long as one is able to identify the significant factors –defined below– impacting the software complexity in the specifications. The computational complexity refers to the way that the computation is being performed. This kind of complexity is captured via an analysis of the system-to-be environment (the second step in Fig. 1). The conceptual complexity is related to the difficulty to understand the system-to-be objectives and its requirements. It refers to the cognitive processes and the capacity of the programmers. In our model, the effort estimation is adjusted to the development staff productivity (the third step in Fig. 1).
4
Software Complexity Estimation in Service-oriented Systems
The model proposed should first help to estimate the structural complexity of theSoS. To do so, we adapt and improve an existing model [12]. The latter allows to compute the software intrinsic complexity before its coding. It analyses stakeholders’ requirements expressed in natural language and categorizes them into three groups –critical, optional and normal requirements– according to eleven axioms. The “normal category” is assimi-lated as a default category when the classification algorithm does not succeed to select one of the two other categories. Then the complexity of the system-to-be is estimated. From our point of view, this method faces two problems. First of all, the requirements
1
The IEEE SRS framework was consulted the last time in February 2013 at http://standards.ieee.org/findstds/standard/829-2008.html.
Table 1. Characteristics of theSoSComplexity Model along with their acronyms
Acronym Definition
IC(Input Complexity) Complexity due to data inputs received by the system-to-be.
OC(Output Complexity) Complexity due to the data outputs that the system-to-be has to send to its environment.
DSC(Data Storage Complexity) Complexity due to persistent data that theSoShas to store (and possibly reuse later).
WS(Weight Source) Weight allocated to an input or output source type (see Table 2 for the weight details).
WT(Weight Type) Weight allocated to a specific type of input or output (see Table 2 for the weight details).
WST(Weight Storage Type) Weight allocated to a type of storage destination (see Table 2 for the weight details).
IOC(Input Output Complexity) Sum of theIC,OCandDSC.
FRC (Functional Requirements Complexity)
Complexity due to the implementation of functional stakeholder’s needs.
NFRC (Non-Functional Require-ments Complexity)
Complexity due to the implementation of non-functional stakeholder’s needs.
FI(Functions to Implement) Features that have to be entirely developed and coded in the system-to-be.
FS(Functions as a Service) Features that will not be coded because services will be used instead.
QA(Quality Attribute) Primary characteristics coming from the non-functional requirements which state how the functional requirements will be delivered.
QSA(Quality Sub-Attribute) Secondary characteristics refining eachQA.
RC(Requirements Complexity) Sum of theFRCandNFRC.
PC(Product Complexity) Complexity of theSoSto the tasks that it will perform; it sums theIOCandRC.
DCI(Design Constraints Imposed) Complexity due to constraints and rules to follow during the system-to-be development.
C(Constraint) Any environment characteristic of the development work or of the system-to-be that limits and/or control what the development team can do.
IFC(Interface Complexity) Complexity due to the interfaces to implement in the system-to-be.
I(Interface) Integration with anotherISor creation of a user interface.
SDLC(Software Deployment Lo-cation Complexity)
Complexity due to the type of users who will access to theSoSas well as their location.
UC(User Class weight) Weight associated with a user class.
L(Location) Number of the different access locations for a specific user class.
SFC(System Feature Complexity) Complexity due to specific features to be added to the system-to-be.
FE(Feature) Distinguishing characteristic of a software item aiming at enhancing its look or its feel.
Table 2. Sources and type weights for the input, output and data storage complexity
Parameter Description Weight Input/Output
Sources
External Input/Output through Devices 1 Input/Output from files, databases and other pieces of software 2 Input/Output from outside systems 3 Input/Output Types
Text, string, integer and float 1 Image, picture, graphic and animation 2
Audio and video 3
Data Storage Types Local data storage 1 Remote data storage 2
categorization is complex and imprecise (cf. the default category used when no decision is made). Secondly, the complexity estimation does not take into account some specific features of the SoCsuch as the use of external services to provide system features without requiring their implementation. In [12], once a requirement is specified, all of its underlying features increase the software complexity. Despite these two flaws, this model performs well during the tests and comparisons with similar initiatives [12–14]. This is why it is a sound basis on which a specific model for theSoCcould be built.
4.1 The SoS Complexity Model
In this section, we identify the characteristics ofSoSand how they increase structural complexity based on the model proposed in [12]. To ease the understanding of the paper, these characteristics along with their acronyms are defined in Table 1.
Input Output Complexity. The Input Output Complexity (IOC) gathers the complexity of the input (IC), output (OC) and data storage complexity (DSC) together. Table 2 lists
the different weights, picked up from [12], for the types and sources ofIC,OCandDSC
which are respectively stated in Equations 1, 2 and 3.
IC = 3 X i=1 3 X j=1 Iij× W Si× W Tj (1)
where Iij is the number of inputs of the source i and being of the type j identified in the system-to-be specifications; W Siand W Tjare respectively the weight of the input source i and the input weight of the type j as listed in Table 2.
OC = 3 X i=1 3 X j=1 Oij× W Si× W Tj (2)
where Oij is the number of outputs of the source i and being of the type j. W Siand W Tjhave a similar meaning than in Equation 1, but they concern the outputs.
The use of services to perform some functionalities involves data exchanges between the providers and the consumers of services. TheWSDLtechnology is commonly used for describing services capabilities and communication processes [15]. Two versions of theWSDLprotocol currently exit (WSDL1.1 and 2.0), but their relevant parts for our model are identical. <operation/ > tags define service functions. Each operation consists of one or several input and output tag(s), i.e., messages exchanges, which must be considered as an input/output source from outside systems. Most of the time, the type to apply is “text” seeing that messages exchanged areXMLdocuments.
Equation 3 states how to compute theDSC.
DSC = 2 X i=1
Si× W STi (3)
where Siis the number of data storage of type i and W STiis the weight of the type i. TheIOCis the addition of the complexity due to data exchanges and storage.
IOC = IC + OC + DSC (4) Requirement Complexity. The Functional Requirements Complexity (FRC) value cap-tures the complexity of a given functionality, i.e., a function which defines how several computational actions are performed on the inputs to generate the outputs.
As some functions can be fulfilled thanks to the use of (composite) services, they should not all be taken into account for the computation of theFRCcomplexity value.
Let F be the set which includes all theSoS’ functions. F contains two sub-sets: F I and F S for, respectively, the Functions to Implement set and the Functions as Services set which will not be fully developed because (composite) services will be used instead. They do not increase theRFCvalue as stated in Equation 5.
F RC = n X i=1 m X j=1 F Ii× SFij+ k X k=1 F Sk (5)
where F Ii is the ithfunction of F I and SFij is the jthsub-function obtained after the decomposition of the function F Ii. F Skis the kthfunction of F S outsourced as services. In this case, only the main function –i.e., the (composite) service being used– increases theFRCvalue. Although its computational complexity is hidden, developers have to implement the exchanges of messages between the service used and theSoS.
Non-functional requirements are criteria related to the way the functional require-ments will be performed; its complexity value can be computed as stated in Equation 6.
N F RC = 6 X i=1 n X i=1 QAi× QSAj (6)
where QAiis the main quality attribute i and QSAjis the quality sub-attributes j related to QAi. The quality attributes proposed are those of theISO/IEC-9126 standard2[16].
The Requirement Complexity (RC) is the addition of theFRCand theNFRC.
RC = F RC + N F RC (7)
Product Complexity. The Product Complexity (PC) captures theSoScomplexity based on its overall computations. It is obtained by multiplying theIOCand theRCvalues [12].
P C = IOC × RC (8)
Design Constraints Imposed. The Design Constraints Imposed (DCI) refers to the number of constraints to consider during the development of the system-to-be such as regulations, hardware to reuse, database structures, imposed development languages, etc.
DCI = n X i=1
Ci (9)
where Ciis the ithconstraint type imposed; its value is to number of constraints i. Interface Complexity. The Interface Complexity (IFC) is computed based on the number of external integrations and user interfaces needed in the future software.
IF C = n X i=1
Ii (10)
where Iiis the ithexternal interface to develop. Iihas a value ranging from one to x depending of the number of integrations to carry out: a user interface has a value of one while the value of an interface used to integrate multiple systems corresponds to the number ofISs to interconnect. Each service used counts for one interface.
Software Deployment Location Complexity. The Software Deployment Location Complexity (SDLC) is the software complexity due to the types of users accessing
2
The main quality attributes of theISO/IEC-9126 standard are Functionality, Reliability, Usability, Efficiency, Maintainabilityand Portability. See [16] for more information.
the system-to-be combined with the different locations from where they will access it. SDLC = 4 X i=1 U Ci× Li (11)
where U Ciis the user class weight and Liis the number of locations from which the user belonging to the user class i will access the software. User classes are [12]: casual end users occasionally accessing theSoS(weight of 1), naive or parametric users dealing with the database in preconfigured processes (weight of 2), sophisticated users using applications aligned with complex requirements and/or infrequent business processes (weight of 3), and standalone users working with specific software by using ready made program packages (weight of 4).
System Feature Complexity. The System Feature Complexity (SFC) refers to specific features to be added to enhance the look and the feel of the system-to-be.
SF C = n X i=1
F Ei (12)
where F Eiis the feature i with a weight of 1.
Computation of theSOS RBCvalue. The Service-Oriented System Requirements-based Complexity (SOS RBC) value can be computed as follows:
SOS RBC = (P C + DCI + IF C + SF C) × SDLC (13) Note Sharma & Kushwaha also include the “personal complexity attribute” (PCA) in their complexity measurement model [12, 17]. However, the structural complexity measure should only take into account the software structure and not the capabilities of the development staff. The latter should only impact the development effort needed.
4.2 Validation of the Complexity Model
Here is a theoretical validation of the model we proposed in §4.1 based on the validation framework for the software complexity measurement process of Kitchenham et al. [18]. Property 1: For an attribute to be measurable, it must allow different entities [i.e., different specifications of systems-to-be] to be distinguished from one other.
All attributes used in the Equations 1 to 13 are clearly defined and distinguishable from each other (see Table 1). They cover the specifications of aSoS. Therefore, theSOS RBC
model should give different values for differentSoSspecifications.
Property 2: A valid measure must obey the representation condition, i.e., it must preserve our intuitive notions about the attribute and the way in which it distinguishes entities. This property refers to the psychological complexity, also called conceptual complexity, –i.e., the complexity due to the efforts needed for a given human being to understand and to perform a specific software development task– which cannot interfere with the structural complexity . The latter is the kind of complexity that theSOS RBC model has to capture. All the attributes used are only related to countable and distinguishable intrinsic characteristics of the system-to-be without any relations with the development
staff capabilities. We conclude that this property is respected by theSOS RBCmodel. Property 3: Each unit of an attribute contributing to a valid measure is equivalent. Each identical attribute in the system-to-be will have the same weight and importance in the estimation regardless its position in the specifications.
These three properties are necessary to validate a complexity measurement process, but not sufficient [18]. Indirect measurements must also respect properties 4 and 5. Property 4: For indirect measurements processes, the measure computed must be based on a dimensionally consistent model, with consistent measurement units while avoiding any unexpected discontinuities.
Our model aims at measuring the complexity of software specifications. All the attributes evaluated to compute the model are intrinsic features of theSoSimpacting its complexity. Property 5: To validate a measurement instrument, we need to confirm that the mea-surement instrument accurately measures attribute values in a given unit.
This property asks for a definition of the measured attributes and their unit. In this paper, we propose a semi-formal definition of the measurement instrument –the best solution is to propose a formal one– based on both mathematical tools and literal definitions.
5
Development Effort Estimation in Services-oriented Systems
5.1 Estimation of the Total Intrinsic Size of the System-to-be
In order to estimate the total development effort needed, the model is adjusted with the Technical Complexity Factors (TCF) [5, 6]. TheTCFs are significant characteristics of the software development project which influence the amount of work needed. EachTCF
is associated to a Degree of Influence (DI) ranging from 0 (no influence) to 5 (strong influence). They must be estimated by the development team based on the requirements and on the system-to-be environment3.
Equation 14 expressesTCFvalue (TCFV) in a mathematical form [6].
T CF V = 0.65 + 0.01 × 16 X i=1
DIi (14)
where DIiis the degree of influence of the ithTCF.
The adjustedSOS RBC(A-SOS RBC) is theSOS RBCvalue times theTCFV[6]. A-SOS RBC = SOS RBC × T CF V (15)
5.2 Estimation of the Total Development Work Needed
The estimation of theSoSRequirements-based Effort (SOS RBE) value is based on the
A-SOS RBC. TheSOS RBEis significantly related to the productivity of the development
3
The sixteenTFCs are Complex processing, Data communication, Distributed functions, End user efficiency, Facilitate change, Heavily used configuration, Installation ease, Multiple sites, On-line data entry, On-On-line update, Operational ease, Performance, Reusability, Security concerns, Third partiesISand Transaction rate. See [5, 6] in order to have more details about theTCF’s and the process to follow in order to estimate the appropriateDIfor aTCF.
staff –it captures the conceptual complexity. The staff productivity is the ratio between the number of code lines written and the time required. It depends on the language used since the latter can be more or less complex, expressive, flexible, etc. The Quantita-tive Software Management firm (QSM), specialized in quantitative aspects of software creation, makes available the productivity of development staff for 65 programming languages. These values result from empirical research achieved on more than 2190 software implementation projects. For all the studied languages, QSM proposes the average value, the median as well as the lowest and the highest value of the number of lines of code needed4. For instance, the values of the J2EE language are, respectively, 46, 49, 15 and 67.
Equation 16 states how to compute theSOS RBE.
SOS RBE =(A-SOS RBC × L)
P (16)
where L is the number of code lines needed per function point as stated by theQSM com-pany. P is the productivity of the development staff express in lines of code per period. TheSOS RBEvalue estimates the number of periods needed for the implementation of the system-to-be developed within the service-oriented paradigm. The unit of theSOS RBEis the same than the period unit of P .
The development productivity variables P and L may lack of precision. There are two kinds of approach more sophisticated. The first one lies in calculating the ratio between the number of code lines and development time needed for previous internal projects (see, e.g., [19]). A second approach is to use a parametric estimation model built upon empirical data (see, e.g., [20]). A complete discussion of the development productivity computation is out of the scope of this paper.
6
Example Case of the Proposed Effort Estimation Model
A company active in the food industry would like a newISin order to improve the purchase management. With the newIS, a significant part of the orders should be au-tomatically sent. Currently, workers have to manually carry out all the orders. It exists a legacyISwhich manages the outgoing orders. Only its main function will be kept exposed as a service: it estimates the stock level needed.
First, stakeholders’ requirements were elicited based on which the system-to-be specifi-cations were modelled inUML. Briefly, it has to satisfy the following main Use Cases. View stock level: The system-to-be should enable the purchase department to consult the stock levels for all existing products. Carry out analysis of purchases: The stock manager would like to have a specific interface to analyze the purchases made (mainly with descriptive statistics and underlying graphic illustrations). Manage order error: The purchase manager is in charge of the errors management detected when outgoing orders are delivered and encoded by a warehouse worker. Send automatic order: One of the main requirements of the company is to enable automatic sending of orders when
4
All the results of this research are available at http://www.qsm.com/resources/function-point-languages-table. Last consultation in July 2013, the 3rd.
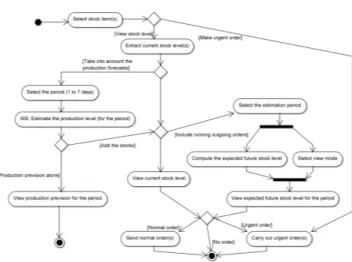
Fig. 2. Activity diagram of the Use Case View stock level
a given threshold is reached. The Use Cases were refined with otherUMLdiagrams. As an example, Fig. 2 represents the Activity diagram refining the Use Case: View stock level.
TheIOCidentified in the studied Activity diagram is 13: theICis 5, theOCis 13 and theDSCis 0. E.g., for the activity “Select stock item(s)”, theOCis 2 × 1 because of the request in the database (source weight is 2) allowing to display all the possible stock item(s) stored as string (type weigh is 1). TheICis 1 × 1 because of the selection made by the user through a device, e.g., the mouse or the keyboard.
Concerning theFRC, the Use Cases compose the functions set; their sub-functions are the steps of their respective Activity diagrams. TheFRCvalue for the studied Activity diagram is 10 (1 × 9 + 1); 1 because we study here the sub-functions of only one main function, i.e., one Use Case, 9 because there are nine sub-functions –send normal order(s)and carry out urgent order(s) are extends Use Cases and thus refined in other Activity diagrams; the activity Estimate the production level (for the period) will be achieved through the use of a Web Service (WS) (+1).
Based on the stakeholders’ non-functional requirements, theNFRCvalue is 10. The total
RCvalue identified in this Activity Diagram is 20 (10 + 10).
The stakeholders explain they want to use the J2EE development platform (one constraint) and theWS technologies –WSDL,SOAPand HTTP(three constraints)– in order to reuse the legacy application. Last but not least, theSoSwill be hosted on the existing application server (one constraint). The totalDCIvalue is 5 (1 + 3 + 1).
TheIFCvalue identified in the studied Activity Diagram is 16. There is one interface with the Warehouse ManagementIS, one with the 13 providerISs, one user interface for the workers at the purchase department and one interface for theWSused.
In this example, two user classes were identified: the workers at the Purchase Department and their manager. Both of these two classes are parametric users (weight of 2). They should access the system-to-be from their company offices. TheSDLCvalue is 2 (2 × 1). No additional system features were required for this Activity. TheSFCvalue is thus 0.
Once this work done for all the SoS specifications, the SOS RBC value can be computed. The result of this analysis based on Equations 1 to 13 is5:
SOS RBC= 5170.
TheSOS RBC value is then adjusted with theTCF’s applicable to this system-to-be such as, e.g., Distributed functions, Facilitate change and Third parties IS, with aDIvalue of, respectively, 2, 1 and 5 evaluated as described in [5, 6]. TheTCFV is: 0.65 + 0.01 × 27 = 0.96. TheA-SOS RBCvalue is: 5170 × 0.92 = 4756.4.
The last step is the computation of the total work needed for the implementation of the system-to-be. The reference language used is J2EE: L = 46 (cf. §5.2). The productivity of the staff development has been estimated to 37 lines per hour thanks to an analysis of previous projects. So, the total development effort needed is: SOS RBE= 4756.4×4637 ∼= 5790 hours. Once the average cost per hour known, the financial forecasting of the total development costs of the system-to-be can be drawn up.
7
Conclusions and Future Work
The model proposed, based on the specifications of aSoS, enables to compute the estimated development effort needed for its development. Eliciting, modelling and specifying correctly the requirements remain a significant success factor in the use of our model.
As underlined in §3, the three sources of software complexity –i.e., the structural, the conceptual and the computational complexity– are covered by the estimation model proposed. The analysis of the system-to-be specifications identifies the different software attributes of the structural complexity and put values behind each one (cf. Equations 1 to 13 from which theSOS RBCvalue can be computed). TheTCFs used to adjust theSOS RBCvalue (cf. Equation 15) aim at adding the computational complexity to the1 model proposed. Indeed, they refer to how will be processed the stakeholders’ requirements in the system-to-be according to its environment. Lastly, the conceptual complexity is taken into account in the last part of the model, i.e., in Equation 16, in which the productivity of the development staff is added comparatively to the development language chosen for the project.
However, we put aside some difficulties. First, the system-to-be can be coded with more than one language while allowing the use of other programming languages for implementing the services used. Secondly, the productivity of the development staff deserves more attention. Although this problem is out of the scope of this work, one significant question remains unsolved: Is the productivity of development staff the same forSoCprojects than for projects in line with other computing paradigms? To the best of our knowledge, there is no clear answer to this question.
References
1. Bielak, J.: Improving Size Estimates Using Historical Data. IEEE Software 17(6) (2000) 27–35
5
The detailed calculation is: ((IC + OC + DSC) × (F RC + N F RC) + DCI + IF C + SF C) × SDLC = ((21 + 33 + 5) × (33 + 10) + 8 + 39 + 1) × 2 = 5170.
2. Pendharkar, P.C.: Probabilistic estimation of software size and effort. Expert Systems with Applications 37(6) (2010) 4435–4440
3. Boehm, B.: Software Engineering Economics. Prentice-Hall (1981)
4. Tansey, B., Stroulia, E.: Valuating Software Service Development: Integrating COCOMO II and Real Options Theory. In: Proceedings of the First International Workshop on Economics of Software and Computation, IEEE Computer Society (2007) 8–10
5. Albrecht, A.J.: Function points as a measure of productivity. In: GUIDE 53 Meeting. (1981) 6. Symons, C.R.: Function Point Analysis: Difficulties and Improvements. IEEE Transactions
on Software Engineering 14(1) (1988) 2–11
7. Santillo, L.: Seizing and sizing SOA applications with COSMIC Function Points. In: Proceedings of the 4th Software Measurement European Forum (SMEF 2007). (2007) 155– 166
8. Oladimeji, Y.L., Folorunso, O., Taofeek, A.A., Adejumobi, A.I.: A Framework for Costing Service-Oriented Architecture (SOA) Projects Using Work Breakdown Structure (WBS) Approach. Global Journal of Computer Science and Technology 11(15) (2011) 35–47 9. Liu, J., Xu, Z., Qiao, J., Lin, S.: A defect prediction model for software based on service
oriented architecture using EXPERT COCOMO. In: Proceedings of the 21st annual interna-tional conference on Chinese Control and Decision Conference (CCDC’09), IEEE Computer Society (2009) 2639–2642
10. Li, Z., Keung, J.: Software Cost Estimation Framework for Service-Oriented Architecture Systems Using Divide-and-Conquer Approach. In: The Fifth IEEE International Symposium on Service-Oriented System Engineering (SOSE 2010), IEEE Computer Society (2010) 47–54 11. Laird, L.M., Brennan, M.C.: Software Measurement and Estimation: A Practical Approach.
Quantitative Software Engineering Series. Wiley - IEEE Computer Society (2007)
12. Sharma, A., Kushwaha, D.S.: Natural language based component extraction from requirement engineering document and its complexity analysis. ACM SIGSOFT Software Engineering Notes 36(1) (2011) 1–14
13. Sharma, A., Kushwaha, D.S.: Complexity measure based on requirement engineering doc-ument and its validation. In: International Conference on Computer and Communication Technology (ICCCT 2010), IEEE Computer Society (2010) 608–615
14. Sharma, A., Kushwaha, D.S.: A complexity measure based on requirement engineering document. Journal of Computer Science and Engineering 1(1) (2010) 112–117
15. Papazoglou, M.P., Georgakopoulos, D.: Service-oriented Computing. Communications of the ACM 46(10) (2003) 24–28
16. ISO/IEC: 25010 - Systems and software engineering - Systems and software Quality Require-ments and Evaluation (SQuaRE) - System and software quality models. Technical report, The International Organization for Standardization (2010)
17. Sharma, A., Kushwaha, D.S.: An Improved SRS Document Based Software Complexity Estimation and Its Robustness Analysis. In: Computer Networks and Information Technolo-gies. Volume 142 of Communications in Computer and Information Science. Springer Berlin Heidelberg (2011) 111–117
18. Kitchenham, B., Pfleeger, S.L., Fenton, N.E.: Towards a Framework for Software Measure-ment Validation. IEEE Transactions on Software Engineering 21(12) (1995) 929–943 19. Nguyen, V., Deeds-Rubin, S., Tan, T., Boehm, B.: A SLOC counting standard. In: The 22nd
International Annual Forum on COCOMO and Systems/Software Cost Modeling. (2007) 20. Cataldo, M., Herbsleb, J.D., Carley, K.M.: Socio-technical Congruence: A Framework for
Assessing the Impact of Technical and Work Dependencies on Software Development Pro-ductivity. In: Proceedings of the Second ACM-IEEE International Symposium on Empirical Software Engineering and Measurement (ESEM), ACM Press (2008) 2–11