Contents lists available atScienceDirect
Case Studies in Thermal Engineering
journal homepage:www.elsevier.com/locate/csiteHeat management methodology for enhanced global e
fficiency in
hybrid electric vehicles
F. Claude
a, H.S. Ramadan
b,c,⁎, M. Becherif
b, L. Boulon
d aSEGULA MATRA Technologies, 25200 Montbéliard, FrancebFCLab FR CNRS 3539, Femto-ST UMR CNRS 6174, Univ. of Bourgogne Franche-Comté/UTBM, 90010 Belfort, France cElectrical Power and Machines Dept., Faculty of Engineering, Zagazig University, 44519 Zagazig, Egypt
dHydrogen Research Institute, Université du Québec à Trois-Rivières, QC, Canada
A R T I C L E I N F O
Keywords: Electric vehicle Efficiency Multi-stack Fuel cellHeat transfer management
A B S T R A C T
The transportation impact on pollution and global climate change, has forced the automotive sector to search for more ecological solutions. Owing to the different properties of Fuel Cell (FC), real potential for reducing vehicles’ emissions has been witnessed. The optimization of FC in-tegration within Electric Vehicles (EVs) is one of the original solutions. This paper presents an innovating solution of multi-stack Fuel Cell Electrical Vehicle (FCEV) in terms of efficiency, durability and ecological impact on environment. The main objective is to illustrate the interest of using the multi-stack FC system on the global autonomy, cycling, and efficiency enhancement, besides optimizing its operation performance.
1. Introduction
Global warming and energy crisis are among the serious issues that threaten both developed and developing countries because of their ill-effects on the planet. However, no concrete solution is introduced to curb the expected undesired impacts. According to the International Energy Agency (IEA), the global CO2emissions from fuel combustion increase annually starting at 15.5Gt in 1975 to 32.1 Gt in 2015[1]. In emerging countries, the witnessed CO2and NOxemission rise rates are considerably accounted for through relevant scientific researches, political plans and roadmaps, besides both economic and environmental strategies. China is the highest CO2emitter since 2006 reaching 8.3 Gt in 2012 (55.46 Mt CO2in 1950). Thus, the total CO2emissions increased more than 100 times during about 62 years[2].
Regarding the Green House Gases (GHG) emissions rate, the contribution of road transport to the total European Union (EU) emissions has increased from 13% share in 1990 to almost 20% in 2013[3]. About 23% and 30% of the total EU emissions are due to CO2and NOXrespectively[3]. Although the EU legislation that tends to reduce these emissions, the proposed propositions in reality are still not that ecological[4].
The use of primary energies annually increases but not their availability[4,5]. Real solutions should be proposed to limit their consumption in all sectors and particularly in the transportation that represents 78.9% of the fossil energy use. In France, sincere efforts have been performed to decrease the energy consumption by 23.5 Mtep (−5.7%) from 2015 to 2016. Therefore, the energy independence of the county has increased to 51.9%. However, the majority of the French energy independence comes from Nuclear energy use. Accordingly, Renewable Energy (RE) technology improvement and deployment should be considered as a worldwide perspective[6,7]. In Germany, RE is 50% more than in France. However, their energy independence is around 41%[7]. In 2013, the
http://dx.doi.org/10.1016/j.csite.2017.06.006
Received 17 March 2017; Received in revised form 4 June 2017; Accepted 20 June 2017
⁎Corresponding author at: FCLab FR CNRS 3539, Femto-ST UMR CNRS 6174, Univ. of Bourgogne Franche-Comté/UTBM, 90010 Belfort, France.
E-mail address:[email protected](H.S. Ramadan).
Available online 09 August 2017
2214-157X/ © 2017 Published by Elsevier Ltd. This is an open access article under the CC BY-NC-ND license (http://creativecommons.org/licenses/BY-NC-ND/4.0/).
energy self-sufficient was over 61% in USA, mostly due to oil stocks[8]. Different countries are still suffering from energy-de-pendency on other countries such as both Morocco and Jordan (about 10% of energy independence)[9].
Fig. 1shows the GHG emissions by sector for EU-28 and France according to the European Environment Agency (EEA) and the Interprofessional Technical Centre for Studies on Air Pollution (CITEPA) respectively. Road transportation is thefirst GHG emissions mode with more than 72% and 94.6% of total share for EU-28 and France respectively[10,11]. The private cars represent con-siderable percentage (44.4% and 53.1% respectively). This value is more than the double percentage of heavy duty vehicle emissions. In addition to the pollution, road transportation is an important part of the countries’ outcomes. In France, 77% of the annual transportation is due to road transportation according to the Ministry of Ecology, Sustainable Development and Energy[10]. In 2016, the road transportation cost 360 M€ that represents about 17% of the annual French Gross Domestic Product (GDP).
In this context, Fuel Cell (FC) transport systems are considered as one of the convenient solutions for clean transportation. Thanks to its physical and chemical properties, Hydrogen becomes among the main players in the future energy systems for a sincere step-wise transition from today's fossil system to a CO2emission-free energy supply for both, stationary and mobile applications. Hydrogen has a relatively high gravimetric energy density (120 MJ/kg), which is 3 times higher than oil and 200 times higher than a lithium battery[12]. Indeed, the use of the hydrogen produced by the water electrolysis using RE sources, combined with a FC, provides a feasible option for green energy cycle. The hybridization of FC and battery can be assumed among the best combined system in terms of power and energy owing to the high gravimetric energy of hydrogen. This advantage increases the autonomy of the vehicle and confers a high interest in this hybridization. Proton Exchange Membrane Fuel Cells (PEMFCs) has the particularity of an average starting time constraining to combine FCs with a power source as battery. The battery assures the start-up when FCs regenerate the vehicle energy during braking. The FCs can be easily integrated into the Electric Vehicle (EV) compared to other technologies that results more desired hybrid systems.
Towards the development of hydrogen economy and the fossil fuels independency, different quantitative and qualitative research efforts have been performed to develop EVs powered by the PEMFC[13]. However, this technology is still expensive mainly because of the rarity and cost of Platinum. According to the French Atomic Energy Commission (CEA), half price of PEMFCs is due to Platinum
Nomenclature
Pcleared_out Cooling power evacuated by the radiator Pcooling Cooling power needed to maintain the cell around
its optimal temperature
Pexcess Heating power in excess produced by one cell and
transmitted to the next one
PInternal_heating Internal power produced by the cell
PThermo External Power provided by Thermocouples
SOC Battery State Of Charge
Tcell Cell temperature
Tf1 Fluid entry temperature in the cell Tf2 Fluid exit temperature out of the cell Tmax Maximum Cell temperature (≈80°C) Tmin Minimum Cell temperature (≈23°C)
[14]. Researches are in progress to limit the platinum use in order to reduce the FC price[13]. Therefore the combination of less expensive metals (cobalt, nickel or palladium) with platinum in FCs or the development of active layers reducing the quantity of platinum can be considered[14].
The recent studies of the Ministry of Economy, Trade and Industry (METI) in France highlight that 40kT of Platinum is available [15]. Nowadays, the annual global production is around 150 T (0.11% of the total every year). The estimation of the increase of FCEV would lead to an annual production increase to 450 T (0.33% of the total).
The originality of the paper is in favor of the innovating Thermal Management (TM) research on the multi-stack FC and the effect on FCs efficiency and lifetime. An original thermal regulation is proposed. The numerical simulations lead to characterize the FC heating. The proper TM of a multi-stack FC system allows a better use of the FCs increasing their lifetime. In addition, knowing the relationship between FC temperature and efficiency will help enhancing the system global efficiency.
The present paper is organized as follows: inSection 2, a comprehensive literature review that shows the importance of con-trolling the FC parameters and the relevant TM is illustrated.Section 3focuses on the interest of the multi-stack system and provides an overview of the overall battery/FC system's configuration and modeling. The feedback controller methodology between the two sources is presented inSection 4. The thermal transfer management architecture is introduced in theSection 5. The numerical simulation results shows the heating and cooling needs for the multi-stack FC global efficiency enhancement are discussed inSection 6. Finally, the conclusions and the perspectives of the research are drawn inSection 7.
2. Literature review
Numerous studies have illustrated the particular FC power effect on stationary applications. Ellamla et al. (2015) have studied the cogeneration of FC and Power Combined Heat Power (FCCHP) systems in the residential sector to help solve energy shortages, climate change and energy conservation issues[16]. In addition, Bigdeli (2015) has proposed different optimal hybrid techniques for the management of a hybrid power generation system including photovoltaic (PV), FC and battery[17]. The PEMFC technology is very promising and brings several studies about the effect of internal and external PEMFC parameters to improve FC efficiency, sizing and cost as highlighted by Noguer et al. (2015)[18]. Eren and Gorgun (2015) have studied the optimal sizing of FCEV[18,19].
As FC lifetime is one of the restrictive parameters, numerous studies have focused on enhancing the efficiency and lifetime of the FC by modeling methodology (parametric effect, flow rate regulation, and current compensation technique …etc) as presented by Sharma et al. (2015) and Mayur et al. (2015)[20,21].
To improve FC reliability, investigations have been performed on degradation factors. Ahmad et al. (2015) have analyzed the compression effect on PEMFC while Hou et al. (2016) have highlighted the effect of road vibration on their performance and degradation[22,23].
As the PEMFC cost is one of the limiting factors, various studies, mostly on electrolyte membrane, have been achieved to enhance efficiency and reduce the platinum. Torkavannejad et al. (2015) have introduced three novel architectures of PEMFCs, called circular, square and octagonal duct-shaped in order to reduce cost and improve the efficiency[24].
The hybridized system control issue is important and numerous researches have proposed the energy management of FCEVs to increase power delivery and to enhance the system performance combining the battery with Supercapacitors (SC) as supposed by García et al. (2013)[25]. Then, Sikkabut et al. (2015) have proposed a control strategy algorithm based on nonlinearflatness-based controllers[26]. Furthermore, different studies on electrical powertrain configurations have focused on reducing hydrogen con-sumption as introduced by Sari et al. (2016)[27].
Finally, the FCs TM challenges becomes one of the most complicated and interested issue. To solve the cold, start two TM strategies (keep warm and Thaw at start) have been introduced by Amamou et al. (2015)[28]. FC optimal temperature issues was explored through TM strategies and the temperature model by Fagundes et al. (2015)[29]. Jaeyong et al. (2015) have presented TM strategies for a PEMFC system to evaluate the parasitic power of the cooling system with changes in the operating temperature[30]. Diverse researches are proposed to increase the stack efficiency by air cooling control as proposed by Hwang and Kim[31]. To treat water management and humidification methods, Moçotéguy et al. (2016) have proposed a Design of Experiments (DoE) test plan in order to discriminate the direct effects of several factors on the water management[32].
Answers of these questions are essential forfiguring out the real and actual development of FC technology because of their direct impact on the FC durability, efficiency, consumption and behavior.
This research principally discusses the benefit of using the multi-stack FC system and the particular architecture to control the energy. The TM inside the multi-stack FC coupled with the batteries power source.
3. System under study
In EVs, battery and FCs are used as a supplementary source of energy. One of the most important interests of using FCs is the byproducts of this zero CO2emission, such as water and heat. High rated power of using the unique FC can be more expensive and less reliable than multi-stack FC systems. In addition, the faulty stack replacement would be cheaper and easier in case of multi-stack FCs. However, the use of multi-stack FC system requires special TM. The considered system stands on preheating inter-stacks FCs using overheat to save energy and to improve the global system performance.
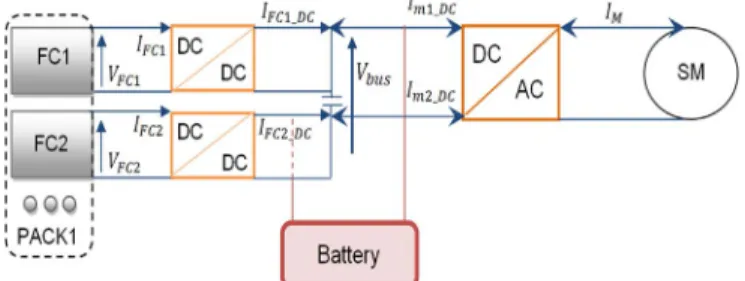
The structure of hybridization composed by FCs and battery is shown inFig. 2.
The power bus links the FCs to the electrical engines while the battery is directly connected to the bus. The converter monitors the requested power from FCs. In the electrical circuit, an isolated boost between the FC and the power bus is used for increasing the FC voltage and for matching the power bus. Moreover, a galvanic isolation allows protecting the FCs against any return of current during the battery charge by a deceleration of the Synchronous Motor (SM).
To design this structure and to obtain real time multi-domain coupling problem (electrical and thermal for instance), the Mathematical Temporal Calculation Simulation (MTCSim©) software is used. Developed by Segula Technologies in 2012, this soft-ware has been mainly employed to the development of new engines, energy management and components sizing. Using MTCSim©, it is possible to dimension the electrical power needs of the system to simulate the relevant autonomy issue of the global setup. However, the difficulty remains the thermal transfer management in the multi-stack system.
4. Heat management procedure
One of the most important advantages of the multi-stack configuration is the possibility to use several FC with average power and not their maximum. This solution impacts on efficiency enhancement as FCs have better efficiency at lower power. The activation of several FCs allows to separate the global power demand and to use each FC at lower power and better efficiency in contrary of using
Table 1
at its full high rated power.
To maximize FCs life span, the number of cycles start/stop of each cell need to be minimized because it is directly tied to the lifespan of the cell (500–1000 cycles). FCs energy contribution is reduced instead of switched off during in a lower power demand phase (deceleration for instance). Different operating modes are depicted inTable 1.
During the FCs start-up, the battery is the only source of power. In case 1, the vehicle power demand only necessitate one FC associated to the battery. Cell 1 is activated and operates at optimal power. The power demand increase and requires using cell 1 at maximum power. To minimize its use and to maintain the best efficiency as possible, cell 2 is active to relieve the first one and operates both of them at average power (case 2 and 3). Case 4, 5 and 6 illustrate the same scenario when power demand increase again.
Finally, a cycling system can be included to enhance the global FCs life span. With the identification of the number of cycling of all FCs, it is possible to activate the less stacks used in a multi-stack FC to save others as in case7.
This configuration implies to consider each FC independently, even in a same stack. FC needs to be activated and heated sepa-rately as their use will depend on the instantaneous power demand. In the multi-stack configuration, the FCs may be sepasepa-rately replaced due to the parallel installation. In case of a faulty FC stack, the other healthy stacks can be used for allowing the car reaching a safe place.
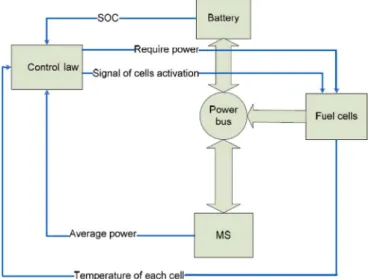
The TM of multi-stack FCs system is complex as each FC needs to be managed independently in terms of heating, cooling and power delivery. In addition, each FC has its imposed start-up time so the TM needs to be efficient as possible and the FCs should be maintained at their optimal temperature range at the same time. Therefore, the management of the excess heat may allow to heat faster the next FC. This excess has to be lead with the heating process to avoid any overtaking of the FC maximum temperature. To realize these conditions and to enhance FCs lifetime, the control system and a FC activation law proposed in this study is depicted in Fig. 3.
To deliver the minimum power, FC needs to be heated atTmin(23 °C at least). During this time of start-up, the battery will provide
the vehicle demand. Beyond this temperature, the FC becomes active and starts to deliver power and the self-heating process. The FC can reach the optimal temperature range (around 70 °C) by using its own produced heating. The excess heat can be transmitted and used by the next FCs and so on. This management constitutes the TM of FCs presented inTable 2.
5. Thermal management system
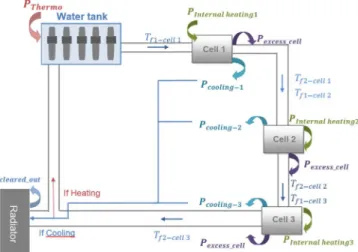
To simulate the cooling and heating issues, the TM scheme has been implemented in MTCSim©. The FC temperature increases and the optimal temperature stabilization are represented by transfer function as thermal inertia. The FC temperature depends on the fluid and the ambient temperature associated to flow rate. When several FCs are implemented in the thermal model, the impact of the excess power of one is observable on the next and so on.
The TM procedure of the MTCSim© simulation is described inFig. 4andTable 3. Thefirst FC needs to be heated to 23 °C to start its internal heating. The external heating can be stopped around 30 °C. The cooling is started when the cell temperature reaches 60 °C. At this point, the internal heating decreases and the cooling process aims is to maintain the FC around its optimal temperature (68.8 °C in the numerical simulations).
The excess heating power delivered by thefirst FC is the difference between the power used for heating and the one needed to cool itself. This excess is transmitted to the next FC that will use it as replacement of the external electrical power. The internal heating power required will be inferior to thefirst cell and more excess power will be transmitted to the third one and repeatedly cell to cell. In[33,34] de Bortoli et al. have proposed a thermal management of a multi stack FCs system. Although the considerable
simulation results, the authors have not taken into account a real heating system process and the external conditions over the FCs heating issues. In this study, the proposed TM method proposed is based on a real thermal architecture as water exchanger and shows interesting results. The advantage of using a multi-stack system on the heating system is highlighted. The FCs direct impact on efficiency and lifetime is shown.
To understand the relation between FCs heating, lifetime and efficiency, it is important to know that the FC stack efficiency depends on the electrical power delivered and the power consumed by the fuel (hydrogen).
= η P P stack stack H2 (1)
Pstack is depending on the intensity and voltage of the FC:
= ×
Pstack Istack Ustack[W] (2)
On the other hand, the stack intensity is linked to the temperature by a relation given par a FC professional Ballard[35]:
= × + +
Toptim Istack (0, 53 26, 01) 273, 15[ ]K (3)
with Eqs.(1)–(3), it easy to understand that the FC delivered power depends on the intensity and temperature of the FC and that the optimal temperature will lead to the optimal power and the optimal efficiency:
= ↔ − = − η I T P P η I T P P ( , ) ( , ) stack stack H stack Optim optim stack Optim H 2 2 (4) Table 2
FCs and battery activation laws. FCs
>
Tcell Tmax FC cooled and excess of temperature used to preheat a second FC
< <
Tmin Tcell Tmax FC power delivers at optimal temperature range
<
Tcell Tmin FC heated to deliver power
Battery
SOC > 90% Battery is priority and FC activated function at low power.
25% < SOC < 90% A linear variation of power demand is established. FCs are activated and function at certain power in consequences SOC < 25% Battery safety limit. FCs provides the total power demanded by the vehicle
Fig. 4. Thermal regulation diagram.
Table 3
Thermal regulation conditions.
Tcell <30°C P,thermo>0 External heating Otherwise,,Pthermo=0
≥23°C P,Internal_heating>0 Internal heating OtherwisePInternal_heating=0
≥60°C P,cooling<0 Cooling OtherwisePcooling=0
Eq.(4)clearly links the temperature and the efficiency. It illustrates the importance of the proper TM to extract the FC optimal power. The two parameters are also linked to the FC lifetime. Using the FC on its optimal properties allows reducing the membrane degradation and enhancing the durability of the FC[33–41].
6. Simulation results
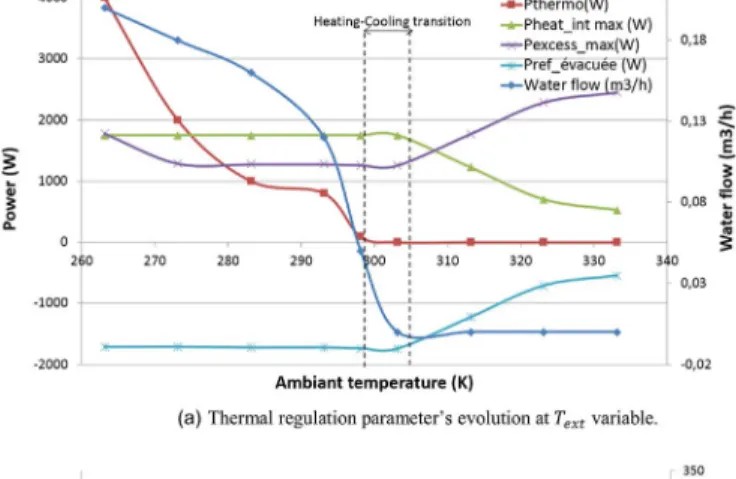
Thefirst study leaded was the effect of external temperature (Text) on the TM parameters for one FC. The thermal regulation system depicted inFig. 4was implemented into MTCSim©to obtainFig. 5results.
Fig. 5(a) shows the limit between the heating and the cooling aroundText=30°Cwhich is the temperature limit to use the external
heating (atTcell>30°C P,thermo=0). When the external temperature is warm enough, the external heating is no longer necessary because the FC is already at its start-up temperature and can heat itself. That explains the drop ofPthermoand the waterflow decreasing to
reach 0m h3/ .
ForText>30°C, the cooling is gradually superior to the heating and more excess power can be transmitted to the next FC. The
cooling power is negative because the power needs to be evacuated. The FC is not literally cooled, However, a part of the power is evacuated to maintain the FC at its optimal temperature.
Fig. 5(b) depicts the FC and thermalfluid temperature evolution atText=10°C. The evolution is very interesting and highlights the
TM conditions (Internal heating starting at 23 °C, and External heating stopped at 30 °C).Fig. 5(b) depicts that the FC reaches its optimal temperature after around 70–75 s but still undergo few variations. The temperature is stabilized after 100 s.
The (Tf1 and Tf2) curves refer to thefluid temperature in the FC (entry and exit) respectively. The fluid entry temperature is considered as a constant source and thefluid exit is calculated as shown:
= − × × × T T P ρ Cp q K 3600 ̇ [ ] f f thermo water 2 1 (5) Thefluid temperature hysteresis observable is characteristic of an exchanger regulation and explains the variation of T .cell
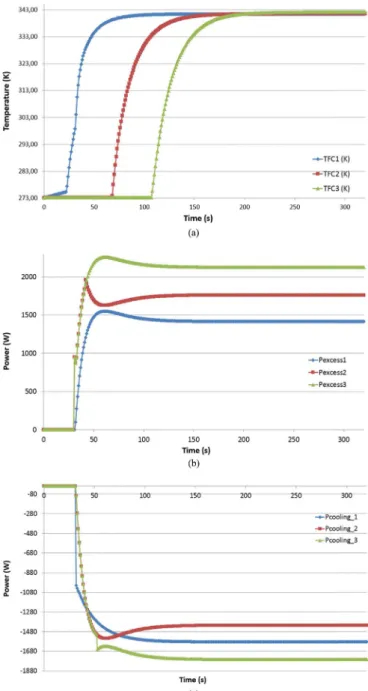
A second study is realized, based on the same numerical simulation model, but considering three FCs. The study aim is to observe this time the importance of the excess power transmitted from one FC to another on the heating duration of the FCs. The principle is to reduce this duration cell by cell. The duration of the system heating is very important because it conditions the warm-up time of the entire system and the rapidity of the multi-stack FC system to respond to the vehicle power demand.
InFig. 6(a), the temperature of the different FCs (TFC1, TFC2and TFC3) increase respectively from 273 K to their steady state values
of about 333.8 K. The requested time to reach these value are not the same for the three FCs. FromFig. 6(a), the warm-up duration of the 3 FC can be observed. Thefirst remark is that a duration gain is observable between the first cell and the second and even more important between cell 2 and cell 3. The second observation is the time delay between the activation of thefirst, second and third cell.
Fig. 6. Dynamic performance during TM for 3 FCs. (a) FCs Excess Power evolution atText=10°C. (b) FCs Cooling Power evolution atText=10°C.
Table 4
Extrapolation of the gain duration for a complete multi-stack FC system atText=10°C.
Warm-up gain FC2 (s) 0.1 1.3%
Warm-up gain FC3 (s) 9.1 12.3%
Warm-up gain FC4 (s) 19 25.3%
Numbers of FC for the system considered 10 Warm-up gain for 2 packs of 3 FCs 18.2 Warm-up gain for 1 packs of 4 FCs 19
The temperature of cell 2 cannot increase as long as thefirst one does not reach 23 °C at least and start its internal heating. Few time after the activation temperature reached by thefirst cell and when the cell provide enough power to warm and transmit excess power to the next one, the temperature of the second cell starts to increase and so on. AtText=10°Cfor example a gain of 0.1 s is observed
between the warm-up time of thefirst and second FC. The gain begins to be significant at 3 FCs as the gain between the third FC and thefirst is around 9.1 s. The results shows promising benefit for an overall multi-stack FC system.
Fig. 6(b) illustrates the evolution of the excess power (atText=10°C) for the three FCs. Obviously, the power is higher for FC3
than FC2 and FC1. Therefore, the excess power of a multi-stack system can be properly used.
The excess power increases with the decrease of the internal heating power. The dynamic performance steady state stability is reached. The same evolution is observed inFig. 6(c). The cooling power increases as a part of the heating power should be evacuated from the system to maintain the FC at its optimal temperature.
Finally, an extrapolation of the total gain of warm-up for the overall system can be proposed as introduced inTable 4. From the system analysis presented inTable 4, 10 FCs of 3 kW each are used. The system is split into two packs of three FCs and one of 4 FCs. Each pack of three FCs can gain up to 9.1 s. Therefore, a gain of around 18.2 s is reached for both packs.
The extrapolation performed on a fourth cell allows considering the warm-up gain of the single 4 FC pack of around 19 s. For the two packs of three cells, the warm-up gain reaches 12.3% than a single FC and up to 25.3% for the 4 FCs pack. If the entire system is considered the gain can be around 5% for the warm-up which is not neglected.
To conclude, two main properties of the multi-stack FC have been highlighted in the study. First, the importance of the proper thermal management for a warm-up gain of the system. Second, the FC temperature can be maintained at its optimal temperature. Accordingly, the lifetime enhancement can be reached using more carefully the FCs. Indeed, the global efficiency and management of the system is upgraded as the multi-stack system is more quickly available to respond of the vehicle power and energy demand. The second one affects the multi-stack FC efficiency as the delivered power is directly linked to the temperature and so is the efficiency. Maintaining by a proper TM of the FC temperature as close as possible to the FC optimal temperature leads to an enhanced delivered power and efficiency.
7. Conclusions and perspectives
The paper presents a real interesting advance towards the understanding and the improvement of the multi-stack FC system. Based on the numerical simulation results via MTCsim©software., the multi-stack FC integration is considered as an ideal solution to increase the FC vehicle efficiency thanks to the possible proper heat management and the thermal dissipation recovery. Moreover, the activation response time of each FC and the life time of each FC rise thanks to a management activation process of each/all FC.
With a 25.3% heat gain for the FC4 and 5% for the overall HEV system, the thermal management solution shows that the FCs overheat recovery is an innovative solution for improving the overall efficiency of the multi-stack FC system integrated into HEVs. The forthcoming studies will mainly focus on the experimental validation of the proposed TM approach for the feasibility of the proposed system, lifespan enhancement, cycle, efficiency and reliability of the EV. In such study, the different parameters un-certainties such as degradation rate, real lifespan etc…. will be accounted for. In addition, the different advanced control methods can be applied to the system for reaching enhanced dynamic responses.
Acknowledgement
The authors gratefully acknowledge thefinancial and technical support of Segula Technologies for the use of MTCSim©software during the realization of this scientific research.
References
[1] International Energy Agency (IEA), Report March 2016; Available online:〈www.iea.org〉.
[2] Belfcenter, Carbon Emissions Report 2015; Available online:〈http://belfercenter.ksg.harvard.edu/files/carbon-emissions-report-2015-final.pdf〉.
[3] European Environment Agency (EEA), Explaining road transport emissions Report 2016; Available online: 〈http://www.eea.europa.eu/publications/explaining-road-transport-emissions〉.
[4 ] Ministry of the Ecology, Sustainable Development and Energy (MEDDE), Energy keys number 2016, Energetic conjecture 2016, Transportation keys number 2016; Available online:〈www.developpement-durable.gouv.fr/〉.
[5] Ministry of the Ecology, Sustainable Development and Energy (MEDDE), Energy keys number 2016, Energetic conjecture 2016, Transportation keys number 2016; Available online:〈www.developpement-durable.gouv.fr/〉.
[6] Ministry of the Ecology, Sustainable Development and Energy (MEDDE), Energy keys number 2016, Energetic conjecture 2016, Transportation keys number 2016; Available online:〈www.developpement-durable.gouv.fr/〉.
[7] Global Chance, La consommation d′énergie en Allemagne et en France; Available online:〈http://www.global-chance.org/IMG/pdf/Laponche_AllFr13_ 02juin2011.pdf〉.
[8] Wall Street Journal, " Energy Independence ", Daniel YERGIN.
[9] Statfor, Analysis Bright future solar power in Middle East; Available online:〈https://www.stratfor.com〉.
[10] EEA, keyfigure of Report N°15/2016 Annual European Union GHG inventory 1990–2014. Available online: 〈http://www.eea.europa.eu/publications/european-union-greenhouse-gas-inventory-2016〉.
[11] The Interprofessional Technical Centre for Studies on Air Pollution (CITEPA), Specific emissions of CO2 of cars, Report June. Available online:〈http://www. citepa.org/〉.
[12] Air liquid Creative Oxigen, Hydrogen Planet Hydrogen by the numbers; Available online: 〈http://www.planete-hydrogene.com/en/hydrogen-1/hydrogen-by-the-numbers〉.
[13] The French National Research Agency (ANR), Hydrogen and FC, Report; Available online: 〈http://www.cea.fr/english/Pages/research-areas/renewable-energies〉.
[14] Atomic Energy Commssion (CEA), Archive of calls for proposals; Available online: 〈http://www.agence-nationale-recherche.fr/en/projects-and-results/archive-of-calls-for-proposals〉.
[15] Ministry of economy, Trade and Industry (METI), 2010–2020 previsions; Available online:〈http://www.meti.go.jp/english/statistics/index〉.
[16]H.R. Ellamla, I. Staffell, P. Bujlo, B.G. Pollet, S. Pasupathi, Current status of fuel cell based combined heat and power systems for residential sector, J. Power Sources (2015) 312–328.
[17]N. Bigdeli, Optimal management of hybrid PV/fuel cell/battery power system:“a comparison of optimal hybrid approaches”, Renew. Sustain. Energy Rev. (2015) 377–393.
[18]N. Noguer, D. Candusso, R. Kouta, F. Harel, W. Charon, G. Coquery, A PEMFC multi-physical model to evaluate the consequences of parameter uncertainty on the fuel cell performance, Int. J. Hydrog. Energy, Elsvier (2015) 3968–3980.
[19]Y. Eren, H. Gorgun, An applied methodology for multi-objective optimum sizing of hybrid electric vehicle components, Int. J. Hydrog. Energy, Elsvier (2015) 2312–2319.
[20] M.Sharma, R.K. Pachauri, S.K. Goel, MATLAB/simulink modeling and analysis of parametric effects on PEMFC performance, 2015 International Conference on Recent Developments in Control, Automation and Power Engineering (RDCAPE), IEEE, 2015, pp. 226–231.
[21]M. Mayur, S. Strahl, A. Husar, W.G. Bessler, A multi-time scale modeling methodology for PEMFC performance and durability in a virtual fuel cell car, Int. J. Hydrog. Energy, Elsevier (2015) 16466–16476.
[22]M. Ahmad, R. Harrison, J. Meredith, A. Bindel, B. Todd, Analysis of the compression characteristics of a PEM stack, development of an equivalent spring model and recommendations for compression process improvements, Int. Renew. Energy Congr., IEEE (2015) 9–15.
[23]Y. Hou, D. Hao, J. Shen, P. Li, T. Zhang, H. Wang, Effect of strengthened road vibration on performance degradation of PEM fuel cell stack, Int. J. Hydrog. Energy, Elsevier (2016) 5123–5134.
[24]A. Torkavannejad, H. Sadeghifar, N. Pourmahmoud, F. Ramin, Novel architectures of polymer electrolyte membrane fuel cells: efficiency enhancement and cost reduction, Int. J. Hydrog. Energy (2015) 12466–12477.
[25]P. García, J.P. Torreglosa, L.M. Fernández, F. Jurado, Control strategies for high-power electric vehicles powered by hydrogen fuel cell, battery and super-capacitor, Expert Syst. Appl. (2013) 4791–4804.
[26] S. Sikkabut, P. Mungporn, B. Yodwong, C. Ekkaravarodome, B. Nahid-Mobarakeh, S. Pierfederici, B. Davat, P. Thounthong, Comparative study of control approaches of li-ion battery/supercapacitor storage devices for fuel cell power plant, 2015 International Conference on Clean Electrical Power (ICCEP), IEEE, pp 647–652.
[27] G.Sari, Y.Özçelep, A.Kuntman, On the optimum powertrain configuration of fuel cell powered vehicle for minimum hydrogen consumption, in: 2015 Proceedings of the 9th International Conference on Electrical and Electronics Engineering (ELECO), IEEE, pp 379–382.
[28] A.Amamou, L.Boulon, S. Kelouwani, K.Agbossou, P.Sicard, Thermal management strategies for cold start of automotive PEMFC, IEEE Vehicle Power and Propulsion Conference (VPPC), 2015.
[29]L.P. Fagundes, H.J. Avelar, F.D. Fagundes, M.J. da Cunha, F. Vincenzi, Improvements in identification of fuel cell temperature model, IEEE (2015). [30]H. Jaeyong, P. Jisoo, Y. Sangseok, Control strategy of cooling system for the optimization of parasitic power of automotive fuel cell system, Int. J. Hydrog.
Energy, Elsevier (2015) 13549–13557.
[31]S.H. Hwang, M.S. Kim, An experimental study on the cathode humidification and evaporative cooling of polymer electrolyte membrane fuel cells using direct water injection method at high current densities, Appl. Therm. Eng., Elsvier (2016) 635–644.
[32]P. Moçotéguy, B. Ludwig, N.Y. Steiner, Application of current steps and design of experiments methodology to the detection of water management faults in a proton exchange membrane fuel cell stack, J. Power Sources 99 (2016) 126–136.
[33] Q.de Bortoli, H.S. Ramadan, M. Becherif, L. Boulon, F. Claude, Thermal management for efficiency enhancement for multi-stack fuel cell electric vehicle, IEEE Vehicle Power and Propulsion Conference (VPPC), Canada, 2015.
[34]H.S. Ramadan, Q. de Bortoli, M. Becherif, F. Claude, Multi-stack fuel cell efficiency enhancement based on thermal management, IET Electr. Syst. Transp. 7 (1) (2017) 65–73.
[35] Ballard, Product Manual and Integration Guide, Document Number: MAN5100319−0B, FCgen-1020ACS Fuel Cell stack. Available online:〈http://ballard.com/ power-products/fuel-cell-stack/〉.
[36]N. Marx, D. Hissel, F. Gustin, L. Boulon, K. Agbossou, On the sizing and energy management of a hybrid multistack fuel cell– battery system for automotive applications, Int. J. Hydrog. Energy 42 (2) (2017).
[37]N. Marx, L. Boulon, F. Gustin, D. Hissel, K. Agbossou, A review of multi-stack and modular fuel cell systems: interests, application areas and on-going research activities, Int. J. Hydrog. Energy 39 (23) (2014) 12101–12111.
[38]A. Benmouna, M. Becherif, D. Depernet, F. Gustin, H.S. Ramadan, S. Fukuhara, Fault diagnosis methods for proton exchange membrane fuel cell system, Int. J. Hydrog. Energy 42 (2) (2017) 1534–1543.
[39]K. Ettihir, L. Boulon, M. Becherif, K. Agbossou, H.S. Ramadan, Online semi-empirical identification of PEMFC parameters via recursive least square approach, Int. J. Hydrog. Energy 39 (36) (2014) 21165–21176.
[40]A. Saadi, M. Becherif, D. Hissel, H.S. Ramadan, Dynamic modeling and experimental analysis of PEMFCs: a comparative study, Int. J. Hydrog. Energy 42 (2) (2017) 1544–1557.
[41]M. Becherif, H.S. Ramadan, M.Y. Ayad, D. Hissel, U. Desideri, M. Antonelli, Efficient start–up energy management via nonlinear control for eco–traction systems, Appl. Energy 187 (2017) 899–909.
![Fig. 1. Comparison of EU28 and US GHG emissions [10,11].](https://thumb-eu.123doks.com/thumbv2/123doknet/14605599.731760/2.816.224.594.627.1006/fig-comparison-eu-ghg-emissions.webp)