HAL Id: tel-02521046
https://tel.archives-ouvertes.fr/tel-02521046v2
Submitted on 15 May 2020HAL is a multi-disciplinary open access archive for the deposit and dissemination of sci-entific research documents, whether they are pub-lished or not. The documents may come from teaching and research institutions in France or abroad, or from public or private research centers.
L’archive ouverte pluridisciplinaire HAL, est destinée au dépôt et à la diffusion de documents scientifiques de niveau recherche, publiés ou non, émanant des établissements d’enseignement et de recherche français ou étrangers, des laboratoires publics ou privés.
influence of sodium dithionate
Manon Schindler
To cite this version:
Manon Schindler. Deracemization of sodium chlorate with or without the influence of sodium dithionate. Cristallography. Normandie Université, 2020. English. �NNT : 2020NORMR004�. �tel-02521046v2�
THÈSE
Pour obtenir le diplôme de doctorat
Spécialité Physique
Préparée au sein de l’Université de Rouen Normandie
Deracémisation du chlorate de sodium avec et sans l’influence du
dithionate de sodium
Présentée et soutenue par
Manon SCHINDLER
Thèse dirigée par Gérard COQUEREL, professeur des universités au laboratoire Sciences et Méthodes Séparatives (EA3233 SMS)
Thèse soutenue publiquement le 13 mars 2020 devant le jury composé de
Mme. Elizabeth HILLARD Dr. Hab. Université de Bordeaux Rapporteur
M. Elias VLIEG Pr. Université Radboud de Nimègue Rapporteur
Mme. Sylvie MALO Pr. Université de Caen Normandie Présidente
M. Woo Sik KIM Pr. Université Kyung Hee de Séoul Examinateur
THÈSE
Pour obtenir le diplôme de doctorat
Spécialité Physique
Préparée au sein de l’Université de Rouen Normandie
Deracemization of sodium chlorate with or without the influence of
sodium dithionate
Présentée et soutenue par
Manon SCHINDLER
Thèse dirigée par Gérard COQUEREL, professeur des universités au laboratoire Sciences et Méthodes Séparatives (EA3233 SMS)
Thèse soutenue publiquement le 13 mars 2020 devant le jury composé de
Mme. Elizabeth HILLARD Dr. Hab. Université de Bordeaux Rapporteur
M. Elias VLIEG Pr. Université Radboud de Nimègue Rapporteur
Mme. Sylvie MALO Pr. Université de Caen Normandie Présidente
M. Woo Sik KIM Pr. Université Kyung Hee de Séoul Examinateur
Acknowledgements
This work was funded by the Normandy region and European regional development fund (FEDER) through the SCAMPI project.
First, I want to thank Prof. Gérard Coquerel for giving me the opportunity to achieve this Ph.D in the SMS laboratory and supervising me. Thank you for sharing your knowledge and your infinite passion for heterogeneous equilibria, crystallization and crystals in general, which brought me here today. Moreover, thank you for your determination to find the best opportunities for all of us. In my case, my Swiss break of 5 months in Nestlé would not have been possible without your disposition to think outside the box. It has been a great opportunity to develop my knowledge about crystallization in industrial field and to reinforce my English level.
Then, I give a particular thanks to Dr. Clément Brandel for supervising my master and Ph.D work. I thank you for sharing your knowledge and valuable ideas and proposals during the past 3 years, for spending time to read and amend all of my writings and presentations and for having believe in me since the beginning. This Ph.D would not have been the same without your contribution and your support.
I would like to thank the jury members, Dr. Elizabeth Hillard and Pr. Elias Vlieg as reviewers and Pr. Sylvie Malo and Pr. Woo Sik Kim as examiners, for accepting to review my thesis. All of your comments will certainly lead to interesting discussion during the defense. I would like thank twice Pr. Woo Sik Kim for our fruitful discussion and collaboration and also Bowen Zhang for our exchange of results and advises.
J’écris maintenant en français pour remercier toutes les personnes qui ont contribuées, à leur manière et de plus ou moins loin à cette thèse.
Merci aux Docteurs-Permanents du laboratoire, Yohann Cartigny, pour m’avoir mis le pied à l’étrier des équilibres hétérogènes et de m’avoir encadrée et conseillée pendant mes deux premiers passages au laboratoire ; Gabin Gbabode pour toutes nos longues discussions scientifiques et non scientifiques, ainsi que pour ta sympathie et ta gentillesse ; Valérie Dupray, coordinatrice du projet européen que je remercie pour sa patience et sa bienveillance. Merci à Morgane Sanselme et Nicolas Couvrat pour leur aide scientifique au quotidien mais aussi pour leur humour tout feu tout flamme (Bisous à Allan !).
Merci aux autres permanent(e)s du laboratoire, Lucie, pour ta patience devant les personnes allergiques aux tâches administratives ! Merci à Céline (marathonienne !), pour tes conseils en CAP et nos moments ensemble en général, une petite déception de n’avoir jamais fait les TPs avec toi. Marie, merci à toi pour ta gentillesse, même si on m’a dit que tu râlais des fois, moi je ne retiendrai que ta bonne humeur et nos rires !
Merci aux étudiants, les nouveaux arrivés et les « déjà partis » : Benjamin, merci évidemment pour ton aide précieuse au début de cette thèse, mais aussi pour toutes tes qualités, trop nombreuses pour les énumérer, merci pour les conseils, les livres, et les bons moments. Merci à Clément (DSJ) pour ton amitié et ton aide aussi sur la fin de cette thèse, j’espère avoir pu en faire au moins la moitié pour toi en retour. Des Cœurs et des bisous pour toi ! De la même génération, je remercie FX, entre taquinage et démontage de Couette Taylor, Bienvenu pour sa bonne humeur et ces terribles anecdotes et Antoine, pas pour ta bonne humeur ni ta gentillesse, mais pour ton humour sarcastique c’est sûr ! Merci à Simon, Docteur loulou, pour nos discussions en général, même si tu as abandonné ton poste au Technicum ! Une pensée pour tous ceux que je n’ai pas beaucoup vu mais avec qui les conversations étaient toujours culturellement intéressantes, Aliou, Lina et Kangli, je vous souhaite toute la réussite que vous méritez. Je souhaite bon courage aux suivants : Chloé, Laureline, Marine, Aurélien, Florent (peut être !) et Mélodie. N’ayez pas peur, c’est malgré tout une super aventure ! Laureline et Chloé, je compte sur vous pour garder l’esprit féminin du bureau !
En dehors du laboratoire, je remercie profondément Clément et Éléonore, pour votre amitié, pour nos discussions sans fin sur la thèse (promis, les gars c’est finit maintenant ! Enfin…), pour nos soirées, nos vacances, et bref, tout quoi ! Que cela dure. Merci aux copains d’il y a longtemps, Paul, Chris, Pauline, Margot, Agathe, Thomas, aux copines qui sont beaucoup trop loin, Shannon, Sarah, Noëlline, et aux nouveaux, l’équipe de choc, Mélaine, Thomas, Ju, Alex, Cécile, Cora, Flo, peut être au ski l’année prochaine ?
Merci à ma famille, mes parents, Christine et Philippe, et mes frères, Clément, Simon et Antoine. Plus besoin d’essayer de prononcer « deracemization » vous l’aurez assez entendu, et moi aussi !
Enfin, merci à Antoine, mon Loulou, pour ton soutien infaillible pendant 3 ans et même plus. Merci pour ton amour depuis tout ce temps. Vivement la suite.
General Introduction ... 1
State of the Art ... 5
Crystal Genesis ... 6
Crystalline State ... 6
Crystallography ... 8
Principle of Crystallization from Solution ... 9
1. Establishment of the Driving Force: The Supersaturation β ... 9
2. Nucleation ... 11
3. Crystal Growth ... 13
Growth Kinetics ... 13
1. Crystal Habit Prediction ... 14
2. Growth Kinetics in the Presence of Impurities ... 15
3. Ostwald Ripening ... 16 Defects in Crystals ... 16 Chirality ... 18 Definition ... 18 Enantiomer Properties ... 18 1. Physical-Chemical Properties ... 18
2. Biological Properties and API ... 18
3. Heterogeneous Equilibria between Enantiomers ... 19
4. Enantiomeric Excess ... 20
Classification of Chirality ... 21
1. Molecular Chirality due to the Presence of an Asymmetric Center ... 21
2. Diastereomery ... 22
3. Atropisomery ... 22
4. Supramolecular Chirality ... 23
Access to Pure Enantiomers ... 25
1. Stereoselective Synthesis of the Desired Enantiomer ... 25
2. Resolutions of Enantiomers ... 25
Deracemization and Spontaneous Symmetry Breaking ... 27
1. Principle ... 29
2. Mathematical Models ... 29
Temperature Cycling Induced Deracemization ... 30
1. Principle ... 30
2. Mathematical Models ... 31
Other Methods ... 31
References... 33
Synthesis
and
Characterization
of
Sodium
Dithionate and its Dihydrate ... 41
Introduction ... 42
Inorganic Synthesis of Sodium Dithionate, Na2S2O6. ... 42
Solid State Characterization of Sodium Dithionate ... 43
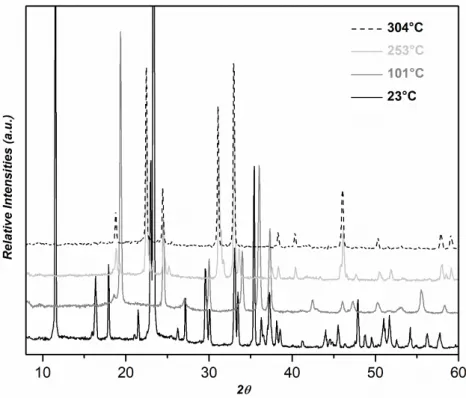
Thermal Analyses ... 43
Relative Stability of Dihydrate and Anhydrous Forms of Na2S2O6 under Relative Humidity ... 47
Structural Role of Water and Mechanism of Dehydration ... 48
Unsolved Anhydrous Na2S2O6 Structure and Unexpected DMSO Solvate .... 50
Conclusion ... 52
References... 54
Influence of Sodium Dithionate on Sodium
Chlorate Deracemization ... 57
Introduction ... 58
Presentation of Sodium Chlorate (NaClO3) ... 59
Chirality of NaClO3 ... 59
Description of the Morphology of NaClO3 Crystals ... 60
1. Equilibrium Morphology of NaClO3 ... 60
2. Morphology of NaClO3 Grown from Solutions Containing Sodium Dithionate (Na2S2O6) ... 61
3. Solubility of NaClO3 in Water ... 64
NaClO3 Deracemization ... 65
Sample Preparations ... 65
Deracemization of NaClO3 by Viedma Ripening ... 66
1. Experimental Conditions ... 66
2. Results ... 67
Temperature Cycling Induced Deracemization (TCID) of NaClO3 ... 69
1. Experimental Conditions ... 69
2. Results ... 71
Comparison of Viedma Ripening and TCID Processes ... 71
Influence of Na2S2O6 on NaClO3 TCID Process ... 72
Deracemization of NaClO3 by Viedma Ripening in the Presence of Na2S2O6 ... 73
TCID of NaClO3 in the Presence of Na2S2O6 ... 74
1. Experimental Conditions ... 74
2. Results ... 74
Further Investigation on the Impact of Na2S2O6 on the Crystallization of NaClO3 ... 76
Influence of Na2S2O6 on the Growth Rate of NaClO3 ... 77
1. Experimental Conditions ... 77
2. Results ... 77
Influence of Na2S2O6 on the Secondary Nucleation of NaClO3 ... 79
1. Experimental Conditions ... 80
2. Results ... 80
Discussion ... 81
Influence of Others Impurities on NaClO3 TCID Process... 82
Sodium Sulfate (Na2SO4) ... 82
1. Experimental Conditions ... 82
2. Results ... 83
Other Sulfur Compounds as Impurity ... 83
Conclusion ... 84
Couette Taylor Reactor ... 91
Introduction ... 92
State of the Art ... 93
History ... 93
Fluid Dynamics in Couette Taylor Reactor ... 94
1. Reynolds and Taylor Numbers ... 94
2. Flow Regimes ... 95
Crystallization and Deracemization in Couette Taylor Reactor... 96
Implementation of Couette Taylor Reactor ... 97
Description of the Reactor ... 97
Technical Issues ... 98
Preliminary Experiments of NaClO3 Deracemization in the CT Reactor ... 99
Sample Preparation ... 99
Experimental Conditions ...100
Results ...101
1. Influence of the Initial Crystal Size ...101
2. Influence of the ∆T and the Ω ...102
Influence of Na2S2O6 on the NaClO3 Deracemization in the CT Reactor ...106
1. Experimental Conditions ...106
2. Results ...106
Discussion ...107
Perspectives ... 112
Optimization of the process in the CT Reactor ...112
1. Inhibition of the Crystal Growth ...112
2. Modification of the Reactor Geometry ...113
Application to Organic Chiral Compounds ...113
Continuous Process ...113
Conclusion ... 114
References... 116
Appendices ... 123
Experimental Part ...124 Supplementary Curves and Tables on Deracemization of NaClO3 via AttritionEnhanced Deracemization and TCID. ...127 Scientific Production ...129
Crystallization is a key operation in the manufacturing and purification of crystallized compounds. Physical chemical properties such as structural purity, crystal size distribution, occurrence of polymorphism, hydrate or solvate, can be significantly impacted and controlled by the crystallization step which includes nucleation, growth and agglomeration mechanisms. Since different crystalline forms (e.g. polymorphs or enantiomorphs) often have different (or opposite) physical chemical properties (such as solubility, thermal stability, bioavailability or bioactivity), it is very important to control the process to afford the desired material with satisfactory attributes.
In the field of pharmaceutical chemistry, crystallization based methods are used to resolve enantiomers when asymmetric synthesis or chiral chromatography are not feasible. Enantiomer resolutions via crystallization, i.e. by means of diastereomeric resolution, preferential crystallization (PC) or deracemization, give access to the pure enantiomer in solid phase. The advantage of deracemization over the other methods is the conversion of the unwanted enantiomer into the desired enantiomer by means of racemization at the solvated state, giving rise to a theoretical yield of 100%.
The deracemization mechanism is still matter of debate and is currently intensively studied using different model compounds under various conditions.
In the present manuscript, research is focused on the study of sodium chlorate (NaClO3)
deracemization. NaClO3 is an achiral compound which exhibits supramolecular chirality,
and which was originally used to prove the feasibility of deracemization. Due to the absence of chirality in the solvated state, racemization is not based on a chemical reaction, which is often a limiting factor in other deracemization processes. It is therefore a good candidate to focus investigations on other mechanisms involved in deracemization, mainly crystallization, dissolution, breakage and agglomeration processes.
Chapter 1 focuses on the necessary generalities concerning chirality and crystallization that are required for a good understanding of this work. The rest of the manuscript is divided in three parts:
Chapter 2 is focused on the synthesis and on the solid state characterization of a crystalline compound: Sodium dithionate (Na2S2O6). This compound attracted our
attention as it can be used as an achiral impurity in NaClO3 deracemization. After
synthesis of the compound, thermal and chemical stability are investigated by means of complementary analyses in order to ensure the absence of reaction under deracemization conditions.
Chapter 3 is devoted to NaClO3 deracemization. Two different processes are studied and
compared: (i) attrition-enhanced deracemization and (ii) temperature cycling-induced deracemization (TCID). The influence of Na2S2O6, as impurity is investigated for the TCID
process and the results provide a better understanding of the mechanisms involved during the deracemization process via specific experiments of crystal growth and secondary nucleation estimates.
Chapter 4 is dedicated to the set-up of a new reactor, a Couette Taylor (CT) reactor, in order to perform NaClO3 deracemization. Indeed, from an industrial perspective,
increasing productivity is challenging. The CT reactor gives the possibility to set a continuous process for deracemization (and/or more generally for other crystallization processes), which could considerably increase the productivity. After the implementation of the reactor, the feasibility of deracemization is investigated, then perspectives for optimization are proposed.
The general concern of this work is to reach a better understanding of the deracemization process, particularly for the TCID process. A general conclusion gathers results, proposes a general mechanism of deracemization for the TCID process and summarizes hopeful perspectives for the process in a CT reactor.
State of the Art
Crystal Genesis
Crystalline State
There are three common states of matter: gas, liquid and solid. In the solid state, the constituents (molecules, atoms and/or ions) are close packed. According to their degrees of order, two kind of solids can be described.1 In the crystalline state, the constituents are
organized in a periodic array, i.e. a three dimensional and strict arrangement. The resulting macroscopic particle is called a crystal and presents a long range order (Figure I-1-a). By contrast, in the amorphous state, the solid presents only a short range order comparable to the arrangement found in the liquid state (Figure I-1-b).
Figure I-1: Schematic organization of (a) a crystal with a regular arrangement of atoms, i.e. a long range order and (b) an amorphous solid characterized by a short range order.
According to the interactions occurring between the constituents (covalent, metallic, ionic or hydrogen bonds), crystals are classified in different groups: ionic crystals, covalent crystals or molecular crystals.
A chemical compound able to form different crystalline structures presents polymorphism, from the Greek words ‘poly’ and ‘morph’ meaning ‘several’ and ‘shape’ respectively. Each form, i.e. each polymorph of this compound, has different physico-chemical properties (melting point, solubility,...etc) due to the difference in crystal packing (Figure I-2).2,3
Figure I-2 : Schematic representation of two different crystalline structures of the same compound. Each crystalline structure is a polymorph, named here (a) polymorph I and (b) polymorph II.
When two compounds A and B are involved, miscibility in the solid state exists when compound A is able to accept compound B in its crystal structure. This is possible if only a small change in the crystal packing of A is involved. Two miscible solids form a solid solution. According to the organization of pure A and pure B, two kinds of solid solutions can be described: (i) solid solutions by insertion (Figure I-3-a), where B particles occupy the interstitial sites of the A structure, and (ii) solid solutions by substitution (Figure I-3-b) where B particles replace A particles at random, possibly giving rise to a complete solid solution between A and B. This kind of solid solution suggests that the crystalline structures of the pure components A and B are similar.4
Figure I-3 : Schematic representation of a solid solution (a) by insertion or (b) by substitution.
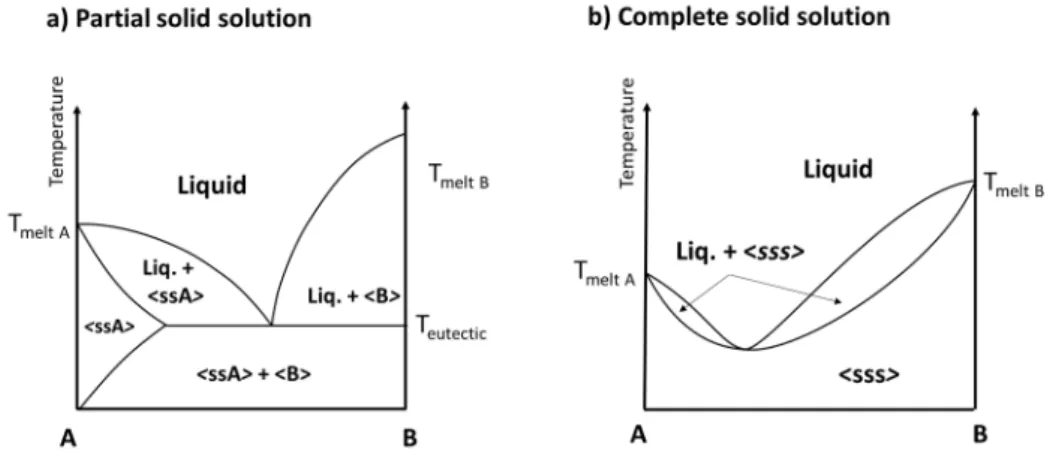
Partial solid solutions and complete solid solutions give rise to specific phase equilibria represented in Figure I-4-a and Figure I-4-b respectively.
Figure I-4 : Phase diagrams between compounds A and B with a) Partial solid solution of A and b) formation of a complete solid solution between A and B.
By contrast, two compounds A and B can also form a new crystalline architecture that differs from their initial crystal structures (Figure I-5). This new compound AB (provided an equimolar ratio of A and B is involved) is called either a co-crystal, a stoichiometric compound or a defined compound. In the particular case where one of the components is a solvent, i.e. in liquid state at room temperature (T) and atmospheric pressure (P), the
co-crystal is named a hydrate.5,6 Salts are specific co-crystals where the packing is maintained
by ionic bonds and proton transfer, as opposed to strong hydrogen bonds or Van Der Walls interactions found in common co-crystals.7
Figure I-5 : Schematic representation of two different crystals from two different compounds (a) A and (b) B forming (c) a new crystalline structure AB. This new crystal form AB is called a co-crystal or a solvate according to the state at which one of the co former (e.g. B) exists under ambient conditions. Additionally, if B is water, AB is called a hydrate.
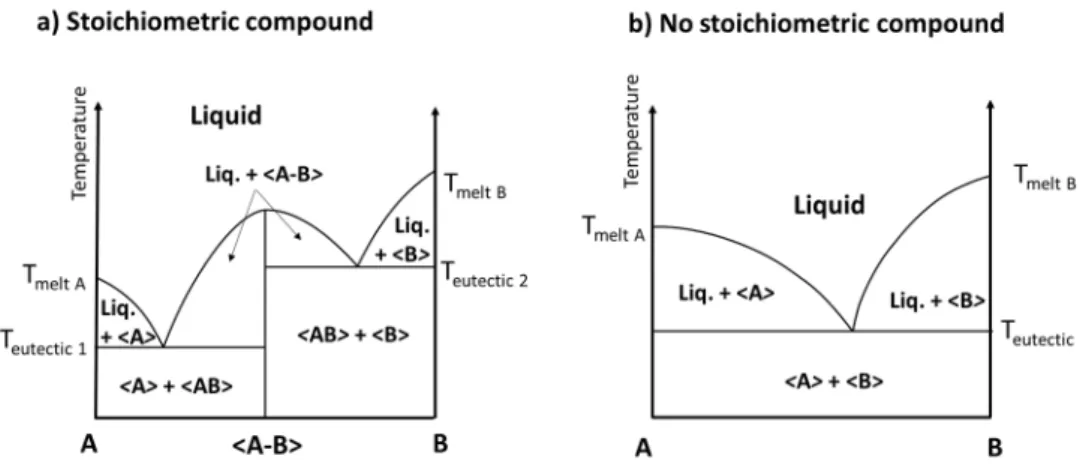
Phase equilibria in the case of stoichiometric compound formations are represented in Figure I-6-a. In addition to the situations described in Figure I-3 and I-4, it is also possible that no interactions occur between A and B: there is absence of solid state miscibility (Figure I-6-b).
Figure I-6 : Phase diagrams between A and B a) with a stoichiometric compound AB and b) without formation of a stoichiometric compound.
Crystallography
Crystallography is the science describing the packing of the matter in a crystal. The periodicity in all possible crystalline structures is described by the 230 space groups (SG). They are the combination of one of the 14 Bravais lattices with one of the 32 point groups. Although it should be noted that all possible combinations of the 14 Bravais lattices and the 32 point groups should be 448 space groups (32×14), but as some SG are isomorphic,
the number of distinct SG is actually reduced to 230.8 Among the 230 SG, three different
classes are described as a function of the chirality and the centrosymmetry of the SG:9
- 92 SG are centrosymmetric and achiral: They present an inversion center as a symmetry element and are then compatible with a racemic mixture of enantiomers. - 65 SG are non-centrosymmetric and can contain chiral structures. Among them, 22 SG are chiral SG (11 enantiomorphic pairs). According to the Sohncke classification, those 65 SG contain only first class symmetry elements, such as rotation, translation or screw axis, which preserve the orientation and the handedness of the symmetry unit. Necessarily, pure enantiomers (see below) crystallize in one of these 65 non-centrosymmetric Sohncke types SG.
- 73 SG are non-centrosymmetric but achiral: Even though they do not present inversion centers, they remain compatible with a mixture of enantiomers by means of glide mirrors or inverted axes.
Principle of Crystallization from Solution
Crystal genesis is the study of crystal formation, that is to say the process of crystallization. It is about how a crystalline long range order emerges from a less ordered medium (amorphous solid, liquid, gas state or dissolved compound in a solvent). Crystallization proceeds in three steps: (i) first a driving force must be established, (ii) then formation of nuclei up to a suitable size and (iii) growth of nuclei, i.e. crystal growth.
In the present manuscript, almost every crystallization was performed from solutions.
1. Establishment of the Driving Force: The Supersaturation β
The amount of a component dissolved in a solvent is expressed by the concentration C, i.e. the mass (or the number of moles) of the component dissolved per weight (or volume) unit of the solvent. At a given temperature and pressure, the concentration of a given component in a given solvent has a limit: the solubility, C*.
The solubility is the maximal amount of compound which can be dissolved per weight (or volume) unit of the solvent, at fixed T and P (Figure I-7- solid line). However, this limit can be overcome in particular conditions (see below). Then, the system is supersaturated, and supersaturation is the driving force for solution crystallization. β is the ratio of supersaturation and is defined (Equation I-1 ) as the ratio of the concentration C by C*.
∗
Equation I-1
When:
• β < 1, the system is undersaturated • β = 1, the system is saturated • β > 1, the system is supersaturated.
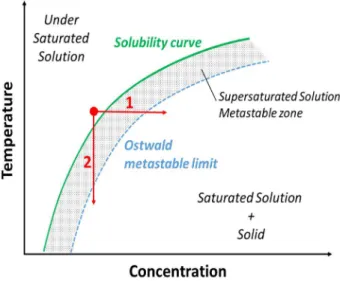
A supersaturated solution is in a metastable state which can be achieved either by increasing the concentration, e.g. by solvent evaporation (Figure I-7-1), or by decreasing C*, e.g. by cooling or the addition of an anti-solvent (Figure I-7-2).10 Crystallization of the
excess amount in the liquid phase restores the stable equilibrium state. However, for low supersaturation, i.e. β slightly superior to 1, the driving force is sometimes not sufficient to induce spontaneous crystallization and the system can stay in this metastable state, until a certain limit of β. This limit has been described by Ostwald in 1897 and is now called the Ostwald limit (dashed line in Figure I-7).11 Therefore, the metastable domain is
defined by the metastable zone width (MSZW) between the solubility curve and the Ostwald limit (represented in grey in Figure I-7). In this domain, spontaneous crystallization is unlikely.12 Therefore, the higher β, the more uncontrolled the
crystallization.
Figure I-7: Solubility curve (green solid line) of a compound in solution and Ostwald limit (blue dashed line). Crystallization is triggered (1) by an increase of the concentration, that is to say, by solvent evaporation or (2) by a decrease of the solubility, that is to say, by a decrease of the temperature.
2. Nucleation
Nucleation is the second step towards crystallization. Two kinds of nucleation, primary or secondary, are described according to the origin of the formation of the nuclei.13
• Primary nucleation
Primary nucleation is the formation of nuclei from a solution where no crystalline particle of the solute compound is present. In a supersaturated solution, solvated particles tend to aggregate by forming bonds. The aggregates can either redissolve or grow further into nuclei. When such aggregation occurs without the assistance of a foreign substance (e.g. crystallizer sides, impurities…), this is homogeneous nucleation.14 The free enthalpy of
nucleation, ∆Gnucleation accounts for the free energy of the nucleus.Two opposite energetic
contributions are involved in ∆Gnucleation: (i) the Gibbs free energy associated with
crystallization, ∆gυ of the system, is a negative contribution, proportional to the nuclei
volume and due to the decrease of free enthalpy (exothermicity of the nucleation) and of entropy (there is an increase of order upon aggregation) and (ii) a positive contribution due to the creation of a solid-liquid interface, therefore proportional to the nuclei surface and to the surface free energy γ (per unit area of the nucleus). Then, ∆Gnucleation is defined
as Equation I-2.13
∆ −43 ∆ ʋ+ 4 Equation I-2
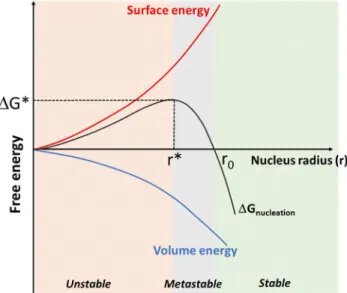
The evolution of ∆Gnucleation is schematically plotted in Figure I-8. The nucleus has to reach
a critical size (r*) to be able to grow. Below r*, the contribution of the surface energy dominates, ∆Gnucleation is positive, the nucleus is unstable and the growth is unfavorable.
When the nucleus size reaches r*, i.e. ∆Gnucleation reaches the highest value, ∆G*, the growth
of the nucleus is favorable as ∆Gnucleation will decrease. However, for r* < r < r0, ∆Gnucleation
is still positive, thus, nucleus is thermodynamically metastable and kinetically stable as the re-dissolution of the nucleus would increase ∆Gnucleation. Afterwards, for r > r0, ∆Gnucleation
Figure I-8 : Schematic representation of the evolution of the nucleation free enthalpy ∆Gnucleation
versus the nucleus radius (r) (black curve). The negative contribution linked to the volume energy and the positive contribution due to the surface energy are represented by blue and red curves respectively. Unstable, metastable and stable domains are colored in orange, grey and green respectively.
However, homogeneous nucleation is rare and is generally admitted at very high supersaturation. In most cases, primary nucleation is heterogeneous,14,15 that is to say that
aggregation occurs with the assistance of tiny foreign particles such as dust, or on an interface such as the wall of the reactor, the edges of stirrer, etc…. In the case of heterogeneous nucleation, ∆G* is lower than in homogeneous nucleation.
• Secondary nucleation
By contrast, in the case of secondary nucleation, nuclei form from existing crystals.16,17
Different mechanisms have been proposed to describe secondary nucleation:18 (i) fluid
shear nucleation,19,20 i.e. the shear forces applied by the solution to the crystal surfaces
could be sufficient to detach minute amounts of crystalline matter that would in turn act as secondary nucleation sites, (ii) contact nucleation, i.e. minute amounts of crystalline matter are liberated by crystals scratching each other or against the reactor walls (or the stirrer), and act as support for the nucleation.17 Since the energy required for secondary
nucleation is much lower than for primary nucleation, secondary nucleation is favored over primary nucleation at low supersaturation.16
• Seeding
Seeding consists of the voluntary addition of a small amount of crystals (usually as a powder) to a supersaturated solution in order to trigger its crystallization. This method ensures control of the nucleation and crystallization. By seeding a solution with suitable
seeds, it is possible to control the crystal form or the polymorph produced during the process. Moreover, seeding significantly reduces the induction time for crystallization.21
3. Crystal Growth
The third step towards crystal formation is crystal growth, the process by which a nucleus grows to become a crystal. As soon as the energy barrier ∆G* is overcome, the nucleus grows by surface adsorption of the particles available in the solution, i.e. the growth units. The solution supplies those particles until it is back to its saturation concentration.
Two different mechanisms were described for the adsorption of the growth units at the crystal solution interface:
• Two dimensional nucleation:22 For a perfect crystal, i.e. without defects at the
surface, there is no preferential adsorption sites at the growing crystal surfaces, the growth units mature together and form a two-dimensional nucleus at the crystal-solution interface, which grow in two dimensions, thus expanding the crystal. This mechanism is expected at high supersaturations.
• Spiral growth:23,24 At lower supersaturation, crystal growth occurs via a screw
dislocation (detailed in part I.E.) emerging from the crystal surface. This defect offers a preferential adsorption zone where the growth units can dock on. The adsorption of the growth units follows the dislocation which might result in the appearance of a spiral at the crystal surface.
Growth Kinetics
The rate of adsorption of the growth units at the crystal interface depends on intrinsic factors, such as the crystalline structure, the nature of the bonds, the presence of crystal defects, as well as on external factors related to experimental conditions such as the supersaturation (the higher the supersaturation, the faster the crystal growth, due to the higher probability of collisions between crystals and free particles), the temperature, the solvent or the presence of impurities. These factors directly influence the adsorption rate, i.e. the crystal growth rate. Also, due to these factors, crystal growth is not isotropic, which leads to a specific morphology of the final crystal via the appearance of faces. The growth rate of each crystal face (i.e., facial growth rate) is decisive for the morphology, as the slower the growth rate, the more visible is the face in the final morphology (Figure I-9).
Figure I-9 : From the left to the right, schematic representation of a crystal growth. Red faces grow faster (larger red arrows) than blue ones. The blue faces are prominent one the final habit.
The Kossel model describes three kinds of crystal surfaces offering adsorption sites for growth units: (i) Kinked surfaces (K faces) with the highest number of adsorption sites, (ii) Stepped surfaces (S faces) and (iii) Flat surfaces (F faces) with lesser probability of adsorption (Figure I-10).25
Figure I-10 : Schematic representation of the Kossel Model with kinked faces (K), stepped faces (S) and flat faces (F).
Face growth rates can be estimated by monitoring the development of a face along its normal direction for instance using a microscope. When the crystal growth becomes uncontrolled, e.g. in the case of very high supersaturation, the crystal surface becomes more and more rough. This phenomenon is called the roughening transition.26
1. Crystal Habit Prediction
Different mathematical models have been developed to predict crystal morphologies.27 The
first one is the Bravais Friedel Donnay Harker (BFDH) model, which is mainly focused on the geometry of the structure (intrinsic factors) to determine the crystal habit and relative growth rates of faces. The BFDH method assumes that the face growth is due to the addition of a molecular layer and that the face growth rate is proportional to 1/d(hkl) where
d(hkl) is the distance between molecular layer. The thinner this layer, the faster the face
growth because the addition of a molecular layer is easier and faster. In many cases, good approximations of crystal habits and identification of the most important faces formed
during growth can be predicted by using the BFDH model. However, as there are no energetic considerations, the stronger the bonds in the crystal state, the less accurate the method.
The Attachment Energy method28 is more accurate than the BFDH method as such
energetic considerations are included. The attachment energy, Eatt is defined as the energy
released when a slice of thickness dhkl is added to the (hkl) face of the growing crystal. Eatt
is the energy of the slice attachment (Eslice) withdrawn from the energy of the lattice
(Elattice) (Equation I-3). The lower Eatt, the slower the face growth rate.
Eatt = Elattice – Eslice Equation I-3
The Hartman-Perdok method relies on the Periodic Bond Chains (PBCs) theory. It states that a crystal is more stable when a constituting unit can form long uninterrupted periodic chains. PBCs are constructed by means of a strong crystal bonds. A two-dimensional connected net is created by the intersection of non-parallel PBCs and constitute a stable face. According to the dimension of the PBCs formation, 0, 1 or 2 for two-dimensional nets correspond to K, S, and F faces respectively (Figure I-10). The higher the dimension of the PBCs formation, the more stable the corresponding face is and the slower its growth.29
Then, F faces are the most visible whereas K faces are the least represented ones in the final habit of the crystal.
2. Growth Kinetics in the Presence of Impurities
As the face growth rate depends on the interaction with the environment, i.e. the solution, the presence of other compounds may change these interactions and modify the growth rate, the morphology and the crystal size distribution.
First, the presence of an impurity can change the interfacial energy, i.e. the affinity between the solute and the solvent. It may result in a solubility increase (or decrease) and possibly an increase of the metastable zone width defined by the Ostwald limit (Figure I-7).30–32
The kinetics of the system could also be changed by a modification of the crystal growth rate. Indeed, adsorption of impurities at the crystal surface can block the growth sites which are no longer available for the growth unit. According to the impurity concentration and to the adsorption rate, the crystal growth can be slowed down or even stopped.33
adsorption, where additives are progressively included in the crystalline structure and can form a solid solution.
The affinity between impurity and solute, most often due to geometric similarities, along specific faces impacts their relative growth rate and, further, the whole crystal growth (Figure I-11) The resulting habit can therefore be considerably changed.
Figure I-11 : Schematic representation of impurity adsorption on the crystal surface. The crystal growth is impacted by the impurity alongside specific directions. Face growth not impacted and face growth hindered by the impurity are represented by solid arrows and dashed arrows, respectively.
Using this phenomenon, morphology or size can be controlled by the suitable use of a tailor-made impurity, called additives in this context.34–36
3. Ostwald Ripening
By means of the dissolution – crystallization dynamic equilibrium occurring between the crystal and the saturated solution as well as diffusion, the crystals in a saturated solution undergo a ripening phenomenon where the smaller crystals are dissolved in favor of the growth of the larger ones. This is related to the Gibbs-Thomson effect which states that small particles have a higher solubility than large ones. Indeed, in order to minimize interfacial energy, smaller crystals are dissolved in the favor of the growth of larger crystals.37,38 This phenomenon is called Ostwald ripening.39 Ostwald ripening can also
occur in dry conditions when two crystals are put in contact, although it is far less effective.
Defects in Crystals
During crystal growth, stacking faults may occur leading to defects and irregularities in the crystalline structure. Actually, a perfect single crystal almost does not exist and crystal defects are always present in a real crystal. The different types of defects are described according to their dimension.
Point defects (0D): These types of defects have the dimension of the crystal constituents. It could be a “vacancy”, where a growth unit is missing in the crystal structure.40 In
contrast, a “self-interstitial” is an additional constituent occupying an interstitial site of the crystalline structure.40 The deformation of the structure and the associated energy
caused by self-interstitial defects is more important than a vacancy, which makes them rare, especially in molecular crystals. Another type of point defect is the substitution of an atom, molecule or ion by a foreign substance, considered as an impurity. Such defects give rise to a solid solution.41
Linear defects (1D):42 Linear defects could be either “edge dislocations” or “screw
dislocations”. Concerning edge dislocations, a part of a crystallographic plane is missing. The neighboring crystallographic planes loosen up to fill the space where the plane is missing. For screw dislocations, the dislocations shift the crystallographic plane perpendicular to the direction of the plane. Screw dislocations can initiate the spiral growth mechanism.
Surface defects (2D): These defects occurs at the surface of a crystal. The main surface defects are grain boundaries, stacking faults and twinning.
- Grain boundaries are the result of more or less important misorientation between two (or more) crystal sections, i.e. grains. Grains are linked by grain boundaries at which some particles belong to both grains. The lower the misorientation, the more particles are shared between the grains.43 When the coherence between the
different grains is high over the whole volume of the crystal, the term “crystal mosaicity” is sometimes used.
- Stacking faults are disruptions in the crystalline structure along molecular or atomic planes where the normal order of succession into atomic planes is not respected.44
- A specific case is that of twin crystals, which are ‘a symmetrical reorientation of parts or of a crystal as a whole.’45 Two grains of the twin crystal share a common
reticular plane and the symmetry of the packing is respected all along the twinning plane.46
Inclusions (3D): During crystal growth, entrapment of macroscopic amounts of a foreign substance can occur. This foreign substance can be either gaseous matter or supersaturated solution (inclusions). The properties of the crystal is obviously affected by these inclusions.47
Chirality
Definition
From the Greek word ‘kheir’, meaning hands, chirality is the particular ability of one object to exist in two opposite configurations, mirror image related, such as our hands. Molecules, or arrangements of molecules, presenting two mirror image related configurations are known as chiral and each configuration is an enantiomer.48
Enantiomer Properties
1. Physical-Chemical Properties
Two enantiomers have the same scalar properties such as melting point, density, solubility (in achiral media), ability to present polymorphism, refractive index, spectra (IR, X-Ray, RMN…).49
However, they have different vector properties, not in terms of magnitude, but in terms of sign. Indeed, their optical properties, notably the optical rotation of polarized light are strictly opposite. One enantiomer deviates the plane of polarized light to the right (clockwise), it is dextrogyre, noted d or (+). The counter enantiomer deviates the plan of polarized light, with the same deviation degree, to the left (anti-clockwise) and is levogyre, noted l or (-). Thus, based on the deviation of the plane of polarized light, the polarimetric methods, circular dichroism or polarized light microscopy, are good methods to distinguish enantiomers and to determine the proportions of each of them in a system.49
2. Biological Properties and API
The building blocks of biological organisms, i.e. all living things (made of proteins, sugars, amino acids…), are chiral. This makes them particularly sensitive to stereochemistry, as interactions between chiral compounds and chiral receptors are different according to the concerned enantiomer (Figure I-12).50 Thus, the biological properties of two opposite
Figure I-12 : Schematic representation of the interaction between a chiral biological receptor (Biological target) and a chiral compound (enantiomers 1 and 2). The enantiomer 1 is compatible with the biological target, it is the eutomer (right), while the enantiomer 2 is not suitable, it is the distomer (left).
In this context, the Food and Drug Administration (FDA, USA) and authorities in Europe, China and Japan require the use of the active compound alone, i.e. the active enantiomer (also called the eutomer, designated as the desired enantiomer) for the commercialization of the active pharmaceutical ingredient (API)51,52 since the counter enantiomer (the
unwanted enantiomer, called the distomer) could be inactive or toxic.53 Therefore, the
distomer is now considered as an impurity and has to be eliminated.
3. Heterogeneous Equilibria between Enantiomers
Crystallization of a system composed of two enantiomers can lead to three main types of equilibria.54
• Racemic compound (Figure I-13-a): In most cases (90-95%), crystallization of the two enantiomers results in a racemic compound, also named a racemate. This stoichiometric compound is made of the two enantiomers in equal proportions and presents a crystalline structure different from the crystalline structure of the pure enantiomer.
The term racemic composition should be differentiated from the term racemic compound. Racemic composition corresponds to 50% of both enantiomers, whatever the crystallographic configuration.
• Conglomerate (Figure I-13-b): In 5-10% of cases, both enantiomers do not crystallize together. Crystallization leads to a physical mixture of both enantiomers.
• Solid solution: If partial or total miscibility in the solid state between enantiomers is possible, then they form a solid solution by substitution, partial (Figure I-13-c) or complete (Figure I-13-d).
Figure I-13 : Schematic representation of three main cases encountered in heterogeneous equilibria between enantiomers: a) the formation of a racemic compound (<l-d>), b) the conglomerate forming system, c) the formation of partial solid solutions (<ssl> and <ssd>) and d) the complete solid solution by substitution (sss) between enantiomers. The schematic crystals present at the racemic composition are represented below each case.
In the present work, the system investigated crystallizes as a conglomerate of enantiopure particles, although the situation is complexified by the loss of chirality in the liquid state or in solution (see below in Section C-4)
4. Enantiomeric Excess
The quantification of both enantiomers in a system is commonly described by the enantiomeric excess (ee). This value determines the percent deviation from the racemic
mixture, for which the ee equals 0 %. Thus, the ee determines the absolute difference between the proportions of enantiomers, following Equation I-4, where nd and nl are the
amount (in mol or mass) of d-crystals and l-crystals respectively. No sign is included in this equation, and the predominant enantiomer has to be identified. In order to avoid confusion, a sign of ee can be determined, following the modified Equation I-5. Using this equation, a positive ee means that d-enantiomer predominates and conversely.55
% | −+ !| ! ∗ 100 Equation I-4 % −+ ! ! ∗ 100 Equation I-5
In the case of a solid sample, the crystal enantiomeric excess (CEE) is determined with nd
and nl correspond to the mass or the number of d-crystals and l-crystals respectively
(Equation I-6).
$$ % %&'%(
%&)%(∗ 100
Equation I-6
Classification of Chirality
Chirality in chemistry materializes differently. It could be directly related to the intrinsic molecular structure (configurational or conformational chirality)56 or to the packing of
several molecules.
1. Molecular Chirality due to the Presence of an Asymmetric Center The most common type of chirality described in undergraduate textbooks is the chirality induced by the presence of a stereogenic atom in the molecule, and even more commonly a stereogenic carbon which has four different substituents. Two arrangements of the four different substituents are possible: these are the two opposite configurations of the two enantiomers of the molecule (Figure I-14). The chirality is said to be “configurational”, as a covalent bond between the chiral center and one of the four constituent has to be broken to obtain the second enantiomer.56
Figure I-14 : Both enantiomers of a chiral molecule with a stereogenic carbon bonded to four different substituents.
Different notations are used to label each enantiomer. Enantiomers can be labelled either R (rectus) and S (sinister) according to the Cahn, Ingold and Prelog priority rules, or L and D (commonly used for amino acids), according to the Fisher projection’s rule. L and D are not related to the levogyre / dextrogyre character of the molecule.57 l and d (in lowercase)
(or (-)/(+)), is the only notation related to the optical deviation of the polarized light.
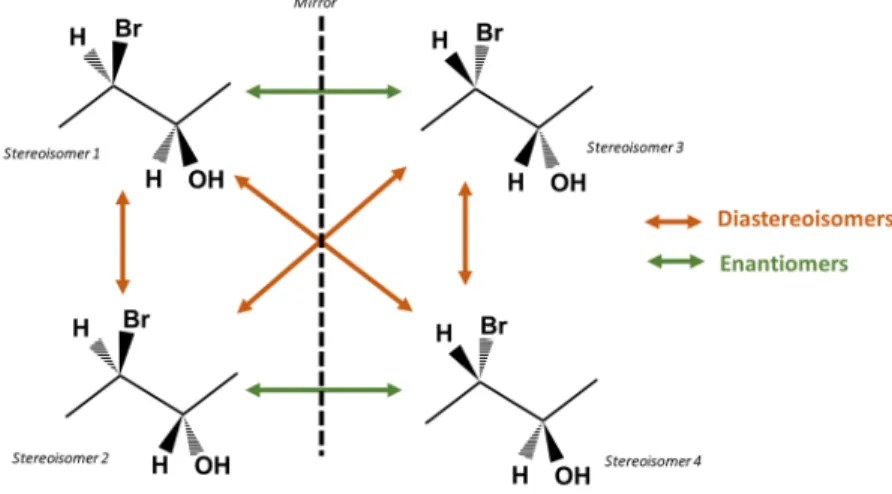
2. Diastereomery
When the molecule has more than one stereogenic center, the number of possible configurations, i.e. the number of stereoisomers is 2n, with n, being the number of
stereogenic centers. Stereoisomers with exactly opposed stereogenic centers are enantiomers, other configurations are diastereomers (Figure I-15).56
Figure I-15 : Relation between four stereoisomers of a molecule with two stereogenic centers.
3. Atropisomery
Atropisomerism was discovered in 1922 by Christie and Kenner.58 These authors described
the ‘optical activity due to axial chirality’, and later on the term of “atropisomer” was coined by Kuhn in 1933.59 Atropisomers are planar molecules whose conformation is
hindered by the absence of free rotation around a single bond.48 The interconversion from
one to the second atropisomer does not require a chemical reaction, i.e no breakage of chemical bonds, a suitable energy flux such as temperature, can be sufficient to change the conformation of the molecule (Figure I-16).
Figure I-16 : Atropisomers of 6,6’-dinitro-2,2’-dicarboxybiphenyl
4.
S
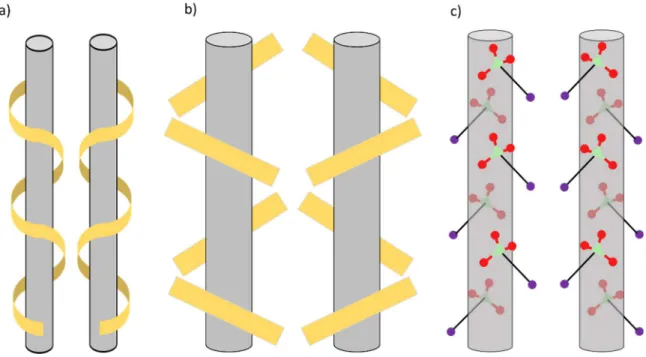
upramolecular ChiralityAchiral compounds, i.e. optically inactive compounds, can actually crystallize in one of the 65 chiral space groups. While these compounds are fully optically inactive in the liquid or dissolved state, their crystallization leads to optically active crystals, i.e. chiral crystals. For instance, helical assemblies of achiral groups of molecules can afford chirality by means of clockwise or anticlockwise rotations. A good example of supramolecular chirality is quartz (SiO2). Indeed, β-quartz crystallizes either in the P6421 or P6221 SG depending
on the handedness of the molecular arrangement around the 6-fold axis. The same holds for the low temperature form, α-quartz, which crystallizes either in the P3221 or P3121
SG. Two opposite enantiomorphs are therefore described for each polymorph.60,61 While
the difference between 62 and 64 or between 31 and 32 screw axes is easy to grasp, it is
harder to recognize that a clockwise or anticlockwise rotation around a 21 screw axis can
also give rise to a chiral supramolecular arrangement (Figure I-17-a)-b))62,63 In this
context, the supramolecular chirality occurring in the crystalline state for sodium chlorate (NaClO3), which crystallizes in P213, has been well known since the work of Kipping and
Figure I-17 : Schematic representation of chirality generation via 21 assemblies of a) helix, b) bars
and c) sodium chlorate crystal structure.
To distinguish each supramolecular enantiomer it is necessary to perform the analyses in the solid state, as the chirality is entirely lost in the liquid or solvated state (Figure I-18). Different methods are feasible for the characterization of solid state chirality such as X-ray single crystal analysis, careful observation of the morphology of the crystals (two macroscopic single crystals of two opposite enantiomorphs are mirror image related), circular dichroism (of a KBr pellet or Nujol mull) or polarized light microscopy (each enantiomorph will behave differently).65
Figure I-18 : Degenerated binary phase diagram of achiral compounds forming chiral crystals. Due to the absence of chirality at the liquid state, dashed areas are not accessible.
Access to Pure Enantiomers
1. Stereoselective Synthesis of the Desired Enantiomer
• Chiral pool synthesis:66 Synthesis of a chiral compound using readily available
chiral building blocks from a well-known set of natural chiral substances (the chiral pool), such as amino acids or sugars.
• Asymmetric synthesis:67 Starting from an achiral precursor, the synthesis is
enantioselective by means of a chiral environment, such as a chiral auxiliary or chiral catalyst, which is able to control the stereogenic center in the desired product.
When stereoselective synthesis is not possible, the synthesis is non-stereoselective and gives rise to a racemic mixture from which the enantiomers have to be resolved, i.e. separated.
2. Resolutions of Enantiomers
Resolution is the separation of enantiomers from a racemic or enantio-enriched mixture. For this purpose, several methods can be envisaged.
• Chiral chromatography
Chiral chromatography was first used as an analytical method and then developed as a preparative method. The two enantiomers interact differently with the chiral stationary phase so that their retention times are different. Thus, enantiomers are separated at the end of the chromatographic column.68
Alternatively, many resolution methods based on crystallization were developed, such as Pasteurian Resolution, Preferential Crystallization, Second Order Asymmetric Transformation, Preferential Enrichment and Deracemization.
• Pasteurian resolution
This method relies on the different physical-chemical properties between two diastereomers. By the addition of an enantiopure reagent, the two enantiomers form two different diastereomers.64,69 As they have different physical-chemical properties, and
particularly a different solubility, they can be easily separated by a selective crystallization step. Diastereomers have to be transformed back into the enantiomers,
usually by a salting out procedure. While the yield is never 100%, this method is reliable and workable either at the laboratory as well as at the industrial scale.
• Preferential crystallization (PC)
Efficiency of the preferential crystallization (PC) method relies on chiral discrimination in the solid state. The prerequisite for the establishment of PC is the presence of a stable conglomerate between the two enantiomers. Racemic compound or complete solid solution type systems are therefore excluded, but partial solid solutions and metastable conglomerates might be acceptable. This method relies on the kinetic stereoselective crystallization of one enantiomer from a supersaturated solution, triggered by suitable seeding.70,71 The enantiomer in excess crystallizes by entrainment and is collected. Three
different methods were described based on this process: Seeded Isothermal Preferential Crystallization (SIPC),70,72 Seeded Polythermal Programmed Preferential Crystallization
(S3PC)72 and Auto-Seeded Polythermal Programmed Preferential Crystallization
(AS3PC).73
The limit of PC is the yield; the theoretical maximum yield cannot exceed 50 % since, particularly in the context of the API production, the counter enantiomer is defined as an impurity and is not converted into the desired one. To tackle this problem, racemization in solution was considered in order to improve PC, which leads to the second-order asymmetric transformation.
• Second-Order Asymmetric Transformation (SOAT)74
Resolution by SOAT combines PC and racemization in solution, i.e. the interconversion between enantiomers during the process.71 During the crystallization of one enantiomer,
the counter enantiomer, in excess in solution, is converted into the desired one. Since the enantiomeric excess in solution is continuously reset to 0 % by racemization, SOAT does not rely on a kinetic state which avoids the crystallization of the counter enantiomer. SOAT was described by Jamison et al.75 for diastereomers and recently described for
atropisomers by Oketani et al..76 By means of racemization in the liquid phase, the yield
can be increased up to 100 % ee in the solid phase. • Preferential enrichment (PE)77
In the PE process, the liquid phase will be highly enriched during crystallization, while the deposited crystals will remain close to the racemic composition, conversely to other methods.78,79 It can be described as the opposite process of PC.78 From a highly
and requires a non-stoichiometric racemic compound, i.e a partial solid solution. A stereo oriented exchange occurs between the deposited crystals and the mother liquor, giving a high ee in the mother liquor and a slight ee of the counter enantiomer in the deposited crystals.80
• Deracemization
Deracemization is another process enabling access to 100 %ee in the solid phase. This method is detailed in the next section.
Deracemization
and
Spontaneous
Symmetry
Breaking
As for SOAT, deracemization combines racemization in solution and auto-amplification of slight enantiomeric imbalances in the solid phase. A pure enantiomer is collected in the solid phase and the composition of the liquid phase remains racemic by means of racemization. The significant difference with other crystallization methods is the presence of a racemic mixture of crystals in contact with a saturated solution at the beginning of the process.
Deracemization is only applicable to conglomerate forming systems and requires relatively fast racemization in solution. Racemization of chiral compounds can be performed by a chemical reaction (e.g. using a strong base) but can also be due to the achiral nature of the compound in case of supramolecular chirality.81,82
Discovery of Spontaneous Symmetry Breaking in a
Suspension
In 1954, Havinga81 highlighted the possibility to perform symmetry breaking of chiral
systems by crystallization, provided three required conditions are met: (i) no racemic compound formation between both enantiomers, (ii) the substance must be racemized in solution and (iii) crystal growth is faster than the formation of crystal nuclei.
In 1990 (one century after the description of the enantiomorphism of NaClO3 by Kipping
and Pope)64, Kondepudi et al showed the possible stereoselectivity of the crystallization of
explain this phenomenon:84–86 In this theory, the chirality of the first crystal appearing in
the solution, i.e. the mother crystal, guides the chirality of all other crystals, i.e. daughter crystals. Kondepudi et al. and Martin et al. highlighted the importance of the stirring to enhance secondary nucleation for total symmetry breaking.87,88 However, if the
crystallization is performed in stagnant conditions, the occurrence of both enantiomorphs at the end of the process results from multiple nucleation events. NaClO3 fulfills Havinga’s
condition: (i) there is no racemic compound or solid solution formation, (ii) NaClO3 is
instantaneously racemized in solution as there is no chirality in the liquid state and (iii) secondary nucleation is favored over primary nucleation by means of low supersaturation.
Later, Viedma showed that concerning crystallization of NaClO3 from highly
supersaturated solution, the appearance of the mother crystal is not sufficient to decrease the supersaturation and cannot avoid primary nucleation elsewhere in the medium. These experiments resulted in racemic mixtures, due to uncontrolled primary nucleation in the process. However, he observed that if the obtained racemic suspensions are left two days under stirring, then the deposited crystals systematically become fully enantiopure. Therefore, the theory of the mother crystal was reconsidered.89
From these observation, Viedma performed experiments from racemic suspensions, i.e. crystals in equilibrium with saturated solution, of NaClO3 in water and showed the fast
(i.e., <12h) total symmetry breaking when stirred in the presence of glass beads.90 This
experiment definitely invalidated the theory of the mother crystal as crystals of both chiralities were present at the beginning of the experiment. Then, total symmetry breaking occurs via matter exchange between crystals and the saturated solution. From there, deracemization was developed as a preparative process.
Attrition Enhanced Deracemization, Viedma Ripening
After Viedma’s discovery of NaClO3 total symmetry breaking upon grinding the
suspension, the technique of deracemization by attrition, i.e. attrition-enhanced deracemization, now called Viedma ripening,91 has been successfully applied to many
chiral organic compounds,82,92 including stereoisomers93 and atropisomers,94 and to other
1. Principle
From racemic crystals in equilibrium with their saturated solution, matter exchanges between liquid and solid phases at the steady state are continuous. Spontaneous symmetry breaking occurs randomly due to local fluctuations of the ee or of the crystal size distribution (CSD) between enantiomers.91 Total symmetry breaking occurs via an
auto-catalytic amplification of these slight stochastic imbalances towards an enantiopure end state. Ostwald ripening and attrition are interdependent factors favoring total symmetry breaking (Figure I-19). As a result of the Gibbs Thomson effect,97 Ostwald ripening leads
to dissolution of smaller crystals in favor of the growth of the larger ones. Thus, from a CSD difference between enantiomers, small crystals (schematically represented as blue crystals in Figure I-19) are dissolved, racemized at the solvated state and recrystallized as bigger crystals (schematically represented as red crystals in Figure I-19). Attrition ensures continuous production of smaller crystals feeding Ostwald ripening and chiral clusters which are re-incorporated stereo-specifically in bulk crystals. Indeed, attrition and Ostwald ripening ensure a continuous crystal recycling towards total deracemization.90,98
Figure I-19: Schematic representation of deracemization mechanisms of chiral molecules, as a general case by Viedma ripening. *A very small enantiomeric excess of the opposite sign can exist in the solution during the process.81,99
2. Mathematical Models
Although still under development, mathematical models reported in the literature support the explanation of the Viedma ripening mechanism. Models were based on different key factors such as Ostwald ripening, attrition and chiral cluster re-incorporation. First, Saito et al. and Uwaha et al. affirmed the importance of the presence of chiral clusters and their
Additionally, Cartwright et al. and Noorduin et al. stated that Ostwald ripening coupled with attrition are essential factors to reach homochirality.38,82,103 Finally, the authors
agreed on the concomitant effects of these three critical factors, i.e. attrition, Ostwald ripening and the presence of chiral clusters, for the achievement of total symmetry breaking in an autocatalytic way.104
Temperature Cycling Induced Deracemization
Besides experiments on attrition-enhanced deracemization, Viedma et al. considered the impact of temperature fluctuations on symmetry breaking experiments for amino acids or for NaClO3.105,106 Indeed, they have shown that the temperature gradient between the hot
bottom, in contact with a hot stirring plate, and the colder top of a flask containing NaClO3
crystals in suspension hastens crystal ripening and symmetry breaking. In the case of amino acid deracemization, the temperature gradient used was combined with attrition by glass beads: the larger the temperature gradient, the faster the induction time and total symmetry breaking.105 However, in the case of NaClO3 deracemization, there were no glass
beads and no stirring in the system, symmetry breaking was only ensured by the temperature gradient and boiling of the suspension, which enables circulation of crystals between the hot bottom and cold top.106 Based on these considerations, Suwannasang et
al. experimented with controlled temperature fluctuations for total symmetry breaking.107
These authors studied different cooling rates and temperature ranges and showed successful deracemization of organic chiral compounds by temperature cycling. Later on, members of an ongoing European project (CoRe project, focused on continuous resolution)108 also studied Temperature Cycling Induced Deracemization (TCID) and
investigated different key factors such as cooling rate, temperature range and racemization rate.109–111
1. Principle
Controlled temperature cycles are repeatedly applied to a racemic mixture of crystals in equilibrium with their saturated solution. Upon oscillating temperature and from local fluctuations of ee or CSD (as in Viedma ripening) a slight stochastic imbalance occurs between enantiomers. During heating, crystals are partially dissolved and during cooling, crystal growth and/or secondary nucleation occur. Thus, cyclic dissolution-recrystallization events provide an efficient crystal recycling and an overall similar autocatalytic effect as for Viedma ripening, where Ostwald ripening is enhanced by the
repetitive heating and cooling steps. Incorporation of chiral clusters has been proposed to explain the autocatalytic character of the process, observed in TCID experiments, as in Viedma ripening.112 Other authors suggested that the crystal growth rate dispersion of the
two populations of crystals might be an important factor in the outcome of TCID.113 So far,
no fully satisfactory TCID mechanism has been proposed, however, the influences of parameters were studied such as the amplitude of the temperature oscillation, the cooling rate and the racemization rate. It has been shown that the amount of crystals dissolved per cycle has to be sufficient to trigger symmetry breaking. Therefore, temperature dependence of the solubility will determine the suitable temperature range, i.e. between the highest and lowest temperature of the cycle.110 Study of the impact of cooling rate
shows that the deracemization time is not necessarily reduced by faster cooling rates since more cycles are then required.107 The racemization rate in the mother liquor also
influences the time required for deracemization: the faster the racemization, the faster the deracemization.109,111
It is also worth noting that damped temperature cycles can improve the efficiency of TCID. Indeed, once symmetry breaking is established, the duration of a temperature cycle can be decreased by damping its highest temperature while maintaining other parameters constant (heating/cooling rates and the lowest temperature). The required cycle number remains the same, but cycles are then faster, inducing faster deracemization.114
2. Mathematical Models
Crystal growth and Ostwald ripening are central factors for TCID. Consequently, many mathematical models are focused on the difference of crystal growth rate between each enantiomer (e.g. due to initial formation of nuclei at different times) to describe the stochastic symmetry breaking.113,115 While incorporation of chiral clusters was also
considered as in Viedma ripening to explain the autocatalytic character of the mechanism,112 stereoselective agglomeration should not be essential in TCID.116
Mathematical models have confirmed the influence of the cooling rate116 and initial
asymmetry, in CSD or ee, which guides the direction of deracemization.116–118
Other Methods
Other energy fluxes were investigated to deracemize a racemic suspension. Indeed, ultrasound119,120 or microwave121 are possible ways to induce total symmetry breaking.
Moreover, different methods have been investigated to improve and direct deracemization. It was found that the addition of chiral impurities in a chiral system, in a TCID or Viedma ripening process,122,123 enables a shift in deracemization towards the desired enantiomer.
![Figure II-7: Projection of the Na 2 S 2 O 6 ·2H 2 O crystal structure along [100] (a),(b) and along [001] (c)](https://thumb-eu.123doks.com/thumbv2/123doknet/14669880.741459/62.892.160.733.119.869/figure-ii-projection-na-s-o-crystal-structure.webp)
![Figure II-10 : Projection of Na 2 S 2 O 6 ·3(C 2 H 6 SO) crystal structure (a) along [101] and (b) and along [100]](https://thumb-eu.123doks.com/thumbv2/123doknet/14669880.741459/65.892.254.642.117.727/figure-ii-projection-na-s-o-crystal-structure.webp)
