HAL Id: hal-01789220
https://hal.archives-ouvertes.fr/hal-01789220
Submitted on 1 Jun 2018HAL is a multi-disciplinary open access archive for the deposit and dissemination of sci-entific research documents, whether they are pub-lished or not. The documents may come from teaching and research institutions in France or abroad, or from public or private research centers.
L’archive ouverte pluridisciplinaire HAL, est destinée au dépôt et à la diffusion de documents scientifiques de niveau recherche, publiés ou non, émanant des établissements d’enseignement et de recherche français ou étrangers, des laboratoires publics ou privés.
first-principles study
S. Chentouf, Sophie Cazottes, F. Danoix, M. Gouné, H. Zapolsky, Philippe
Maugis
To cite this version:
S. Chentouf, Sophie Cazottes, F. Danoix, M. Gouné, H. Zapolsky, et al.. Effect of interstitial car-bon distribution and nickel substitution on the tetragonality of martensite: A first-principles study. Intermetallics, Elsevier, 2017, 89, pp.92-99. �10.1016/j.intermet.2017.05.022�. �hal-01789220�
1
Effect of interstitial carbon distribution and nickel substitution on the tetragonality of martensite: a first-principles study.
S. CHENTOUF1, S. CAZOTTES2, F. DANOIX3, M. GOUNE4, H. ZAPOLSKY3 and P.
MAUGIS1
1Aix Marseille Univ, CNRS, Université de Toulon, IM2NP, Marseille, France. 2Université de Lyon, INSA Lyon, MATEIS-CNRS, Lyon, France.
3Groupe de Physique des Matériaux, Université de Rouen, CNRS, Rouen, France. 4ICMCB-CNRS, Pessac, France.
Email of the corresponding author: [email protected]
Abstract
By using first principles calculations, the effects of carbon distribution and of 25 at.% of nickel substitution on the tetragonality of ferrous martensite have been investigated. Different carbon
concentrations have been considered (0£xc£12.5 at.%). All calculations were based on the
Projector Augmented Wave (PAW) method of the Density Functional Theory (DFT). The Special Quasirandom Structure (SQS) method has been used to model the disordered structures
of the Fe16C2X and (Fe,Ni)16C2X systems. Our calculations demonstrate that the lattice
parameters a and cvary linearly with carbon concentration, up to the high value of xc=12.5 at.%
(for X=1). The nickel substitution enhances the expansion of parameter c of the Fe16C2X system
up to 37%. This trend is correlated with the shear moduli calculated for bcc-iron and the
disordered Fe25at.%Ni structure. The mixing energies of the Fe16C2X and (Fe,Ni)16C2X systems
indicate that the unmixing of martensite by spinodal decomposition is favoured by the nickel substitution. It is shown that carbon-carbon interactions are mostly repulsive until the distance of two bcc-iron lattice parameters.
I. Introduction
The relation between the lattice parameters and the carbon content of ferrous martensite has been the subject of many experimental studies in the last decades. From the review of experimental measurements, Cheng et al. [1] have established the linear dependences of the bct iron-carbon martensite a and c parameters as functions of the number of interstitials per iron
atom, 𝑥#:
𝑎 = 0.28664 − 0.027 ± 0.001 𝑥# 𝑛𝑚 Eq.1
𝑐 = 0.28664 + 0.243 ± 0.003 𝑥# 𝑛𝑚 Eq.2
From these equations, the tetragonality ratio is:
𝑐/𝑎 = 1 + 0.95 ± 0.01 𝑥# Eq.3
where 0.28664 nm is the adopted lattice parameter of pure bcc-iron at 300 K.
The above equations match well many experimental data. However, some differences in tetragonality are observed for steels having the same carbon content [2]. It was shown that these differences are related to both interstitial ordering [3-4] and alloying [2,5-6].
2
It is well accepted that tetragonality of martensite formed by quenching from high-temperature cubic face centered austenite phase is a direct consequence of carbon atoms preferential location at one of the three possible sub-lattices of octahedral interstices. In 1948, Zener [7] has used the elastic interactions to explain the temperature-dependent transition between ordered and disordered interstitial carbon distributions in martensite. Later, Khachaturyan [8] proposed a detailed description of expected strain induced ordering of solutes using the Microscopic Elasticity Theory (TEM). He demonstrated that the strongly repulsive chemical interactions and elastic interactions between carbon atoms must be taken into account in order to predict the order-disorder transition. The calculations of Khachaturyan have been recently reviewed by Udyanski [9] et al. using an ab initio EAM potential for Fe-C system and molecular dynamic simulations to estimate the chemical interactions between carbon atoms.
It was also shown that martensite tetragonality depends on substitutional content. It has been observed that freshly formed martensite steels containing Mn, low-Ni, Rh and Cr have an abnormally low tetragonality [10,11-12]. On heating these steels from room temperature the c parameter increases and the a parameter decreases [13-15]. Meanwhile, abnormally high tetragonality was found in freshly formed Al and high-Ni martensite [2, 5]. Heating freshly formed Al and high-Ni martensite led to a decrease of c and increase of a parameters. More recently, by using ab initio calculations Al-Zoubi et al. [16] found that Al and Ni addition
enhances significantly the c/a ratio of ordered Fe16C1.
The present study was carried out to investigate (i) the effect of interstitial carbon atom content and distribution and (ii) the effect of the substitutional Ni atoms on martensite tetragonality. The variation of the a and c lattice parameters is investigated at different carbon contents, ranging from small to high concentrations. The typical carbon content in supersaturated ferrous martensite is about 1 wt.% C (i.e. 4.48 at.%). However, a martensite quenched from austenite without tempering, if held at temperatures close to room temperature, will decompose to form a modulated structure of carbon-rich and carbon-lean areas. TEM and one-dimensional tomography revealed that in Fe-Ni-C alloys the nanoscale carbon-rich modulated structure results from spinodal decomposition [17-18]. Then, the carbon content, the structure and the stability of the carbon-rich regions have been the subjects of numerous experimental studies. It was suggested that these zones consist of an ordered phase. Because of the high carbon concentration of these regions (about 11.1 at.%), it is assumed that carbon atoms ordering in one type of octahedral site might be important. Thus, three types of long-range order distributions can be considered, from the least to the most ordered: (i) carbon randomly distributed on the three octahedral sub-lattices. That is the case of highly supersaturated ferrite
noted a-Fe16C2, (ii) carbon ordered on one octahedral sub-lattice and randomly distributed on
its octahedral sites. That is the case of Zener ordered martensite noted aZ-Fe
16C2 and (iii) carbon
ordered onto one octahedral sub-lattice with occupation of only some of its sites leading to the
stoichiometric structure a²-Fe16C2. Taylor et al. [17] have found that, for carbon compositions
close to 11 at.% and for low temperatures, the stoichiometric structure type (iii) has the lowest
free energy among the three types. The partially ordered aZ-Fe
16C2 structure (type (ii)) would
be the next most stable while the least stable would correspond to a-Fe16C2 (type (i)). These
results have been confirmed by Molecular Dynamic (MD) calculations performed by Sinclair et al [19].
In the first part of this paper, the effect of interstitial carbon content (up to xc=12.5 at.%) and
3
about the spinodal decomposition, the mixing energies are calculated for different carbon
concentrations by taking as references the stoichiometric structure a²-Fe16C2 and pure bcc-iron.
The Special Quasirandom Structure method has been applied to generate different possible carbon distributions on the octahedral sites within the bcc-iron lattice. Special attention has
been paid to ordering of the structure a²-Fe16C2. To discuss the differences between the mixing
energies of supercells with different distributions of carbon, the carbon-carbon interaction energies are calculated. In the second part, the effect of 25 at.% of Ni substitution on the lattice parameters of martensite is studied. The calculations of equilibrium lattice parameters and energies have been carried out using the Density Functional Theory (DFT).
II. Calculation details
The first-principles calculations are performed using the Projector Augmented Wave (PAW) [20] method as is implemented in the VASP code [21-22]. The calculations employ the Generalized Gradient Approximation (GGA) [23] for exchange-correlation energy. The calculations are done with the energy cutoff of 400 eV. k-points meshes are created by Monkhorst-Pack scheme [24]. 4x4x4 k-meshes are used for all cells with 128 atoms. The energy
convergence criterion of the electronic self-consistency is chosen as 10-5 eV for all calculations.
The reciprocal space energy integration is performed by the Methfessel-Paxton [25] technique for structure relaxation. All calculations are performed within the spin polarized approximation.
III. Results and discussion
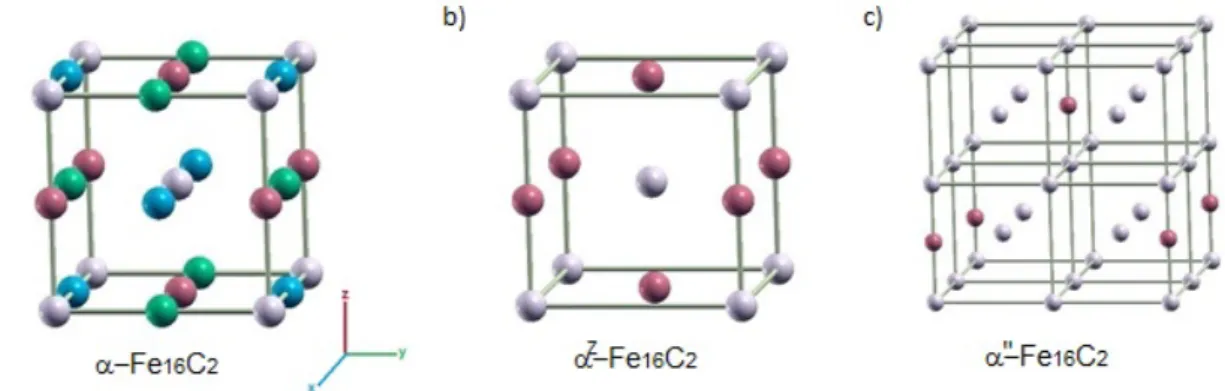
III.1. Ordering of carbon atoms in Fe16C2
To study the properties of Fe16C2 compound, the three types of long-range ordering are
considered, corresponding to the following structures: (i) a-Fe16C2 structure where carbon
atoms are randomly distributed on the three octahedral sub-lattices, (ii) aZ-Fe
16C2 structure
where carbon atoms are randomly distributed on one octahedral sub-lattice and (iii) a²-Fe16C2
structure where carbon atoms are ordered and occupy specific sites on one octahedral sub-lattice. The unit-cells of these three structures are shown in Fig.1.
First, the total energies per iron atom for these three structures have been calculated. For the
two structures aZ-Fe
16C2 and a-Fe16C2, three SQS supercells (with 128 Fe atoms + 16 C atoms)
have been considered with different carbon distributions on their respective interstitial sub-lattices. The results of these calculations are summarised in Table 1. Our results are in good
agreement with those obtained from molecular dynamics calculations [19]. The ordered
a²-Fe16C2 structure is the most stable one among the three considered structures. The partially
ordered aZ-Fe
16C2 structure is the second most stable while the fully disordered a-Fe16C2 is the
least stable. The ordering energy from a to a² is 24.9 meV/Fe atom.
The relaxed a²-Fe16C2 structure is perfectly tetragonal with a ratio c/a=1.107. The calculated
lattice parameters using the PAW [20] potential and PBE [23] approximation for the exchange correlations function reproduce well the previous theoretical data obtained using the
USPP-GGA methods [19]. For the case of aZ-Fe
16C2 and a-Fe16C2 structures, the average c/a ratios
are 1.10±0.01 and 1.03±0.02, respectively. The c/a uncertainty is defined as the standard
deviation of the three SQS supercells. Since, in a-Fe16C2 structure the carbon atoms are
4
expected, is close to 1. On the other hand, the carbon distributions on one octahedral sub-lattice
lead to a c/a ratio of around 1.1 for both aZ-Fe
16C2 and a²-Fe16C2 structures.
Figure 1. (a) The a-Fe16C2 unit cell with the positions of carbon sites on the three (x, y and z)
octahedral sub-lattices. (b) The aZ-Fe
16C2 unit cell. The carbon atoms occupy the z-octahedral
interstitial sub-lattice, with a lattice parameter close to aFe. (c) The a²-Fe16C2 unit cell with the
positions of carbon sites on the z-octahedral interstitial sub-lattice. The lattice parameter is
close to 2aFe. Iron atoms are in grey, carbon sites are coloured in accordance to their
sub-lattice (blue, green and red for x, y and z respectively).
Table 1. The equilibrium total energies per iron atom (meV/Fe atom), by taking as reference
the energy of a-Fe16C2, and lattice parameters of the a²-Fe16C2, aZ-Fe16C2 and a-Fe16C2
structures from the ab initio calculations. The lattice parameters correspond to the unit cells constructed with 2x2x2 bcc iron.
Property a²-Fe16C2 a²-Fe16C2 [19] aZ-Fe16C2 a-Fe16C2
Energy (meV/Fe atom) -24.6 n/a -9.9 0
Lattice parameter, a (Å) 5.64 5.71 5.64±0.02 5.77±0.05
Lattice parameter, c (Å) 6.25 6.31 6.22±0.04 5.94±0.08
Tetragonality, c/a 1.107 1.105 1.10±0.01 1.03±0.02
III.2. Carbon-carbon interactions in martensite
The carbon-carbon interactions have been calculated in order to discuss the differences between the mixing energies of supercells having different distributions of carbon atoms for a given concentration. In this section, the carbon-carbon interactions from the first nearest neighbours
(pair length aFe/2) to the nineteen nearest neighbours (pair length 2aFe) in the bcc-Fe are
presented and discussed.
For designation, the first 19 positions of carbon octahedral sites as function of pair length are shown in Figure 2.
5
Figure 2. The first nineteen positions of the carbon octahedral interstitial sites. Iron atoms in grey, carbon sites coloured in accordance to their sub-lattice.
The carbon-carbon interaction energies calculated using supercells containing 128 atoms of iron and two atoms of carbon, are summarised in Table 2. Fig. 3 presents the comparison of our results with the theoretical results obtained by Domain et al. [26]. The interaction energy is defined as:
𝑉 𝐴:, 𝐴< = 𝐸 𝐴:+ 𝐴< + 𝐸>?@ − 𝐸 𝐴: + 𝐸 𝐴< Eq. 4
where 𝐸 𝐴:+ 𝐴< , 𝐸>?@and 𝐸 𝐴A are the energies obtained when only atomic positions have
been allowed to relax. 𝐸 𝐴:+ 𝐴< is the total energy of a supercell containing two carbon
atoms. 𝐸>?@and 𝐸 𝐴A are the total energies of the supercells without carbon and with one
carbon atom in the octahedral sub-lattice, respectively. With this definition, a positive interaction energy means repulsion while a negative interaction energy denotes attraction. All supercells have the same size, i.e. equivalent to the size of the relaxed supercell of bcc-iron.
Note that 𝐸 𝐴: = 𝐸 𝐴< for bcc lattice.
Our calculations (Table 2) show that most interactions are repulsive. They predict that the interactions become slightly attractive for configuration 19 (400) while the previous DFT results of Domain et al. [26] predict attractive interactions for configurations 6 (102), 8 (220) and 15 (222). Nevertheless, our results seem to be in agreement with the calculations of Ruban [27] and Hatcher et al. [28]. The DFT results by Ruban et al. [27] and Hatcher et al. [28] can be found in graphical form in the original papers. We suggest that the discrepancies in interaction energies are directly related to the size of cell used for calculations and the details of the electronic calculations. On the other hand, from Figure 3, it can be seen that the interactions are large at the first shells and decrease with distance with an exception of shells 4 (020) and 18 (040) when one or two iron atoms are located along [010] direction between the two carbon atoms. Ruban [27] has found that strain-induced interactions become dominant just at the point where carbon atoms start attracting each other, i.e. from about the 14 (311) interaction. However, in our calculations we did not separate the chemical and elastic interactions.
6
Table 2. The calculated carbon-carbon interaction energies (in eV) at the same V(1-1) and different V(1-2) octahedral sub-lattices. The vectors of the nineteen neighbours as a function of pair length are correspondingly presented.
Type of interaction Distance of
separation
(units of aFe)
Vectors This work-128 atoms
(PAW-PBE) Domain et al. [26] (USPP-GGA)
V(1-2) 1 1/2 ½ [001] 1.9537 V(1-2) 2 2/2 ½ [011] 0.8298 0.65 V(1-1) 3 3/2 ½ [111] 0.2669 0.09 V(1-1) 4 1 ½ [020] 1.964 1.67 V(1-1) 5 1 ½ [200] 0.015 0.09 V(1-2) 6 5/2 ½ [102] 0.046 -0.13 V(1-2) 7 6/2 ½ [211] 0.073 V(1-1) 8 2 ½ [220] 0.0379 -0.14 V(1-1) 9 2 ½ [202] 0.1557 V(1-2) 10 3/2 ½ [300] 0.0645 V(1-2) 11 3/2 ½ [122] 0.1722 V(1-2) 12 10/2 ½ [031] 0.0712 V(1-1) 13 11/2 ½ [131] 0.3035 V(1-1) 14 11/2 ½ [311] 0.0154 V(1-1) 15 3 ½ [222] 0.0306 -0.16 V(1-2) 16 13/2 ½ [302] 0.0015 V(1-2) 17 14/2 ½ [132] 0.0055 V(1-1) 18 2 ½ [040] 0.8286 V(1-1) 19 2 ½ [400] -0.0161 -0.5 0 0.5 1 1.5 2 2.5 0 2 4 6 8 10 12 14 16 18 20 V( eV) coordination shell (octahedral sites) Present work (PAW-PBE) Domain et al. (USPP-GGA)
7
Figure 3. Calculated total carbon-carbon interaction energies in (eV). The ab initio results of Domain et al. [26] are shown by red spheres.
III.3. Effect of carbon concentration on the lattice parameter of Fe16C2X
To study the structural properties of ferrous martensite, the carbon atoms are distributed randomly on a single octahedral sub-lattice with occupation of specific sites only: precisely
those sites that correspond to carbon sites in the a²-Fe16C2 stoichiometric structure with 12.5
at.% of carbon. Here the martensite is approximated by the phase Fe16C2X. The parameter X
(0<X<1) is the occupancy factor of the carbon sublattice, i.e. the ratio of occupied interstitial sites by carbon atoms to the total number of interstitial sites in the interstitial sublattice of structure a². This gives us the possibility to treat the coherent spinodal decomposition between
Fe (X=0) and a²-Fe16C2 (X=1). The calculations have been performed with different supercells
containing 128 iron atoms. Nine concentrations (0£xc£12.5 at.%) are considered in total with
0, 2, 4, 6, 8, 10, 12, 14 and 16 interstitial atoms of carbon. For each concentration, three different supercells are used and an average of the structural parameters is calculated.
As described above, the a²-Fe16C2 structure (with 16 carbon atoms and 128 iron atoms) is
perfectly tetragonal. However, the structures with lower concentrations of carbon are slightly orthorhombic with very close lattice parameters a and b. In these cases, the average (a+b)/2 is
calculated to represent the lattice parameter, noted aFeC, for the considered carbon
concentration.
In order to scale our results in the same way as the data of Cheng et al. [1] and the molecular
dynamics results of Becquart et al.[29], the cFeC/aFe and aFeC/aFe ratios are presented in Figure
4. Our calculations have been done at 0 K. In this case the lattice parameter of iron is aFe=2.833
Å. It should be noted that both the experimental data of Cheng et al. and the MD results of Becquart et al. [29], given for comparison, are obtained at room temperature (300K). At this temperature, the lattice parameters of pure iron are 2.866 Å and 2.855 Å, respectively. These values are slightly higher than the one obtained in the present work. It is well known that the ab initio calculations at 0 K underestimate the lattice parameter of bcc-iron.
8
Figure 4. Lattice parameters of Fe16C2X system (lattice units) as a function of carbon
concentration. For comparison, the results of Cheng et al. [1] and Becquart et al. [29] are presented. The dotted lines correspond to the linear interpolations.
It can be seen in Fig. 4 that our calculations remarkably reproduce the linear dependence of
lattice parameters with carbon content up to the high concentration of xC=12.5 at%
corresponding to Fe16C2. Quantitatively, our results are in good agreement with the cFeC/aFe ratio
given by Cheng et al. [1] from the experimental data up to 8 at.%. This indicates that our calculations reproduce the expansion of the lattice parameter c of martensite as a function of
carbon concentration. However, for the case of aFeC/aFe, from about 2.5 at.% of carbon our
results diverge slightly, by 1%, from both the experimental data and theoretical values of Becquart et al.[29].
III.4. Mixing energies of Fe16C2X
The mixing energies of different structures of Fe16C2X system as function of carbon
concentration are calculated with supercells containing 128 atoms of iron. The mixing energy
per iron atom, as reference to pure iron and a²-Fe16C2 stoichiometric structure, is defined as:
∆𝐸CAD = 𝐸 𝐹𝑒:<G𝐶I −:JI 𝐸 𝐹𝑒:<G𝐶:J − 1 −:JI 𝐸(𝐹𝑒:<G) /128 Eq.5
Where, 𝐸 𝐹𝑒:<G𝐶I is the total energy of a cell containing 128 atoms of iron and n atoms of
carbon (n=16X). 𝐸 𝐹𝑒:<G is the calculated total energy of bcc-iron and 𝐸 𝐹𝑒:<G𝐶:J is the
total energy of the ordered a²-Fe16C2 structure.
The calculated mixing energies at nine different concentrations (0£xc£12.5 at.%) are presented
in Figure 5. Similarly to the lattice parameters, for each concentration, calculations of ∆𝐸CAD
have been performed for three different SQS supercells with different carbon spatial distributions on the interstitial sub-lattice. For each concentration of carbon, the average of the three different mixing energies is also calculated and presented in Figure 5. Remembering that
X = 8xC is the occupancy factor of the a’’ interstitial sub-lattice (0<X<1), the average energy
has been fitted according to the sub-regular solution model [36] in the form of a polynomial:
0.98 1 1.02 1.04 1.06 1.08 1.1 1.12 0 2 4 6 8 10 12 14 La tt ic e pa ra m et er s ( la tt ic e un its ) Carbon concentration Xc (at.%) aFeC[Present work] cFeC [Present work] aFe C[Becquart] cFeC [Becquart] aFeC [Cheng] cFeC [Cheng]
9
∆𝐸CAD = 𝜔N?#𝑋 1 − 𝑋 < Eq.6
with wFeC = 43 meV.
Figure 5. Mixing energy (in meV/Fe atom) of Fe16C2X structures as a function of carbon
concentration.
As can be seen in Figure 5, the mixing energies are positive for all carbon concentrations. The
curve of the average ∆𝐸CAD is not symmetric around the medium concentration xC=6.25 at.%
(i.e with 8 interstitial carbon atoms): it reaches a maximum for a carbon concentration around 4.7 at. % (i.e. with 6 interstitial carbon atoms).
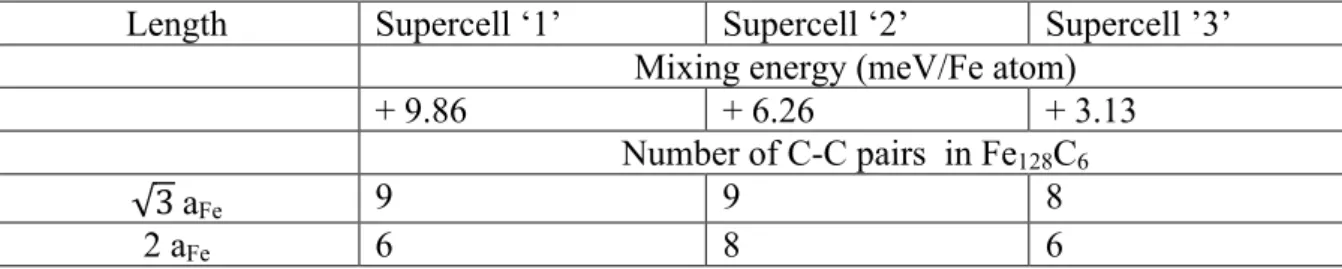
Among the three different mixing energies for each concentration, some are grouped very close together and others are scattered. These differences are likely to be related to the carbon distributions in the interstitial sub-lattice and therefore to the carbon-carbon interactions. To clarify this point, we have chosen to analyse the carbon atom distribution in the three different SQS supercells for the carbon concentration of 4.68 at. %. For this concentration, the differences between the mixing energies are significant (from 3.13 to 9.86 meV/Fe atom). We have identified all carbon-carbon pairs in the three different SQS supercells. Table 3 summarises the number of different carbon-carbon pairs as a function of their lengths. The carbon-carbon interaction energies have been calculated for the first nearest (1NN) and second
nearest neighbour (2NN) pairs in the a²-Fe16C2 structure. The details of the calculations and the
results of the interaction energies are presented and discussed in section III.2. In the case of the
a²-Fe16C2 structure, the 1NN and the 2NN correspond to the configurations 15 and 19 with
lengths 3 aFe and 2aFe respectively(see Figure 2).
The two values of the interaction energies for 1NN and 2NN carbon atoms are +0.025 and
-0.028 eV, respectively. Therefore, the interactions are repulsive between the first nearest neighbours and attractive between 2NN. Supercells ‘3’ with the low mixing energy has eight 1NN pairs, while the two other supercells have nine 1NN pairs each. Thus, supercell ‘3’ possesses the least number of repulsive interactions and this is why its mixing energy is lower
0.00 2.00 4.00 6.00 8.00 10.00 12.00 14.00 0.00 2.00 4.00 6.00 8.00 10.00 12.00 14.00 Mi xi ng en er gy (m eV /m et al a to m ) Carbon concentration Xc (at.%) Model SQS Average
10
than for the other supercells. Let’s compare now the number of second nearest neighbours of supercells ‘1’ and ‘2’. Although they have the same number of 1NN, the first supercell has six 2NN and the second has eight. Here, supercell ‘2’ has additional attractive interaction energies between the 2NN than the supercell ‘1’. Consequently, the mixing energy of supercell ‘2’ is lower than that of structure ‘1’. Note that, the number of 1NN and 2NN pairs is only one part of the explanation of the energy differences between the three SQS structures.
Table 3. Number and length of carbon-carbon pairs in the three SQS supercells of Fe128C6 (i.e
with carbon concentration xc=4.68 at.%). The mixing energies are also given to identify the
different supercells.
Length Supercell ‘1’ Supercell ‘2’ Supercell ’3’
Mixing energy (meV/Fe atom)
+ 9.86 + 6.26 + 3.13
Number of C-C pairs in Fe128C6
3 aFe 9 9 8
2 aFe 6 8 6
III.5 Effect of carbon concentration on the lattice parameters of (Fe,Ni)16C2X
In the following sections, we investigate the role of Ni substitution on the properties of Fe16C2X.
As in the case of Fe16C2X, nine carbon concentrations are considered for the calculations of the
lattice parameters of (Fe,Ni)16C2X. Calculations have been performed using disordered
structures by considering simultaneously (i) the substitutional disorder of nickel atoms on the iron sub-lattice and (ii) the interstitial disorder of carbon atoms on the interstitial sub-lattice.
Here also, the positions of interstitial carbon sites correspond to those of the a²-Fe16C2 structure.
In order to scale the lattice parameters of (Fe,Ni)16C2X systems to those of Fe16C2X, we have
presented the cFeNiC/aFe and aFeNiC/aFe ratios in Figure 6. Note that the resulting lattice parameter
of carbon-free SQS-Fe25at.%Ni structure for one bcc unit cell is aFeNi= 2.854 Å [30]. This
lattice parameter is calculated using the same methods in the present study.
Figure 6 shows that the lattice parameters of (Fe,Ni)16C2X are linear functions of the carbon
concentration. Additionally, the expansion and contraction of the lattice parameters are greater
in (Fe,Ni)16C2X than in Fe16C2X. For example, at xC = 12.5% the longitudinal deformations
𝜀 = 𝑐 − 𝑎N? 𝑎N? induced by carbon insertion are eFeNiC = 0.145 and eFeC = 0.106. We show
in the following that this behaviour can be explained in the frame of the elasticity theory of point defects. Indeed, the observed linear dependence of the lattice parameters vs the carbon
concentration can be written 𝑎 𝑥Q = 𝑎R 1 + 𝛿T𝑥# and 𝑐 𝑥Q = 𝑎R 1 + 𝛿Q𝑥# where da and
dc are the lattice expansion concentration coefficients. The lattice parameter a0 for carbon-free
alloys being respectively aFe and aFeNi for Ni-free and 25at.%Ni systems (see Table 4). For
lattice parameter c, 25 at.% addition of nickel results in an increase of carbon-induced
deformation up to 37%: eFeNiC / eFeC = 1.37. This finding is in qualitative agreement with the
DFT results of Al-Zoubi et al. [16]: the authors have found that 5 at.% of nickel enhances
significantly the c/a ratio of Fe16C1.
Table 4. Parameters used in the elasticity model of point defects. The elastic constants Cij’s and
11
a0 (Å) da dc C11 C12 C¢
bcc-Fe 2.833 -0.025 0.84 267 147 60
SQS-Fe25%Ni 2.854 -0.25 1.07 186 132 27
According to Bacon [32], Cochardt et al. [33] and Clouet et al. [34], the quadratic deformation induced by one carbon atom on a z-octahedral site in bcc lattice can be calculated from the
dipole tensor Pij associated to the point defect. According to the tetragonal symmetry of the
octahedral interstitial sites, the dipole tensor is diagonal and is characterized by only two
components: Pa and Pc related respectively to the lateral and longitudinal deformations induced
by the carbon atom. The components of the dipole tensor verify the following relations:
𝑃T =: <𝑎R V 𝐶 ::+ 𝐶:< 𝛿T+ 𝐶:<𝛿Q Eq.7 𝑃Q =:<𝑎RV 2𝐶 :<𝛿T+ 𝐶::𝛿Q Eq.8
where Cij are the elastic constants of the carbon-free matrix and da,c are the lattice expansion
concentration coefficients defined above. Applying these equations to bcc-Fe yields the values
Pa = 8.03 eV and Pc = 15.4 eV. On the other hand, for SQS structure Fe25at.%Ni, Pa = 4.48 eV
and Pc = 9.65 eV. It is clear that both dipole components and elasticity constants are weaker in
the case of Ni substitution. A rough estimate of the consequences on the longitudinal deformation can be derived as follows. From the inversion of Eq. 7 and 8 we obtain:
𝛿Q =T< WX
Y<#Z[\]^ (#ZZ^#Z[)\_
(#ZZY#Z[)(#ZZ^<#Z[) Eq.9
Noting that the component 𝑃T has a minor influence on dc compared to 𝑃Q, it appears that dc
scales approximately as the ratio Pc/C¢, where C¢=(C11-C12)/2 is the shear modulus. From Table
4, we have (Pc/C¢)FeNiC /(Pc/C¢)FeC =1.39, which is close to the value of 1.37 observed on e. We
conclude that the higher c/a ratios in the nickel-bearing system is due the higher compliance of the latter due to nickel substitution.
Based on the results of neutron diffraction experiments [35], Kurdjumov et al. [31] have deduced that during the martensitic transformation of FeNiC system with high Ni content, all carbon atoms occupy the sites of a single octahedral sub-lattice and consequently induce the maximum tetragonality for a given carbon content. While, for the case of other freshly formed martensite i.e with low Ni content and Ni-free, some of carbon atoms (about 20 %) are
distributed on the two other octahedral sub-lattices. In our calculations of Fe16C2X and
(Fe,Ni)16C2X systems, 100% of the carbon atoms have been located on the z-octahedral lattice.
Nonetheless, a high effect of nickel substitution on tetragonality is observed. We conclude that the influence of the nickel-induced softening on tetragonality cannot be discarded in this respect.
12
Figure 6. Lattice parameters of the (Fe,Ni)16C2X and Fe16C2X systems (in units of aFe) as
functions of carbon concentration. III.6. Mixing energies of (Fe,Ni)16C2X
The mixing energies of different (Fe,Ni)16C2X structures as function of carbon concentration
have been calculated with supercells containing 128 metallic atoms (with 96 Fe+32 substitutional Ni). In these calculations, the mixing energy per atom was calculated using the following expression:
∆𝐸CAD = 𝐸 𝐹𝑒`J𝑁𝑖V<𝐶I − I
:J𝐸 𝐹𝑒`J𝑁𝑖V<𝐶:J − 1 − I
:J 𝐸(𝐹𝑒`J𝑁𝑖V<) /128 Eq.10
where, 𝐸 𝐹𝑒`J𝑁𝑖V<𝐶I is the total energy of a cell containing 96 atoms of iron, 32 substitutional
atoms of nickel and n interstitial atoms of carbon, and 𝐸 𝐹𝑒`J𝑁𝑖V< is the total energy of the
SQS-Fe25at.%Ni structure. 𝐸 𝐹𝑒`J𝑁𝑖V<𝐶:J is the total energy average of two structures with
disorder on the substitutional lattice only, the interstitial carbon sublattice being totally filled. The calculated mixing energies for nine different concentrations are presented in Figure 7. Similarly to the case of lattice parameters, for each concentration, two different
SQS-(Fe,Ni)16C2X supercells, with different substitutional nickel and interstitial carbon distributions,
have been taken into account for the calculations of ∆𝐸CAD. Additionally, for each carbon
concentration, the average of the two different mixing energies is calculated and presented in
Figure 7. The average energy of mixing is fitted with an equation of type Eq. 6 with wFeNiC =
75 meV.
As shown in Figure 7, all average mixing energies are positive. Similarly to the Fe16C2X system,
the curve of the average ∆𝐸CAD is not symmetric around the medium concentration xC=6.25 at.
%: the maximum corresponds to a concentration around xC=4.7 at. % (i.e with 6 interstitial
carbon atoms). Moreover, the highest mixing energy value for the (Fe,Ni)16C2X system (~11
meV/metal atom) is greater than the one of the Fe16C2X system (~6 meV/Fe atom). This
indicates that unmixing of martensite by spinodal decomposition is favoured by the nickel substitution. 0.96 0.98 1 1.02 1.04 1.06 1.08 1.1 1.12 1.14 1.16 0 2 4 6 8 10 12 14 La tt ic e pa ra m et er s ( in u ni ts o f a Fe ) Carbon concentration Xc ( at. %) aFeNiC cFeNiC aFeC aFeC
13
Figure 7. Mixing energies (in meV/ metal atom) of (Fe,Ni)16C2X structures as a function
of carbon concentration.
In order to quantify the influence of 25at.%Ni substitution on the driving force for unmixing,
the free energy of mixing DFmix = DEmix – TDSmix is calculated. Under the hypothesis of random
distribution of the carbon atoms on the interstitial sites of a’’-Fe16C2, the entropy of mixing per
metal atom writes
∆𝑆CAD = −:G𝑘e 𝑋𝑙𝑛𝑋 + 1 − 𝑋 𝑙𝑛 1 − 𝑋 , Eq.11
where X is the occupancy factor of the interstitial sublattice, as defined above. The free energies of mixing for both systems are presented in Figure 8. The temperature T=300K has been chosen for the purpose of illustration.
Figure 8. Free energies of mixing (in meV/metal atom) for Fe16C2X and (Fe,Ni)16C2X
systems as a function of carbon concentration.
-2.00 0.00 2.00 4.00 6.00 8.00 10.00 12.00 14.00 0.00 2.00 4.00 6.00 8.00 10.00 12.00 14.00 Mi xi ng en er gy (m eV /m et al a to m ) Carbon concentration Xc (at.%) Model Average SQS -2 0 2 4 6 8 10 0 2 4 6 8 10 12 14 Fr ee e ne rg y of m ix in g (m eV /m et al a to m ) Carbon concentration Xc (at.%) FeC FeNiC
14
The vanishing slopes of DEmix functions in the vicinity of the stoichiometric compound Fe16C2
(i.e. for 𝑥# close to 12.5 at%) (Figures 6 and 7) result in minimal and negative values of DFmix
in this region. From the common tangent construction, a two-phase equilibrium appears at
T=300K between a very dilute phase (𝑥# ≈ 0) and an under-stoichiometric phase (𝑥#<12.5%),
for both systems. In addition, from the shape of the curves, it can be concluded that the driving force for unmixing of martensite is higher with 25%Ni alloying than without.
IV. Conclusion
Using first-principles calculations based on the PAW potential and PBE approximation for the exchange correlation, the effect of carbon distribution and nickel substitution on the
(Fe,Ni)16C2X system has been investigated. Three structures have been studied: a²-Fe16C2, aZ
-Fe16C2 and a-Fe16C2 . Our results show that the stoichiometric ordered a² structure is the most
stable among the three. The lattice parameters of both Fe16C2X and (Fe,Ni)16C2X systems vary
linearly with carbon concentration, up to the high value of 𝑥#=12.5 at.%. We find that nickel
substitution enhances the expansion of parameter c of the Fe16C2X system by 37%. This is
related to the fact that the disordered Fe25at.%Ni alloy is more compliant than pure bcc-iron.
The mixing energies of Fe16C2X and the (Fe,Ni)16C2X systems are positive for all carbon
concentrations. The highest mixing energy value for (Fe,Ni)16C2X (~11 meV/metal atom) is
greater than that of Fe16C2X (~6 meV/Fe atom). This indicates that unmixing of martensite by
spinodal decomposition is favoured by nickel substitution. It also suggests that the higher Zener ordering observed in nickel-bearing iron alloys is due to the softening effect of nickel substitution.
Acknowledgments
This study has been performed in the framework of the ANR-13-BS08-0014 SPIDERMAN project funded by the Agence Nationale de la Recherche (ANR). The calculations were carried out partially on the mesocentre of the Aix-Marseille University (project No. 16b045), and partially on the clusters of IDRIS (project No. 100524).
References
[1] L. Cheng, A. Bottger, Th.H. de Keijser and E. Mittemeijer, Scripta Metal. et Mater. 24, 509 (1990).
[2] P.G. Winchell, Sc.D. thesis, MIT, Cambridge, MA, 1958.
[3] L. Xiao, Z. Fan, Z. Jinxiu, Z. Mingxing, K. Mohuang, and G. Zhenqi, Phys. Rev. B 52, 9970 (1995).
[4] Z. Fan, L. Xiao, Z. Jinxiu, K. Mokuang, and G. Zhenqi, Phys. Rev. B 52, 9979 (1995). [5] M. Watanabo and C.M. Wayman, Scr, Metall. 5, 109 (1972).
[6] L.I. Lyssak and Ja. N. Vovk, Fiz. Met. Metalloved. 20,540 (1965). [7] C. Zener, Phys. Rev. 74, 639 (1948).
[8] G. Khachaturyan, Theory of structural transformation in solids (Wiley, New York, 1983). [9] A. Udyansky, J. von Pezold, V. N. Bugaev, M. Friak and J. Neugebauer, Phys. Rev. B 79, 224112 (2009).
15
[10] L.I. Lyssak and Ja. N. Vovck, Fiz. Met. Metalloved. 31, 646 (1971).
[11] L.I. Lyssak and Ja. N. Vovck and Ju. M. Polishchuk, Fiz. Met. Metalloved. 23, 898 (1967). [12] L.I. Lyssak and L.O. Andrushchik, Fiz. Met. Metalloved. 28, 348 (1969).
[13] F.E. Fujita, Metall. Trans. A 8, 1727 (1977).
[14] L.I. Lyssak, Fiz. Met. Metalloved. 45, 1230 (1978). [15] G. Kurdjumov, Metall. Trans. A 7, 999 (1976).
[16] N. Al-Zoubi, N.V. Skorodumova, A. Medvedeva, J. Anderson, G. Nilson, B. Johansson and L. Vitos, Phys. Rev. B 85 , 014112 (2012).
[17] K.A. Taylor, L. Chang, G.B. Olson, G.D. W Smith, M. Cohen and J.B.V Sand, Metall. Trans. 20 A, 2717 (1989).
[18] G.B. Olson and W. S. Owen, Martensite. A Tribute to Moriss Cohen (ASM International, Metals Park, Ohio, 1992).
[19] C. W. Sinclair, M. Perez, R.G.A. Veiga and A. Weck, Phys. Rev. B 81 (2010). [20] G. Kresse and D. Joubert, Phys. Rev. B 59, 1758 (1999).
[21] G. Kresse and J. Furthmuller, Comput. Mater. Sci. 6, 15 (1996). [22] G. Kresse and J. Furthmuller, Phys. Rev. B 54, 11169 (1996).
[23] J.P. Rerdew, K. Burke, and M. Ernzerhof, Phys. Rev. lett. 77, 3865 (1996). [24] H. J. Monkhorst and J.D. Pack, Phys. Rev. B 13, 5188 (1976).
[25] M. Methfessel and A.T. Paxton, Phys. Rev. B 40, 3616 (1989).
[26] C. Domain, C.S Becquard, and J. Foct, Phys. Rev. B 69, 144112 (2004). [27] A.V. Ruban, Phys. Rev B 90, 144106 (2014).
[28] N. Hatcher, G. K. H. Madsen and R. Drautz, Phys. Rev. B 86, 155115 (2012).
[29] C.S. Becquart, J.M. Raulot, G. Bencteux, C. Domain, M. Perez, S. Garruchet, H. Nguen, Comput. Mater. Sci. 40, 119 (2007).
[30] S. Chentouf, P. Maugis, Comput. Mater. Sci., 126, 82 (2017).
[31] G. V. Kurdjumov and A.G. Khachaturyan, Acta. Mattaurgica, 23, 1077 (1975). [32] D. J. Bacon, Scripta Metallurgica, 3, 735-740 (1969).
[33] A.W. Cochardt, G. Schoeck and H. Wiedersich, Acta Met. 3, 533 (1955).
[34] E. Clouet, S. Garruchet, H. Nguyen, Michel Perez, C. Becquart, Acta Materialia, 56, 3450 (2008).
[35] I.R. Entin, V.A. Somenkov and S. SH. Shilstein, Dokl. Akab. Nauk USSR 206, 1096 (1972).