Continuous Improvement at a Multinational Company
-
Dealing with
Uncertainty in the Global Supply Chain and Analyzing Implementation
Dynamics
By
Arturo Ochoa Gonzalez
B.S. Engineering in Mechatronics, Universidad Panamericana, 2007
Submitted to the MIT Sloan School of Management and the Engineering Systems Division in Partial Fulfillment of the Requirements for the Degrees of
Master of Business Administration
And
Master of Science in Engineering Systems
In conjunction with the Leaders for Global Operations Program at the Massachusetts Institute of Technology
June 2013
ARCHNE$-f MA6SACHUSIM1S INS E OF TECHNOLOGY
3.0
2013
LIBRARIES
© 2013 Arturo Ochoa Gonzalez. All rights reserved.
The author hereby grants MIT permission to reproduce and to distribute publicly ies is
thesis document in whole or in part in any medium now known or hereaftqr Z~d.
Signature of Author
Engineering Systems Division, MIT Sloa92c f
I4anagement
A May,10, 2013
C)
J. Bradl orrison, Tkesis SupervisorS cturer, 'erin ystems Division
Donald B.
o*e
eld, hes' eaderSenior Lecturer, MIT S1 Ma gement
Certified by.
Accepted by
Research Director, MIT CTL & Executive
A2
Accepted by'Maura Herson, Director of MIT Sloan MBA Program MIT Sloan School of Management
Vf
1er L. de Weck, Chair, Engineering Systems Division
Professor of Engineering Systems and Aeronautics and Astronautics and Engineering Systems
Certified by
Continuous Improvement at a Multinational Company
-
Dealing with
uncertainty on the Global Supply Chain and Analyzing Implementation
Dynamics
By
Arturo Ochoa Gonzalez
Submitted to the MIT Sloan School of Management and the Engineering Systems Division on May
10, 2013 in Partial Fulfillment of the Requirements for the Degrees of Master of Business
Administration and Master of Science in Engineering Systems
Abstract
This thesis explores the problem of global supply chain flexibility in the context of a multinational commonly that we refer to as Company X. Company X faces competitive markets, increasingly demanding customers, and internal challenges due to the global extension of previously local business processes. Company X aims not only to produce goods to meet customers' requirements but also to improve the performance of its fundamental business processes. Considering this reality, this thesis explores two main initiatives to accomplish sustainable continuous improvement: 1) maximize flexibility in the Global Value Chain while minimizing waste and
variance, and 2) develop a methodology to ensure the successful implementation of improvements. For the optimization of the Global Value Chain, the objective was to enable the company to grow its business as global opportunities present themselves. For this purpose, this thesis proposes a new planning process that both enables assessing the risk on supply and deliveries due to the variability of lead times and includes real options analysis in the planning processes for Region A. As a result, this Dynamic Strategic Global Sourcing Plan will make possible the creation of a plan that captures benefits from increases in project value and insures against losses from decreased project value. In addition to the strategic and tactical work for the optimization of the Value Chain, it is a reality that large-scale transformation requires a deep understanding of the human side. The company's culture, values, people, mindset and capabilities must be changed to ensure a successful implementation of the improvements. On this line, a unique iterative perspective on managing the human side of change that can be adapted to a variety of realities was developed during the course of the research. This technique is iterative and adaptable because transformation is not a one-time event but an ongoing process and the company is a multinational corporation facing different situations on its locations.
Overall, the aim and tasks of the thesis deal with sustaining continuous improvement in a dynamic Global Value Chain environment. The Dynamic Strategic Global Sourcing Plan will enable Company X to respond effectively to changes and the Change Management Process will ensure the
implementation of the processes needed to make that effective response possible. Thesis Supervisor: J. Bradley Morrison
Title: Senior Lecturer, Engineering Systems Division Thesis Reader: Donald B. Rosenfield
Title: Senior Lecturer, MIT Sloan School of Management Thesis Supervisor: Edgar Blanco
Acknowledgments
I would like to thank the great and kind people of Company X for their collaboration and support
throughout the internship. Special thanks to company supervisors and company's LGO liaison for their guidance.
I would also like to thank the Leaders for Global Operations programs staff, faculty and students and my advisors and reader, Edgar Blanco,
J.
Bradley Morrison and Donald B. Rosenfield, for taking the time to advise me during the research, analysis, and writing of this thesis.Finally, I would like to thank my spouse, Luz Maria, my parents, Arturo and Lucia Guadalupe, and all my relatives for their unconditional support and great advice through all my life, especially during this amazing LGO journey.
Table of Contents
A bstract ... 3
A cknow ledgm ents...5
Table of Contents ... 7
List of Figures ... 9
List of Equations... 11
1 Introduction ... 12
1.1 Com pany O verview ... 12
1.2 Thesis M otivation...12
1.3 Problem Statem ent...14
1.4 Thesis Structure ... 15
2 Supply Chain... 16
2.1 From Local to Global...16
2.2 Lead Tim es...17
2.3 Cultural, language, and tim e zone differences... 19
2.4 Governm ents and Regulation...21
3 N on-D eterm inistic Supply Planning Process ... 23
3.1 Current Planning Process - Base Case ... 23
3.2 Dynamic Strategic Global Sourcing Planning Process... 25
3.2.1 A cknow ledge and U nderstand U ncertainty... 25
3.2.2 Dynamic Analysis of the Global Sourcing Process ... 28
3.2.3 D ynam ic Strategic Global Sourcing Plan ... 31
4 Change Management and Process Improvement Dynamics ... 33
4.1 Change M anagem ent...33
4.1.1 U nderstanding the change...34
4.1.2 Planning and preparing for change ... 35
4.1.3 Im plem enting the change ... 37
4.1.4 Em bedding the change ... 38
4.2 Process Im provem ent Dynam ics...39
4.2.1 Priority of Corrective Actions over Preventive Actions ... 40
4.2.2 R esource allocation problem ... 41
5 Case of study: Embedding the Dynamic Strategic Sourcing Plan at Company X ... 43
5.1 Change M anagem ent...43
5.1.1 U nderstanding the change...43
5.1.2 Planning and preparing for change ... 46
5.1.3 Im plem enting the change ... 48
5.1.4 Em bedding the change ... 49
5.2 Process Im provem ent Dynam ics...51
6 Conclusions and Future Suggestions...63
6.1 R ecom m endations for Further Research ... 63
7 References... 65
A ppendix A . Tornado D iagram ... 68
Appendix B. Excel Tool for Probability Distribution Fitting ... 69
General O verview ... 69
Tool Foundations... 71
Appendix C. Understanding the Change -Sample Forms and Interview Questionnaires ... 74
PESTLE A nalysis7... 74
Career Anchors Analysis ... _....86
Cultural Web ... ... ... 88
Appendix D. Setting Process Improvement Dynamics Model in Equilibrium ... 91
PosiionlSto ...k rium ... 9
Position1 S. Stock ...... ...-... 92
Position to be Position2 Stock... ... 9
Position2 Stock .... ... . .... ... 93
Position2 to be Position3 Stock...9
Position3 Stock... ... 94
Position3 to be Position4 Stock ... ... 94
Position4 Stock... ... ... ... .... ... 95
Total Position PI Skills Stock...95
Total P1toP2 PI Skills Stock... ... ... 96
Total Position2 PI Skills Stock... 96
Total P2toP3 PI Skills Stock... ... ... 97
Total Position3 PI Skills Stock...97
Total P3toP4 PI Skills Stock... ... 98
List of Figures
Figure 1.1 - Quantity of domestic and import goods from 2002 to the first semester of 2012...12
Figure 1.2 - Import and domestic goods from 2002 to the first semester of 2012 ... 13
Figure 1.3 - Import and domestic goods from 2002 to the first semester of 2012 (excluding 2004, 2 0 0 5 & 2 0 0 8 ) ... 1 3 Figure 1.4 - Developed and Emerging Markets (Blanco, 2008)...14
Figure 2.1 - Supply Chain transformation from local to global in 10 years (2002-2012)... 16
Figure 2.2 - Generic Local Supply Process to a Generic Global Supply Process by land ... 17
Figure 2.3 - Generic Local Supply Process to a Generic Global Supply Process by sea... 18
Figure 2.4 - Map of the world's main languages ... 19
Figure 2.5 - Top 20 of languages based on number of native speakers... 20
Figure 2.6 - Standard Time Zones of the World ... 20
Figure 2.7 - Logistics Performance Index International 2012 Rank ... 21
Figure 2.8 - DHL Global Connectedness Index 2012 World Map... 22
Figure 3.1 - Flaw of A verages...24
Figure 3.2 - Planning Process at a typical mill (Azrielant, 2011)...24
Figure 3.3 - Risk Sources in Supply Chains (JUttner et al, 2003)... 26
Figure 3.4 - Risk Categories in Supply Chains and their drivers (Chopra and Sodhi, 2004)... 26
Figure 3.5 - Proposed Risk Categorization for Company X ... 27
Figure 3.6 - Normal Distribution representation for different number of iterations... 29
Figure 3.7 - Comparison of Total Time needed for different number of iterations...30
Figure 3.8 - Dashboard of the Dynamic Analysis of the Global Sourcing Process Tool... 30
Figure 3.9 - Dashboard of the Dynamic Strategic Global Sourcing Plan... 32
Figure 3.10 - Comparison of Dynamic Strategic Global Sourcing Plan and Dynamic Analysis of the Global Sourcing Process Dashboards ... 32
Figure 4.1 - Comparison of two well-known change management processes... 33
Figure 4 .2 - C ultu ral W eb ... 35
Figure 4.3 - Main Owners during Change Management Process... 36
Figure 4.4 - Stockdale Paradox ... 36
Figure 4.5 - O w nership Cascade...37
Figure 4.6 - Process Capability response to new ideas and resources available at different times ...38
Figure 4.7 - Impact of Competencies, Skills, and Behaviors on Embedding the Change ... 39
Figure 4.8 - Better-before-worse and Worse-before-better Dynamics (Repenning and Sterman, 2 0 0 1 ) ... 4 0 Figure 4.9 - Process Improvement Dynamics under Constrained Resources (Morrison, 2012) ... 41
Figure 5.1 - P EST L E A nalysis ... 44
Figure 5.2 - Key Stakeholders Netw ork...45
Figure 5.3 - Cultural Web of Company X Region A ... 46
Figure 5.4 - Sequence of Dynamic Strategic Global Sourcing Excel Tool Development... 47
Figure 5.5 - Core Shared Vision and Customized Vision Statements... 47
Figure 5.6 - Work Breakdown Structure for Change Management... 48
Figure 5.7 - Technical and soft capabilities for Job Position H ... 50
Figure 5.8 - Technical Capabilities Level for different Job Positions ... 50
Figure 5.9 - Expected Professional Growth of Personnel from a division in Company X Mills ... 51
Figure 5.10 - System Dynamics Expected Professional Growth of Personnel in Company X Region A M ills ... 5 2 Figure 5.11 - Steady-state Equilibrium Stocks and Rates for People Development and Talent Lost with Desired Attrition. Note: actual values have been removed to protect proprietary data... 53
Figure 5.12 - Steady-state Equilibrium Stocks and Rates for People Development and Talent Lost with Company X Attrition values. Note: actual values have been removed to protect proprietary d ata ... 5 4
Figure 5.13 - Runs Comparison between Results with Desired Attrition and Results with Company
X Region A Mill G Values. Note: actual values have been removed to protect proprietary data...55
Figure 5.14 - Comparison of Employees Lost between System Dynamics Model and Company X R eg io n A M ill G ... 5 6 Figure 5.15 -Steady-state Equilibrium Stocks and Rates for PI Skills with Desired Attrition. Note: actual values have been removed to protect proprietary data... 57
Figure 5.16 -Steady-state Equilibrium Stocks and Rates for PI Skills with Company X Region A Mill G Values. Note: actual values have been removed to protect proprietary data... 58
Figure 5.17 -Comparison of Total PI Skills Results with Desired Attrition and Company X Region A Mill G Real Attrition. Note: actual values have been removed to protect proprietary data... 58
Figure 5.18 -Resource Allocation Dynamics Model... 59
Figure 5.19 -Effect of the Ratio of Total PI skills on Time to Correct Problems... 60
Figure 5.20 -Change in Process Problems and Resources to Production due to changes in Attrition ... 6 0 Figure 5.21 -Continuous Improvement Problem Introduction Pattern... 61
Figure 5.22 -Process Problems with Continuous Improvement Problem Identification for the two scen arios in attrition ... 6 1 Figure 5.23 -Resources to Production with Continuous Improvement Problem Identification for the tw o scenarios in attrition... 62
Figure A.1 - Tornado Diagram...68
Figure B.1 - Probability Distribution Fitting Excel Tool: Data Input & Dashboard Tab... 69
Figure B.2 - Probability Distribution Fitting Excel Tool: Histogram Tab... 70
Figure B.3 - Probability Distribution Fitting Excel Tool: Chi-squared test Tab... 70
Figure B.4 - Probability Distribution Fitting Excel Tool:
Q-Q
Plot Tab ... 71Figure D .1 - Position 1 Stock ... 92
Figure D.2 - Position1 to be Position2 Stock...92
Figure D .3 - Position 2 Stock ... 93
Figure D.4 - Position2 to be Position3 Stock...93
Figure D .5 - Position3 Stock ... 94
Figure D.6 - Position3 to be Position4 Stock...94
Figure D .7 - Position4 Stock ... 95
Figure D.8 - Total Position1 PI Skills Stock...95
Figure D.9 - Total P1toP2 PI Skills Stock ... 96
Figure D.10 - Total Position2 PI Skills Stock...96
Figure D.11 - Total P2toP3 PI Skills Stock...97
Figure D.12 - Total Position3 PI Skills Stock...97
Figure D.13 - Total P3toP4 PI Skills Stock...98
List of Equations
Equation B.1 - Mean of a sample ... 71
Equation B.2 -Median of a sample with odd number of observations ... 71
Equation B.3 - Median of a sample with even number of observations ... 72
Equation B.4 - Range of a sample ... 72
Equation B.5 - Mode of a sample...72
Equation B.6 - Standard Deviation of a sample ... 72
Equation B.7 - Variance of a sample...72
Equation B.8 - Degrees of freedom for the goodness of fit test... 72
Equation B.9 - Hypothesis for Chi-square test...73
Equation B.10 - Chi-square formula...73
Equation B.11 - Formula to determine the normal (i/(n+1))th quantile ... 73
Equation D.1 - Position1 Stock Equilibrium Formula... 92
Equation D.2 - Position1 to be Position2 Equilibrium Formula ... 92
Equation D.3 - Position2 Stock Equilibrium Formula... 93
Equation D.4 - Position2 to be Position3 Stock Equilibrium Formula ... 93
Equation D.5 - Position3 Stock Equilibrium Formula... 94
Equation D.6 - Position3 to be Position4 Stock Equilibrium Formula ... 94
Equation D.7 - Position4 Stock Equilibrium Formula... 95
Equation D.8 -Total Position1 PI Skills Stock Equilibrium Formula ... 95
Equation D.9 -Total P1toP2 PI Skills Stock Equilibrium Formula... 96
Equation D.10 -Total Position2 PI Skills Stock Equilibrium Formula ... 97
Equation D.11 -Total P2toP3 PI Skills Stock Equilibrium Formula ... 97
Equation D.12 -Total Position3 PI Skills Stock Equilibrium Formula ... 98
Equation D.13 -Total P3toP4 PI Skills Equilibrium Formula ... 98
1 Introduction
1.1 Company Overview
With annual sales of US$20.8 billion in 2011 and more than 57,000 employees worldwide, the multinational commonly where the research was done, hereafter referred as Company X, is a diversified consumer product goods (CPG) corporation that combines technology with the human side (culture, values, people, behavior, etc.) to constantly improve in essentials for a better life. Company X global brands are sold in more than 175 countries, connecting consumer products and innovation with environmental stewardship to provide professional, health care and personal care products.
1.2 Thesis Motivation
Company X faces competitive markets, increasingly demanding customers, and internal challenges due to the global extension of previously local business processes. Thus, it aims not only to produce goods to meet customers' requirements but also to improve the performance of its fundamental business processes at a local, regional and global level.
The globalization of the value chain requires changes on the way the business is organized and operates because the activities are scattered internationally. This transformation requires adjustments on the operational side, management infrastructure, and mindset and capabilities. Embedded in the global value chain, enterprise's global supply chain is a "backbone process" to meet company's global growth and strategy for now and in the future. For this reason, Company X has recently made a transition from local to a regional/global procurement system. To illustrate, Figures 1.1, 1.2, and 1.3 show how the company has recently changed the supply mix between domestic and import goods, for a group of raw materials, from 2002 to the first semester of 2012.
Import Vs Domestic I
2002 2003 2004 2005 2006 2007 2008 2009
-Domestic Goods -Import Goods
2010 2011 IS semester
2012
Figure 1.1 -Quantity of domestic and import goods from 2002 to the first semester of 2012
100.00% 90.00% 80.00% 70.00% 60.00% 50.00% 40.00% 30.00% 20.00% 10.00% 0.00%
Import and Domestic Goods
2002 2003 2004 2005 2006 2007 2008
m Domestic Goods * import Goods
2009 2010 2011 1st semester 2012
Figure 1.2 - Import and domestic goods from 2002 to the first semester of 2012
Import and Domestic Goods (excluding 2004,2005 & 2008)
100.00% 90.00% 80.00% 70.00% 60.00% 50.00% 40.00% 30.00% 20.00% 10.00% 0.00% 2002 2003 2006 2007 2009 2010 2011 1st semester
E Domestic Goods * Import Goods 2012
Figure 1.3 -Import and domestic goods from 2002 to the first semester of 2012 (excluding 2004, 2005 & 2008)
Moreover, turning a local value chain into a global value chain (including global supply chain) presents new challenges (RSM McGladrey and The Manufacturing Institute, 2007):
1. Adequate supply chain management to minimize waste and variance and maximize
flexibility.
2. Acceleration of continuous improvement and innovation activities to respond quickly to changes in demand and competitors' actions.
3. New workplace dynamics and capabilities to manage and sustain operational improvement and the way individuals and organization think, feel, and act to ceaselessly pursue customer satisfaction.
Furthermore, special considerations arise due to the region of study that consists of emerging markets, hereafter called Region A (Blanco, 2008). Figure 1.4 illustrates common countries considered as emerging markets. The challenges proper of the region are:
1. Political instability
2. Fluctuating regulations
3. Poor inventory visibility
4. Poor infrastructure
5. Lack of demand data 6. Cultural diversity
Developed Markets
-Emerging Markets
Figure 1.4 -Developed and Emerging Markets (Blanco, 2008)
Company X is not exempt from the challenges mentioned. Therefore, understanding how to deal and solve effectively these issues will create a major source of competitive advantage to Company
X.
1.3 Problem Statement
Company X's transformation is not a one-time event but an ongoing process. On this line, this thesis will work on two main initiatives Company X can work on to accomplish a sustainable continuous improvement and, in turn, gain competitive advantage. The first initiative consists of an approach to include uncertainty on global supply chain planning in order to maximize flexibility and minimize waste and variance. The second proposal comprises an iterative and adaptable perspective to
manage the human side of change by matching the ever changing needs of the organization with the ever changing needs of the employees to ensure the successful implementation of improvements at a local, regional and/or global level.
1.4 Thesis Structure
The remainder of the thesis structure is as follows:
Chapter 2 outlines a description of the change, from local to global, of the supply chain and the
challenges Company X is facing due to this transformation.
Chapter 3 describes the Dynamic Strategic Sourcing Planning proposed.
Chapter 4 depicts an analysis of process improvement dynamics and the change management
process for the implementation of the initiatives.
Chapter 5 explores a case of study for the implementation of the Dynamic Strategic Sourcing
Planning following the change management process suggested.
Chapter 6 contains the conclusions of the study and suggestions for future research activities to
2 Supply Chain
2.1 From Local to Global
It is a reality that CPG's business environment is global. This global expansion of the value chain, including the supply chain, offers many gains in global efficiency such as being responsive to local markets, integrating and coordinating the global operations to achieve better economies of scale and scope, and transferring knowledge from one location to another. Nonetheless, the global extension of business processes gives rise to numerous obstacles in the form of internal changes, increased complexity, wider competition and local/global conscience. In the end, the effects of global expansion, due to the gains and obstacles, are significant on key factors that generate sustainable growth like, for instance, company's competitive advantage, its ability to grow the business as global opportunities presented themselves, and its capacity to insure against losses from decreased project value, just to mention a few.
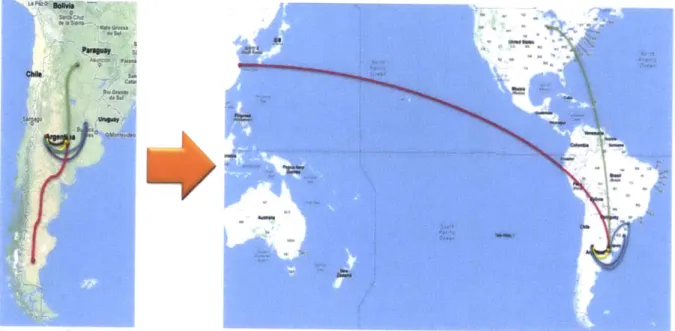
As a consequence of the internationalization efforts of CPG industry, Company X changed dramatically its supply chain during the last ten years. As an example, Figure 2.1 presents the transformation of the supply for a group of raw materials for a specific region. As expected, this transformation at Company X was primarily driven by the pursuit of key benefits such as unifying regional/global purchases, reducing monopolistic behaviors from local suppliers, looking for options with the same quality and lower price, among others.
Points do not represent exact locations
Figure 2.1 -Supply Chain transformation from local to global in 10 years (2002-2012)
However, this modification produced unintended consequences that are intrinsic from going global. The main effects Company X is facing are longer lead times; cultural, language, and time zone differences among stakeholders; and higher vulnerability to governments' decisions and regulation.
2.2 Lead Times
One of the main changes from moving the supply of a product from local to global can be seen on the lead times. This difference in lead times is mainly due to a variation in distance and an increase in activities for bringing the materials such as import/export processes, compliance with regulatory procedures, and others. It is important to consider both factors because if we consider only one factor at a time we are not looking the whole picture that Company X deals with.
In terms of the variation in distance, the majority of the new suppliers are further from the delivery point than the local suppliers and, in consequence, it takes longer time to transport the material from its origin to its destiny. On the other hand, a small number of suppliers are closer, in kilometers, than the previous suppliers; however, this does not necessarily mean that lead times are shorter because getting new supplier's materials requires additional processes, primarily from regulatory and legal nature.
Furthermore, the majority of the additional activities, from going global, that Company X does to get the materials to its destination are non-value added but necessary and their duration depend not only on Company X time to do the tasks, but also on the time that all the institutions involved take to complete these activities. To clarify, Figures 2.2 and 2.3 show examples of how generic supply process changed from local to global by land and by sea, respectively. From these figures, it can be seen the increase in complexity and time on the supply and delivery processes due to the global extension of the value chain.
Standard du -rati -on (days)
Figure 2.2 - Generic Local Supply Process to a Generic Global Supply Process by land
Standard duration (days)
I
II
I
20 1-2 . . ... .. ... ... 1-15 1 31
I 3 A. 20I
2 -3- 3-I
I
I
Figure 2.3 - Generic Local Supply Process to a Generic Global Supply Process by sea
In addition to longer lead times, other consequences of having different modes of transportation are bigger order sizes, increase in logistics' processes, and more exposure to environmental conditions. With respect to order size, the change from local supply, done by land, to global supply, done by sea, implies a conversion to bigger orders mainly due to larger vessels and longer lead times. More supply sources involves more elements to coordinate and align into the supply chain. Additionally, importing goods by port takes more time than by land due to port logistics. So, having more modes of transportation increases the logistics' processes the company needs to do. Finally, importing goods from different locations exposes the company to delays due to environmental conditions at the origin of the raw materials and in the route the suppliers take to deliver the goods at the final destination.
I
Sta ndar d dur a tio n (d ay
5)
St an d ard Dur at io n2.3 Cultural, language, and time zone differences
Cultural, language, and time zone differences are a reality in global value chains that should be recognized as a major topic on the transformation process from local to global (Cook, 2006). It is important to get a sense of the culture and basic language skills of the place where the company is thinking to expand business activities because its ability to develop relationships on these new locations will determine how successful the globalization of the value chain will be.
From the cultural perspective and defining culture as beliefs, symbols, norms, and values prevalent among people in a society, the prevailing value emphases may be the main feature to capture and characterize cultures (Hofstede, 2001; Schwartz, 1999) because they express shared conceptions of what is good and desirable in the culture. Moreover, cultural value emphases shape and justify policies, norms, and everyday practices. Thus, it is critical for Company X to identify those prevalent values of the culture where it is migrating because any aspect that is incompatible with them is likely to generate tension, elicit criticism, and, in turn, affect enterprise efforts to establish any presence on that location.
Regarding language, although many companies that establish communication with Company X in non-English and non-Spanish speaking countries have English-speaking and Spanish-speaking employees, problems arise when interactions with key personnel that do not always have sufficient command of English and/or Spanish to engage in lengthy or detailed exchanges are necessary. In general, this situation occurs in technical discussions where people were hired for their technical abilities and not their education; and usually they tend not to have any training in a foreign language. To illustrate, Figures 2.4 (Geocurrents, 2012) and 2.5 (Nationalencyklopedin, 2007) provide a quick glance of the different languages around the world.
7En@. ur French
*Aral*c
8 Spanish
-Malay (Indairdan/alasysian)
Germnan d ie Oae or de faca Nwe, F h 5b t
MandannsChinese afllstsai at m the MW (it rlakw
Pismin thee itemaolk* chu.t "ad VaanaWJ. the t.
1-" do recerated so-eeeej stass wo.)u Pftmw ii
Native speakers (in millions) by language
Figure 2.5 - Top 20 of languages based on number of native speakers
Finally, time zone differences play an important role when employees of Company X need to coordinate agendas with peers, partners, and suppliers from different locations. However, these complications -for example, take more time to solve issues due to the different work schedules, pay extra-time, change labor schedule if regulation permits it, different holidays' schedules among countries, etc.- can be justified due to the benefits of having a 24-hours work schedule on topics where it is possible; especially on the CPG industry where things change quickly. The different time zones Company X deals with -for all the activities of the Value Chain- are all the standard time zones, shown in Figure 2.6.
44.
%e
T.5
t 7
~
7 0 .-Source - University of Texas - htto://wwwIibutexas.edu/maos/wod maoslimezones refOOo
Altogether, the cultural, language, and time zone differences are important aspects a company needs to consider to ensure a successful transformation from local value chain to global value chain.
2.4 Governments and Regulation
The efficiency of Global value chains depends on government services, investments, and policies (The World Bank, 2012). Governments play an important role on building local infrastructure, developing a regulatory regime for logistics, and implementing efficient customs clearance procedures, i.e. governments can facilitate trade through investments in both "hard" and "soft" infrastructure. Good indicators about countries' trade logistics performance are: the Logistics Performance Index (LPI) by the World Bank and the Global Connectedness Index (GCI) by DHL (Ghemawat and Altman, 2012).
The LPI provides a global benchmark to measure logistics performance among countries. This indicator helps countries identify the challenges and opportunities they face in their trade logistics performance and what they can do to improve. A world map of the LPI International 2012 rank can be seen on Figure 2.7.
-~vs
geoiQ
WMd Bank
Source: http://lpisurvey.worldbankorg/
Figure 2.7 - Logistics Performance Index International 2012 Rank
The GCI refers to the depth and breadth of a country's integration of 140 countries with the rest of the world. The 140 countries studied represent 99% of the world's GDP and 95% of its population. Besides, the GCI also depicts the actual extent and direction of globalization around the world, which is less globally connected today than it was in 2007. Figure 2.8 illustrates the rank for the 140 countries studied at the GCI.
Index value >[ 70 S60-69 50-59 40-49 30-39 20-29 <20 Dunnown
Source: http://www.dhl.com/en/about us/logistics insights/global connectedness index 2012/gci results noflash.html
Figure 2.8 -DHL Global Connectedness Index 2012 World Map
In general, both indexes are useful for companies to define their objectives, goals, strategies, and execution plans of their global value chain considering countries political conditions and their impact on the chain.
On the whole, the fact that the supply and delivery processes at a global value chain imply more tasks, hidden costs, and stakeholders highlights the importance of both considering uncertainty on the planning process at Company X and developing a methodology to manage the human side of change to ensure a higher rate of success on the implementation of any improvement in the local and global set.
3
Non-Deterministic Supply Planning Process
In our everyday lives we see events that confirm what the Roman scholar Pliny the Elder said: "The only certainty is that nothing is certain." Changes are ubiquitous and the CPG industry is not exempted to them. Consumer behavior in the CPG industry has changed dramatically over the course of the years, and this situation directly affects Company X.
As explained in Chapter 1 and 2, challenges arose due to Company X's globalization as a response to fulfill the constant variations in customers' needs. The consequences of the new challenges make more plausible the importance to anticipate and plan for a range of possible futures as an intelligent method to deal with uncertainty (De Neufville and Scholtes, 2011).
It is important to mention that uncertainty does not necessarily mean only bad things could happen. Unexpected events can produce gains and losses. Thus, Company X should not only worry about downside risks, but also about upside potential when considering uncertainties in its planning process.
3.1 Current Planning Process
-
Base Case
The current planning process for any department in Company X, as in the majority of the companies, uses only point forecasts to evaluate the "viability" and "value" of a project and produces single number results. This planning process ignores the major uncertainties the project is likely to encounter. In the end, the company makes a decision based on expected results that are completely different from the reality of what the company will experience from making that decision.
This discrepancy between what actually happens to a project and the result from the current planning process used to evaluate and choose alternatives is mainly because the current process does not recognize two important facts: assumed conditions constantly vary and management will make adjustments during the course of the project in response to new circumstances. Furthermore, the analysis carries an error called the "flaw of averages" (Savage, 2009) and the analysts are not conscious of this huge mistake.
The "flaw of averages" means that generally it is incorrect to calculate the average value of a project
by using the average value of the parameters due to the asymmetry between gains and losses.
Mathematically speaking, this is because the models are non-linear and/or involve some discontinuity. In turn, the "flaw of averages" can produce a significant loss of potential value of the project because using the average conditions neglects to both insurance against losses in value and capture benefits from possible increases in project value. An illustration of the "flaw of averages" can be seen on Figure 3.1, which is an example from Sam Savage showing how using the average can mislead the evaluation process just as the statistician in the figure who drowned in a river that was, on average, three deep feet might have thought it was safe.
Figure 3.1 - Flaw of Averages
Regarding the planning process for the global supply chain, it generates the production plan, production schedule, and material plan in each mill (Azrielant, 2011). Figure 3.2 describes the general planning process at a typical mill in Company X. As noted, the process relies heavily on point forecasts to elicit important decisions. In fact, the objective of the first step is to produce "reliable" and "accurate" single-number forecasts. This planning process based on precise forecasts produces a production plan, production schedule, and material plan that do not consider the range of uncertainties around the forecasts and the possible asymmetry of any distribution due to assumptions and flaws stated on previous paragraphs.
Producoqn Manutaeinf P
Go?',"""" . E. A Schdde
rMpany Creah ter M ireach mate"a BOM
Figure 3.2 - Planning Process at a typical mill (Azrielant, 2011)
All things considered, the current planning process for the global supply chain leads to suboptimal
systems that have not captured the unreliability of the point estimations, so Company X needs to adopt a new planning paradigm that considers the range of circumstances that might occur and examine the entire distribution of consequences.
3.2 Dynamic Strategic Global Sourcing Planning Process
The proposed planning process for the global supply at Company X, called "Dynamic Strategic Global Sourcing Planning", recognizes uncertainties, both risks and opportunities, and includes strategies for dealing with them into the plans (De Neufville, 2000). This planning process is dynamic because it acknowledges uncertainty and the importance of having a plan that is adaptable over time to actual situations. It is also strategic due to the fact that it is built for both short and long term goals.
The Dynamic Strategic Global Sourcing Planning Process employs two key methodologies to global sourcing activities: Decision analysis and Real Options. Decision analysis is a structured method for considering uncertainties and evaluating the possible different results from all the choices evaluated at any decision stage. Real Options refers to the applications and theoretical extensions of the theory of financial options to the assessment of options associated with non-financial projects and activities. In this sense, an option is the right, but not the obligation, to take an action some time in the future.
The current planning process differs from the Dynamic Strategic Global Sourcing Planning process in that the latter adjusts over time to reality. This feature allows Company X to respond actively to the actual market circumstances and serve better to customers. An Excellent analogy for this new process is the one that Dr. Richard de Neufville uses to explain Dynamic Strategic Planning in general: "Doing dynamic strategic planning is comparable to playing chess: the planner thinks many
moves ahead, but only commits to one move at a time, retaining the flexibility to adjust the game plan according to the events as they unfold."
Essentially, the Dynamic Strategic Global Sourcing Planning contemplates three main tasks: acknowledge and understand uncertainties, conduct the dynamic analysis of the global sourcing situation, and build a flexible dynamic global sourcing plan.
3.2.1 Acknowledge and Understand Uncertainty
The constant changes in the world impact directly on consumer behavior at the CPG industry shaping new customer needs and, in turn, new production and supply requirements for companies within the industry. Therefore, acknowledging and understanding the major uncertainties that surround any forecast is the necessary starting point for a new dynamic strategic planning process. It is worth noting that understanding the uncertainties is as important as acknowledging them. The simple task of acknowledging uncertainties is not enough to consider them into the planning process on a proper way. A common and good approach to understand and define the magnitude and pattern of uncertainties is to look at historic data in similar situations. For circumstances where no historical data is available, an effective method is to look at comparable situations that have enough data to describe the uncertainties. Ultimately, the goal is to characterize the distribution of the uncertainties to be able to estimate the likelihood of the different outcomes.
In particular, for the situation described in chapter 2 that Company X is facing, it is useful to begin grouping the uncertainties in types for the managers to tailor effective risk-reduction and opportunity-exploitation approaches. Although uncertainty and risk are not the same, the majority of authors equate risks with uncertainties and most of the literatures are found under the risk management for supply chains. That said, the categorization exposed in the next paragraph says it
is intended for risks but it can easily be intended for uncertainties. In this paper and in the work done for Company X, the categorizations are used for uncertainties.
Several categorizations exist for sources of risks in supply chain. Some literatures consider only a few categories, like the one that encompasses all the risks sources in supply chains in three groups: Environmental risk sources, network-related risk sources and organizational risk sources, shown in Figure 3.3 (Juttner et al, 2003). Environmental risk sources contain any uncertainty from the supply chain environment interaction. Organizational risk sources lie within the boundaries of the supply chain parties. Network-related risk sources arise from suboptimal interactions between organizations within the supply chain.
Figure 3.3 -Risk Sources in Supply Chains (Juttner et al, 2003)
Other papers select more groups to classify the uncertainties and their drivers. A useful set of categories for managers includes delays, disruptions, forecast inaccuracies, systems breakdowns, intellectual property breaches, procurement failures, inventory problems, and capacity issues
(Chopra and Sodhi, 2004). To clarify, Figure 3.4 show the risk categories and their drivers.
Category of Risk Drivers of Risk category of Risk Drivers of Risk
Disruptions a Natural disaster Intellectual Property a Vertical Integralon of supply chain
L
labor dispute a CAobal outsourcing and markets
rcSupplia
bniesptcy
" War and terorism Procurement a Wcag rat risk
" Dependency on a single source of supply as well as the a Percentage of a key component or raw material procured capacity and responsieness of alternative suppliers from a single source
a Industrywide capacity utilitaon
Delays a High capacity utItation at supply source a longterm versus shortterm contracts
" inWeulbility of supply source
* Poor qualty or yield at supply source Recelfabees a Number of customers * ucessive handing due to border crossings or to change a Alacle strength of customes
in tmnspoation mdes inventory a ate of product obsolesece
Systems a Information lwfrastructure breakdown a inventory holding cost
a System Integration or aetensive systems networting a Product value
a &commerce a Demand and supply uncertainty
Forecast a inaccurate forecasts due to long lead tmes, seasonality. Capacity 0 Cost of capacity product variety. sort e cycles small customer base
a -ullwhlp effecr or information distortion due to sales promotions. Incentives lack of supply-chain visibility and exaggeration of demand in times of product shortage
a Capacty flibilty
Both groupings above allow Company X to acknowledge and understand uncertainties with a more structured approach. However, a proposed combination, in this thesis, of both categorizations will permit the management to be able to devise more effective risk-reduction and opportunity-exploitation strategies because this framework will help them to identify the drivers of each type of uncertainty and see if it arises due to the environment, organization, and/or network, as seen in Figure 3.5. From the interviews conducted with Company X employees, new drivers where identified and classified according to the grouping format proposed.
highlighted in Figure 3.5
These new drivers are
Environment Organization Network
Disruptions Natural Disaster Labor Dispute Supplier bankrupcy
War and Terrorism Dependency on a single source of supply Dependency on a single source of supply Seasonality (snow, hurricanes, storms, etc.) Changes in Standards and Processes Capacity and responsiveness of alternative suppliers
Political instability New standards in the network
Delays Excessive handling due to border Capabilities, competencies and mindset of the labor High capacity utilization at supply source
New regulations Inflexibility of supply source
Poor quality or yield at supply source Excessive handling due to border crossings or change in
transportation modes New regulations learning curve
Systems Information infrastructure breakdown Information infrastructure breakdown Information infrastructure breakdown
Disruptive software upgrades ERP implementation System integration or extensive systems networking Lack of IT renewal for new requirements
Forecast "Bullwhip effect" "Bullwhip effect" "Bullwhip effect"
Futures market that limit actual sales Inaccurate forecasts Forecasts without capacity constraint consideration Attrition of knowledgeable employees
Intellectual Property Global outsourcing and markets Different Company X's trademarks among countries Vertical integration of supply chain
Non-standard process for global intellectual property Different supplier's rights among countries Procurement Exchange rate risk Industry wide capacity utilization Exchange rate risk
Percentage of a key component or raw material Long-term versus short-term contracts Percentage of a key component or raw material
procured from a single source procured from a single source
Change regulations about currency for commercial Non-complete visibility of regional needs Industry wide capacity utilization
transactions Long-term versus short-term contracts
Lack of knowledge about suppliers' financial health Receivables Financial strength of customers Challenging cost center distribution Number of customers
Changes in requirements such as electronic receipt Financial strength of cutomers Multiple receivables agreements
Inventory Product value Inventory holding cost Rate of product obsolescence
Demand and supply uncertainty Product value Demand and supply uncertainty
Lack of trust that impedes inventory visibility Legacy safety stock level Lack of inventory visibility
Capacity Import requirements for machines Cost of capacity Non-updated capacity levels Local and regional people do not fulfill company's Capacity flexibility Lack of transparency about capacity levels
requirements Correlation with workforce's skill and mindset level
Figure 3.5 - Proposed Risk Categorization for Company X
Once the planning team has categorized the uncertainties and identified how much Company X contributes to their existence, the second part is to evaluate the impact of these uncertainties on the global sourcing process.
Keeping in mind that the objective of the planning team is to perform an effective analysis, the analysts should select a set of uncertainties that have significant planning consequences that need to be analyzed more in depth, which will be called drivers. The fewer drivers needed to complete a compelling dynamic analysis of the global sourcing the better because the number of scenarios increases exponentially with the number of drivers. The planners can use single-variable sensitivity analysis tools such as the Tornado diagrams, explained in Appendix A, and multivariable sensitivity analysis tools to select the drivers. The single-variable sensitivity analysis means the application change one input at a time, whereas the multivariable sensitivity analysis changes all inputs
The third and final step to acknowledge and understand uncertainties is to characterize the drivers according to the probability of their occurrence and their variability over time. For this task, planners need to analyze historical trends and identify trend-breakers.
The objective of examining historical data is to understand the past behavior to estimate future possibilities. For this purpose, planners should assess the quality of the data and acquire a thorough appreciation of the pattern.
For the quality of the data, analysts should first understand the procedures and definitions followed to record the data they are planning to use. For example, which date is recorded at the column "Ordered date"? Is it the date at which the purchase order was created? Or is it the date when the supplier was notified? This step will ensure that the data used is appropriate for planning and will serve for the standardization of the global IT-Systems and recording procedures at Company X. For Company X planners to acquire a thorough appreciation of the pattern and be able to characterize the uncertainties with the data selected, the planning team should use t-test, ANOVA, or multiple regression analysis as a primary statistic. For a second statistic, they can use chi-square test as a resource for the probability distribution fitting, which is the procedure of selecting a statistical distribution that best fits to the data selected of the variable analyzed by the planning team.
A tool was developed, during the research, to assist the planning team in the probability
distribution fitting procedure using chi-square test as a complement to the primary statistic tests Company X has tools for. This tool is explained in detail in Appendix B. This probability distribution fitting Excel tool makes the selection of the statistical distribution that best fits the data as easy and straight-forward as possible and, in turn, to ensure the implementation of this critical step of the
Dynamic Strategic Sourcing Planning Process.
The structured and scientific practice of acknowledging and understanding uncertainties allows Company X planners to develop valid models of random processes they deal with such as the global sourcing model. Therefore, after this essential step, they are able to perform a thorough dynamic analysis of the global sourcing process.
3.2.2 Dynamic Analysis of the Global Sourcing Process
For Company X, any change in the global supply chain affects the production plan, production schedule, materials plan, and delivery plan. Sooner or later, these alterations affect the bottom line of the company in different ways such as lost sales, low profit margin, and high level of inventories, among others. Therefore, the dynamic analysis of the global sourcing should involve examining all the possible decisions to maximize Company X value chain's flexibility while minimizing waste and variance.
As exposed previously, planners define the production plan, production schedule, and material plan based on point forecasts. For this task, they use a model to make any decision regarding the global supply chain. The existing model, considered as the base case, and the characterization of uncertainties are the basis for developing the dynamic analysis of the global sourcing process. The objective of the dynamic model is to obtain a distribution of possible results by using Monte Carlo simulation, invented in the late 1940s by Stanislaw Ulam, while he was working on nuclear weapon projects. It was named, by Nicholas Metropolis, after the Monte Carlo Casino, where Ulam's uncle often gambled (Metropolis, 1987).
Monte Carlo simulation provides an efficient and useful mean of quantifying the consequences of the uncertainties included in the model. It does this by sampling possible scenarios to cover all contingencies in proportion to their likelihood, calculating and storing the results for each scenario, and presenting the result in useful ways.
For adoption purposes, an Excel application to perform the dynamic analysis of the global sourcing process was built using the existing model that Company X planning team uses. This application samples Y uncertainty distributions N times and calculates the results for Z number of orders by running a Monte Carlo simulation using Excel's data table feature. The number of iterations, uncertainty distributions and orders are defined by the user up to a limit at which it was considered not efficient for the Monte Carlo simulation to last.
For the number of iterations, uncertainty distributions, and orders, planners face a trade-off between the time needed to run the Monte Carlo simulation and achieve a good representation of the distribution of the uncertainties. The higher the number of iterations, inputs, and outputs, the longer it takes to the computer to perform the simulation and the better the representation of the uncertainties. However, Company X planning team's time to make a decision depends on urgency (sometimes is less than 5 minutes, while in other occasions it could be more than 30 minutes), so they must limit the time needed by the computer to run the simulation by defining a maximum number of samples. For this reason, planners need to decide when an estimate of the distribution of the uncertainties is considered good, check the iterations required to achieve this representation, estimate the time needed to run a simulation with the number of iterations, Y uncertainties, and Z orders in question, and choose the best option when considering all this information.
Figure 3.6 illustrates how the representation of a normal distribution, with a mean of C6 in the figure, changes for four different numbers of iterations: 100, 250, 500, and 1000. This representation was done using the Excel's data table feature and normal distribution function. All the graphs presented in Figure 3.6 have the same twelve classes, so they are completely comparable. It is clear, from this example, how a higher number of iterations produces a better representation of the distribution of uncertainties. To illustrate, the probability of having samples above C9 is 5.00%, 3.60%, 3.60%, and 3.00% for 100, 250, 500, and 1000 iterations, respectively.
Figure 3.6 -Normal Distribution representation for different number of iterations
100 iterations 25 20 15 -10 5 0* C1 C2 C3 C4 C5 C6 C7 CB C9 C1I C11 C12 500 iterations 140 120 100 60 40 20 C1 C2 C3 C4 C5 C6 C7 CB C9 C10 C11 C12 250 iterations 70 60 50 40 30 20 0 10 0 CI C2 C3 C4 CS C6 C7 CB C9 C10 C11 C12 1000 iterations 300 250 200 150 100 0 C1 C2 ' C3 C4 C5 C6 C7 CB C9 C10C11 C12'
With respect to the time needed to run a simulation, the tests conducted during this research with a model consisting of 100 distributions of uncertainties and 100 orders at the same time yielded a time of 0.00018 seconds per iteration in the computers where the tests were done. Figure 3.7 compares the total time needed for different iterations based on the time per iteration obtained from the tests. This comparison clearly shows the benefits from running a simulation with only 100 samples; however, considering also the information in the previous paragraph, the decision of using only 100 samples might not be a good decision. Thus, the trade-off between better representation and time needed is an important aspect that could affect the implementation of this new dynamic analysis proposed, which is why different forms to overcome this and other implementation issues are analyzed in the next chapters.
Total Time needed (minutes)
35
Number of Distributions of Uncertainties 100 100 100 100 30
Number of Orders 100 100 100 100 25 --- --- --- -
-1 20
Time per iteration 0.00018 0.00018 0.00018 0.00018 is Total Time needed (secondsl 180 450 900 1800
t
os
--0
100 250 500 1000
Iterations
Figure 3.7 -Comparison of Total Time needed for different number of iterations
For the possible results for the orders, three categories were defined to reflect the main consequences of orders delivery time and identify the situations where the real options will be more valuable. Figure 3.8 presents an example of the output of the dynamic analysis tool. Category
0 (green color) means that although the uncertainties will affect the lead times, the materials will
arrive in the initial expected period of time. Category 1 (orange color) refers to the situation where the materials will arrive in a different range of time from the initial expected arrival period, but the order will be produced with no problems on production schedule and materials availability. Finally, Category 2 (red color) is the occasion when the order cannot be produced on schedule due to a lack of materials as a consequence for late arrival.
Ord 3MOrd 3M|Cde, #M+;'
Figure 3.8 - Dashboard of the Dynamic Analysis of the Global Sourcing Process Tool
As a result from the dynamic analysis of the global sourcing process, Company X planning team can identify the real options that may be most useful and add the most value to the global sourcing plan. Hence, the dynamic analysis enables the planners to develop a well-grounded Dynamic Strategic Global Sourcing Plan.
3.2.3 Dynamic Strategic Global Sourcing Plan
The Dynamic Strategic Global Sourcing Plan can increase expected value of the Global Sourcing Process. It does this by configuring the Global Sourcing Process, using real options, to perform better over the range of possible future circumstances. Real options enable Company X to avoid future downside risks and take advantage of new opportunities and, in turn, improve the expected value.
The main real options, studied and explained in the literature about this topic, Company X can consider are six: abandonment, deferral, scale, stage, switch use, and unlocking (Fichman et al., 2005; Tiwana et al., 2007, Hult et al., 2010). An abandonment option means that a project or investment can be terminated completely before it achieves its life without losing the remaining funds. This is different from the switch use option that allows redeploying investments or projects.
A deferral option enables to postpone a project or investment. A scale option permits the expansion
of a project or investment. A stage option makes possible to do a project or investment in incremental steps. Finally, an unlocking option refers to the situation when an investment or project creates the opportunity for future investments or projects previously not possible.
From the types of options explained previously, the best real options for Company X planning team will be the stage, scale, deferral, and unlocking options because they are easier to implement in the supply chain considering the raw materials are in transit and cannot be used for other purposes (switch use option), such as some important raw materials that fulfill specific purposes, and abandonment is not an option given that the product must be produced.
When including the real options into global sourcing plans, Company X planning team is building insurance into plans in the form of flexibility because these options will reduce downside exposure while simultaneously increase upside opportunities. As in the dynamic analysis of the global sourcing process, Monte Carlo simulation is a useful procedure for building the Dynamic Strategic Global Sourcing Plan because it provides a means of validating the use of real options in the global supply chain.
Company X planners can introduce real options into the global sourcing plans by defining rules in the dynamic model that will decide when and how to exercise the options. These rules are included in the model using "If, then" statements and should emulate what Company X would decide when dealing with a similar situation. For each iteration, Monte Carlo simulation calls on the rules, consults whether the conditions are met, and exercises the option in the cases where the conditions were fulfilled. The planners will be able to analyze the iterations where the options were exercised
due to the fact that Monte Carlo simulation records the results for each repetition. In the end, the real options will lead to a different distribution of possible developments than in the dynamic analysis of the global sourcing process and, in turn, create the Dynamic Strategic Global Sourcing Plan. An example of this new distribution of future developments and a comparison with the dynamic analysis can be seen in Figure 3.9 and Figure 3.10, respectively.
Figure 3.9 - Dashboard of the Dynamic Strategic Global Sourcing Plan
Dynamic Analysis of the Global Dynamic Strategic Global
Sourcing Process Sourcing Plan
Figure 3.10 - Comparison of Dynamic Strategic Global Sourcing Plan and Dynamic Analysis of the
Global Sourcing Process Dashboards
From the figures above, it can be seen that the Real Options Approach will permit Company X to
increase the value for a specific production schedule by introducing flexibility into the supply chain. Based on the results for the example illustrated in Figure 3.9 and Figure 3.10, Company X will be able to solve quickly problems on Orders #M+1, #M+2, #M+4, #M+6, #M+7, and N by introducing flexibility into the supply chain. This flexibility is introduced into the process by using the rules for exercising Real Options, such as deciding when to accelerate delivery of specific orders, agreeing with import authorities the orders authorizations' prioritization, defining receiving schedule on distribution centers, among others. As expected, the Real Options help moving orders from Category 2 (red color) to either Category 1 (orange color) or Category 0 (green color) and from Category 1 to Category 0. Categorization based on orders delivery time is explained in the previous section. In the end, this flexibility in the supply will emulate, in advance, the decisions management would make on specific situations so that planners can elaborate a reliable dynamic plan that, in turn, will introduce benefits for Company X such as waste reduction.
To sum up, the Dynamic Strategic Global Sourcing Plan enables Company X to be prepared for a broad range of uncertainties, respond to these changes as effectively as possible, and increase company's competitive advantage. It does this by including real options and committing to actions only one period at a time to adjust to conditions as they develop. Thereupon, the Dynamic Strategic Sourcing Plan henceforward must replace the prevalent single-number plan. The implementation methodology explained in the following chapters increases the success rate of this replacement by
much.
I 11,I(q #M Order #M+1 Order IM 2 4--H 4f,11 40
'It T1.
4t; 11 4 111
11-11 111T . 4 J;I 11-111 1-11 J* .
Oidei #M+3 Order #M+4 Older #M#!
1 W I "!-I 'llil 'Ilr . 1-l"I AF1. 11I I I-l" 1-l-: III r, I'll i'. li-11- W !%
Older #M+6 Oideo 1M+7 I hd , IN
J -Il '40 -11% 4