Curling Deformations in Cement Paste Slabs and Effects
of Shrinkage Reducing Admixtures
by
Eloy E. Martinez
Bachelor of Science in Civil Engineering
University of New Mexico, 1994
Submitted to the Department of Civil and Environmental
Engineering in partial fulfillment of the requirements for
the degree of
Master of Science of Civil and Environmental Engineering
at the
MASSACHUSETTS INSTITUTE OF TECHNOLOGY
February 1998
@ Massachusetts Institute of Technology, 1998. All Rights Reserved.
A
uthor ... ...
...
Dep
ment of Civil a
.nvironmental Engineering
January 16, 1998
Certified by ...
Professor OraB0uyukozturk
Professor of Civil and Environmental Engineering
A ccepted by ...
....
-...
.
. ...
Joseph M. Sussman
Chairman, Departmental Committee on Graduate Studies
Curling Deformations in Cement Slabs and Effects of Shrinkage
Reducing Admixtures
by
Eloy E. Martinez
Submitted to the Department of Civil and Environmental Engineering in February 1998, in partial fulfillment of the
requirements for the degree of
Master of Science in Civil and Environmental Engineering
Abstract
Curling stresses in concrete slabs poured on grade may be caused by both non-uniform temperature and moisture distributions through the slab thickness. If the gradients of tem-perature or moisture content are sufficiently high, very large stresses are induced which surpass the tensile strength of the material. Cracking results which then may serve as initi-ator sites for the ingress of external corrosive materials. Structural integrity may not be lost but serviceability of the structure is lessened due to the unsightly cracks. If corrosion of the reinforcement proceeds, staining and spalling of the concrete may ensue, further reducing the structures serviceability.
Due to the complexity of studying concrete slabs, such as the variation in effects of con-stituent materials such as coarse and fine aggregate type, quality and content, and the vari-ation of temperature due to varying external conditions, cement paste slabs were
investigated with the goal to predict curling stresses as a function of mix design, and time. A three phase study was developed to address: the design of new testing procedures to quantify curling deformations due to non-uniform moisture content in the slabs thickness, evaluation of the effects of a shrinkage reducing admixture on the curling phenomenon and moisture profile, and the development of a theoretical model to predict curling defor-mations and stresses resulting from uneven drying conditions of cement slabs.
Experiments were conducted using both normal and high strength paste mix designs with 0, and 5% replacement of mixture water by weight with a shrinkage reducing admixture (SRA), and 0, and 7.5% silica fume content. The time dependent mechanical and material properties measured were modulus of elasticity, compressive strength, shrinkage strains, and curling deformations. The addition of the SRA had varying effects on mechanical properties depending on the specific mix. The addition of the SRA reduced shrinkage strains by 40% in a 90 day period, and curling deformations by 60% up to 90 days. How-ever for very low water-to-cementitious ratios (W/C = 0.25), the admixed specimens curled more than the companion control specimens. A computer model was developed which predicts curling deformations.
Thesis Supervisor: Oral Buyukozturk
ACKNOWLEDGEMENTS
To begin I would like to express my heartfelt gratitude and appreciation to my aca-demic and research advisor, Professor Oral Buyukozturk, for his unwavering support throughout the course of this study. Through careful questioning and insightful comments he was able to suggest alternative courses of action in both the experimental and analytical developments.
I am extremely thankful for the financial support of W. R. Grace Construction
Products. I am also thankful in particular to Michael P. Dallaire, Neal S. Berke, and Maria Hicks for comments on the course of the experimental program. Jim Malone, Allen Dresseler, Gary Casey, and many other members of the support staff assisted me greatly in the preparation of testing molds and the acquisition and reduction of much of the test data. Through the attendance of many of the hosted talks at W. R. Grace Construction Products I was able to further my base area of expertise in cement and concrete additive technolo-gies.
I would also like to thank my office mates and compatriots for the many hours of discussion of key ideas related to this topic and their research in general. Through this intercourse I have developed a broader background in modeling of concrete systems, dete-rioration mechanisms, and retrofitting techniques.
For the unending moral support from my parents and siblings, thanks.
Finally, I would like to extend a very special thanks to Sara E. Dempster for the many long hours of discussion about the subtleties of surface chemistry and problem solv-ing in general.
TABLE OF CONTENTS
Title Page
1
Abstract
2
Acknowledgements
3
Table of Contents
4
List of Figures
7
List of Tables
12
Chapter 1 Introduction
14
1.1 Background 14 1.2 Problem Statement 151.3 Need for Enhanced Modeling Approaches 15
1.4 Objectives of the Research 16
1.5 Research Approach 17
1.6 Thesis Organization 18
Chapter 2 Literature Review
19
2.1 Introduction 19 2.2 Definitions 19 2.2.1 Curling 19 2.2.2 Shrinkage/Swelling 19 2.2.2.1 Autogeneous Shrinkage 19 2.2.2.2 Plastic Shrinkage 20 2.2.2.3 Chemical Shrinkage 20 2.2.2.4 Drying Shrinkage 21 2.2.3 Cracking Stress 22 2.3 Overview 23 2.3.1 General Background 23
2.3.2 Water-to-Cement Ratio, Cement Content, and Water Content 24
2.3.3 Microstructure 25
2.3.4Chemical Admixtures 25
2.3.5 Aggregate Content, Type, and Quality 26
2.3.6 Degree of Hydration 27
2.3.7 Curing Conditions 27
2.4 Shrinkage Models 27
2.5 Shrinkage Reducing Admixtures 33
2.6 Differential Shrinkage Strains 34
2.7 General Plate Theory 35
2.8 Summary 36
Chapter 3 Experimental Methodology
38
3.1 Drying Shrinkage Under Varied Environmental Conditions 38
3.1.1 Introduction 38
TABLE OF CONTENTS
3.1.3 Casting Procedures and Storage Requirements 39
3.2 Mechanical Properties 43
3.2.1 Introduction 43
3.2.2 Materials, Casting Procedures, and Storage Requirements 43
3.3 Curling Deformations 44
3.3.1 introduction 44
3.3.2 Materials 44
3.3.3 Casting Procedures and Storage Requirements 44
3.4 Microstructural Analysis 45
3.4.1 Introduction 45
3.4.2 Materials 45
3.4.3 Casting Procedures and Storage Requirements 46
3.5 Moisture Profile Study 46
3.5.1 Introduction 46
3.5.2 Background Information on Electrochemical Impedance Spectroscopy 47
3.5.3 Materials 52
3.5.4 Specimen Preparation, Casting Procedures, and Storage Requirements 52
3.5.5 Summary 53
3.6 Summary 54
Chapter 4 Experimental Results
564.1 Drying Shrinkage 56
4.1.1 Introduction 56
4.1.2 Drying Shrinkage Performance of High Water-to-Cementitious Ratio
Mixes 56
4.1.3 Drying Shrinkage Performance of Intermediate Water-to-Cementitious
Ratio Mixes 62
4.1.4 Drying Shrinkage Performance of Low Water-to-Cementitious Ratio
Mixes 64
4.1.5 Moisture Loss of High Water-to-Cementitious Ratio Mixes 68 4.1.6 Moisture Loss of Intermediate Water-to-Cementitious Ratio Mixes 72 4.1.7 Moisture Loss from Low Water-to-Cementitious Ratio Mixes 75
4.2 Mechanical Properties 80
4.2.1 Introduction 80
4.2.2 Compressive Strength 80
4.2.3 Compressive Modulus of Elasticity 84
4.3 Curling Deformation Study 86
4.3.1 Introduction 86
4.3.2 High Water-to-Cementitious Material Ratios 87 4.3.3 Intermediate Water-to-Cementitious Material Ratios 90
4.3.4 Low Water-to-Cementitous Ratios 92
4.4 Microstructural Analysis 93
4.4.1 Introduction 93
4.4.2 High Water-to-Cementitious Ratios 94
TABLE OF CONTENTS
4.4.4 Low Water-to-Cementitious Ratios 101
4.5 Moisture Profile Study 102
4.5.1 Introduction 102
4.5.2 EIS Background 103
4.5.3 One-half inch moisture profile EIS specimens 105 4.5.4 One inch moisture profile EIS specimens 109 4.5.5 Two inch moisture profile EIS specimens 111
4.5.6 Cylindrical EIS Specimens 113
4.6 Summary 114
Chapter
5
Analytical Modeling
115
5.1 Introduction 115
5.2 Drying Shrinkage 116
5.2.1 Introduction 116
5.2.2 Moisture Transfer in Cementitious Slabs 117 5.2.3 Transient Constant Diffusivity Analyses with an Infinite Rate of
Evaporation 119
5.2.4 Diffusion from a Permeable Layer on the Bottom Face and Infinite
Evaporation on the Exposed Upper Face 122
5.2.5 Finite Rates of Evaporation 123
5.2.6 Steady State Analyses 124
5.2.7 Summary of Simplified Analytical Analyses 125
5.2.8 Numerical Analyses 125
5.2.9 Shrinkage Functional 127
5.2.10 Application of Kelvin and Laplace Equations 130
5.3 Curling Deformations 132
5.4 Summary 138
Chapter 6 Conclusions and Future Research Needs
140
6.1 Summary 140
6.2 Conclusions 142
6.3 Future Research Needs 143
References 145
LIST OF FIGURES
Figure 2.2.1. Figure 2.2.2. Figure 2.4.1. Figure 2.6.1. Figure 3.1.1 Figure Figure 3.1.2 3.1.3 Figure 3.1.4 Figure 3.3.1 Figure 3.3.2 Figure Figure Figure 3.5.1. 3.5.2. 3.5.3. Figure 3.5.4. Figure 3.5.5 Figure 3.5.6 Figure 4.1.1 Figure 4.1.2 Figure 4.1.3 Figure 4.1.4Shrinkage behavior due to drying then wetting cycles Energy release rate failure criterion for a brittle material
Representation of surface tension effects in pore microstructure Differential shrinkage induced by non-uniform drying rates The modified comparometer used to measure shrinkage strains for for platelet specimens used in drying shrinkage study
Mold used to cast platelet drying shrinkage specimens
Standard mortar comparometer and typical paste specimen used in in drying shrinkage study
Mold for typical paste shrinkage prism Typical curling specimen mold
Curling measurement beam with typical specimen and electronic calipers
Simplified equivalent circuit for one layer of cement paste A sample Nyquist plot of a cement paste cylindrical specimen Nyquist plot of the complex impedance response of the equivalent equivalent circuit model
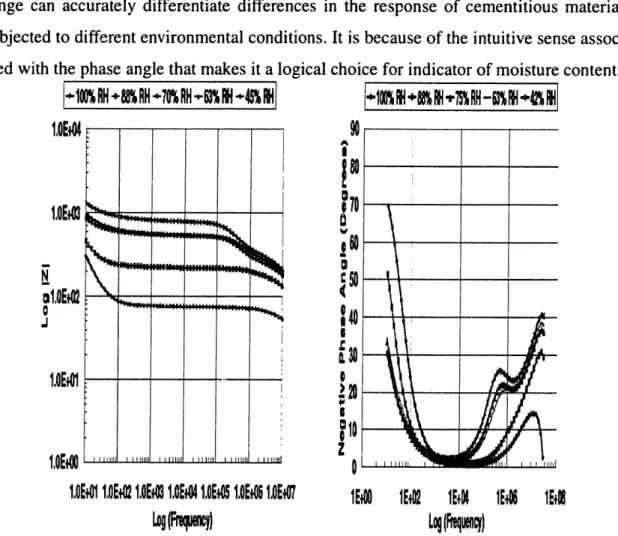
Bode plot demonstrating typical response for cement specimens stored in different constant environmental conditions
A typical concentric cylinder specimen Typical two inch EIS profile mold
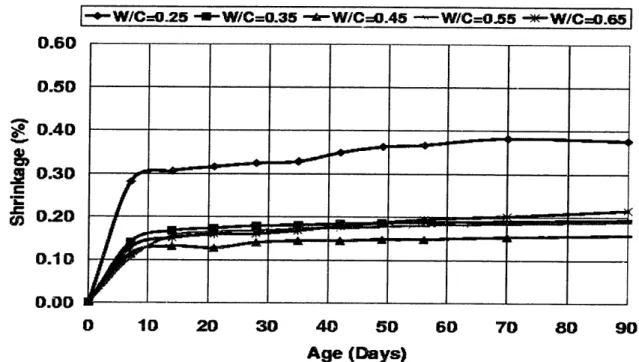
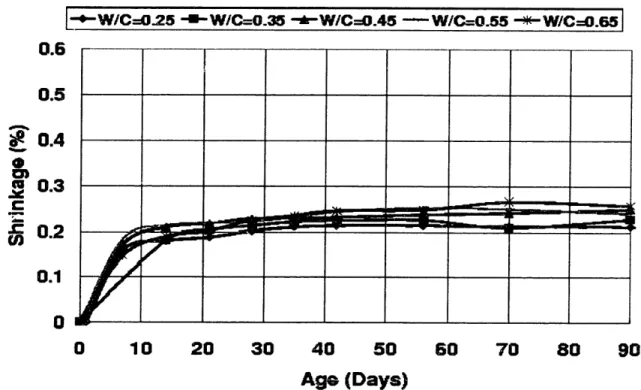
The drying shrinkage performance of the reference W/C = 0.55 paste mix
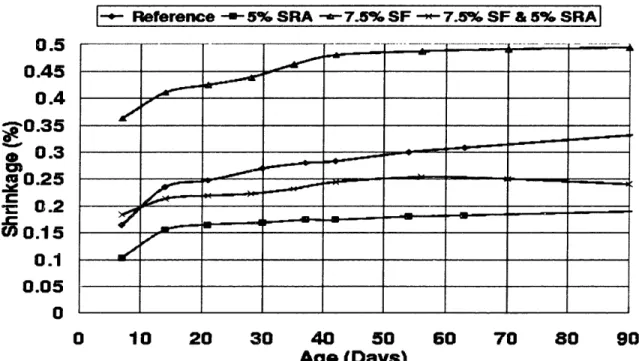
The drying shrinkage performance of the W/C = 0.55 with a 5% replacement of mixture water by weight with the SRA design mix The drying shrinkage performance of the W/C = 0.55 with a 7.5% replacement of cement by weight with silica fume design mix The shrinkage performance of the W/C = 0.55 with both a 7.5% replacement by weight of cement with silica fume and a 5% replacement by mixture water of the SRA design mix
22 23 29 34 40 40 41 41 44 45 48 48 49 50 52 53 57 58 59 60
LIST OF FIGURES
Figure 4.1.5 Figure 4.1.6 Figure 4.1.7 Figure 4.1.8 Figure 4.1.9 Figure 4.1.10 Figure 4.1.11 Figure 4.1.12 Figure 4.1.13 Figure 4.1.14 Figure 4.1.15 Figure 4.1.16 Figure 4.1.17 Figure 4.1.18 Figure 4.1.19 Figure 4.1.20 Figure 4.1.21 Figure 4.1.22The drying shrinkage performance of the W/C = 0.55 mixes at 42% RH
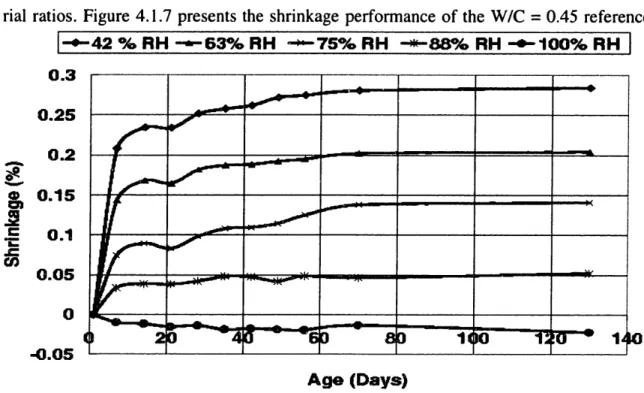
The shrinkage performance of W/C = 0.65 mixes at 42% RH The shrinkage performance of the W/C = 0.45 reference paste mix subjected to different constant environmental conditions
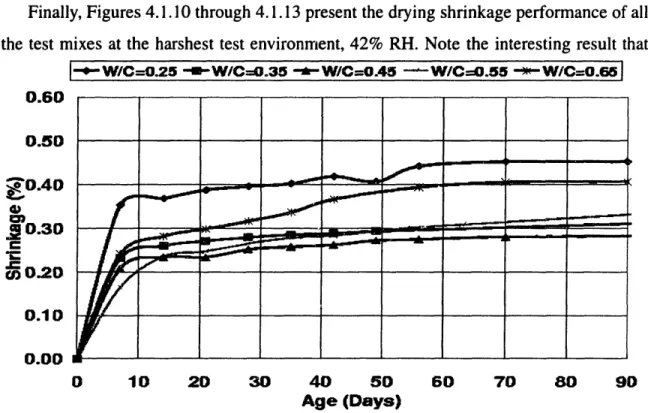
The shrinkage performance of the W/C = 0.35 mixes at 42% RH The shrinkage performance of the W/C = 0.25 mixes at 42% RH The shrinkage performance of all paste reference mixes at 42% RH The shrinkage performance of all the paste plus 5% SRA admixed mixes at 42% RH
The shrinkage performance of all 7.5% admixed silica fume paste mixes at 42% RH
The shrinkage performance of all the 7.5% silica fume plus 5% SRA admixed mixes at 42% RH
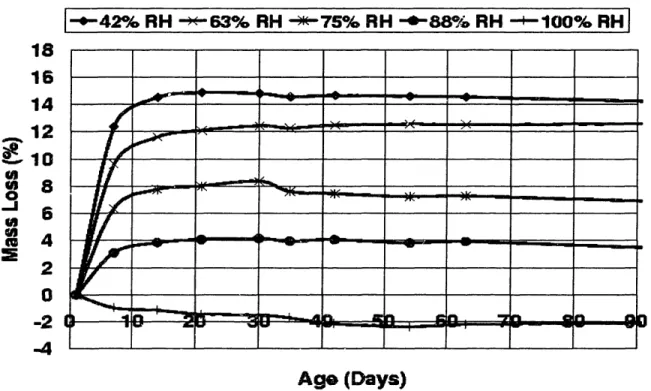
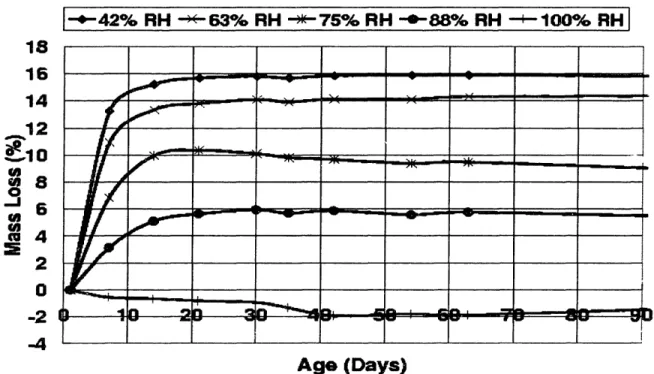
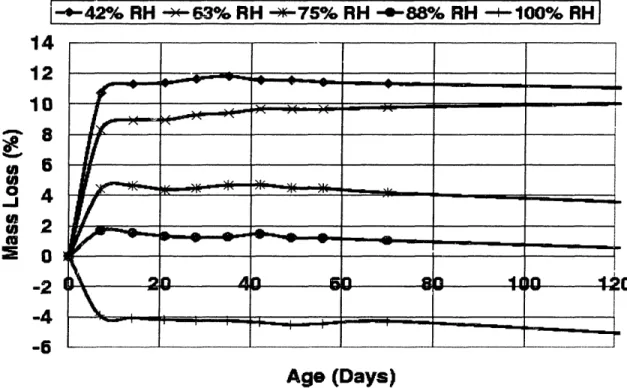
The average mass loss behavior of the W/C = 0.55 reference paste platelet specimens subjected to different constant relative humidity environments
The average mass loss behavior of the W/C = 0.55 5% SRA admixed paste platelets subjected to different constant relative humidity environments
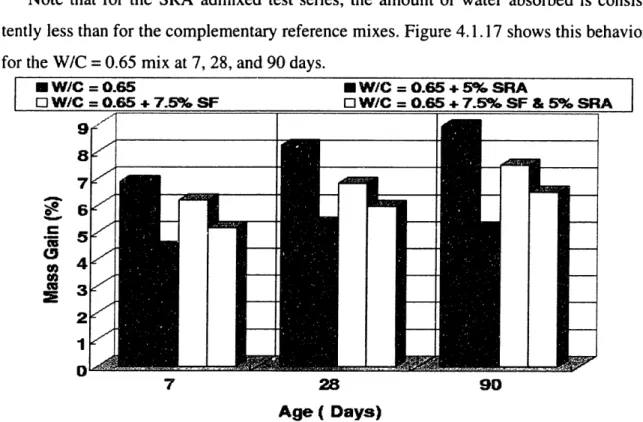
The behavior of the silica fume admixed test series subjected to the 42% RH environmental condition
The mass gain behavior of the W/C = 0.65 mixes at various ages in a fully saturated environment
The mass loss behavior of the reference paste WIC = 0.45 mix at various constant relative humidity environments
The mass loss behavior of the W/C = 0.45, 5% SRA admixed mix at several different constant relative humidity environments
Typical mass loss behavior for the W/C = 0.35 test mixes, 42% RH The mass loss behavior of the reference paste W/C = 0.25 mix The mass loss behavior of all W/C = 0.25 mixes at 42% RH environment 61 62 63 64 65 66 67 67 68 69 70 71 72 73 73 74 76 76
LIST OF FIGURES
Figure 4.1.23 Figure 4.1.24 Figure 4.1.25 Figure 4.1.26 Figure 4.2.1 Figure 4.2.2 Figure 4.2.3 Figure 4.2.4 Figure 4.2.5 Figure 4.3.1 Figure 4.3.2 Figure Figure 4.3.3 4.3.4 Figure 4.3.5 Figure 4.3.6 Figure 4.3.7 Figure 4.4.1The mass loss behavior of the reference paste mixes for all W/C ratios at 42% RH
The mass loss behavior of all 5% SRA admixed mixes at 42% RH
The mass loss behavior of all 7.5% silica fume mixes at 42% RH
The mass loss behavior of all 7.5% silica fume with 5% SRA mixes at 42%RH
The averaged compressive strength behavior for the W/C = 0.25 mixes
The averaged compressive strength for the W/C = 0.25 cube specimens at 7 days
The averaged compressive strength behavior of all mix design cube specimens at 28 days
The compressive modulus of elasticity of the various mixes at 7 days
The compressive modulus of elasticity determined at 28 days Prolifigram of reference paste W/C = 0.65 mix at various ages Comparison of center-line deflection reductions for the reference and the silica fume admixed series, W/C = 0.65
Curling reductions experienced by the W/C = 0.55 test series Center line curling deflections of W/C = 0.45 test mixes between 7 and 180 days
Reductions in curling center-line deflections of the W/C = 0.35 mixes
The reductions in curling deformations experienced by the W/C = 0.35 mixes
Reductions in curling center-line deflections for the W/C = 0.25 mixes
Normalized cumulative distribution of pore sizes for the W/C = 0.65 reference and 5% SRA admixed test series
78 78 79 79 81 82 83 85 86 87 88 89 90 91 92 93 94
LIST OF FIGURES
Figure 4.4.2 Figure 4.4.3 Figure 4.4.4 Figure 4.4.6 Figure 4.4.7 Figure 4.4.8 Figure 4.4.9 Figure 4.4.10 Figure 4.4.11 Figure 4.5.1 Figure 4.5.2 Figure 4.5.3 Figure 4.5.4 Figure 4.5.5 Figure 4.5.6The normalized cumulative distribution of pores for the W/C = 0.65 silica fume admixed test series with and without the SRA
The normalized pore distributions of the W/C = 0.55 reference paste and the paste plus a 5% replacement of mixture water with the SRA mixes
The normalized cumulative distribution of pores for the W/C = 0.55 silica fume admixed test series with and without the SRA
The normalized distribution of pores for the W/C = 0.45 paste mixes with and without the SRA
The normalized cumulative distribution of pores for the W/C = 0.45 paste plus 7.5% silica fume with and without the SRA mixes
The normalized cumulative distribution of pores for the W/C - 0.35 paste mixes with and without the SRA
The normalized cumulative distribution of pores for the W/C = 0.35 silica fume mixes with and without the SRA
The normalized cumulative pore distributions of the W/C = 0.25 reference paste and 5% SRA admixed mixes
The normalized cumulative distribution of pores for the W/C = 0.25 silica fume mixes with and without the SRA
Measured moisture profiles of paste and admixed one-half inch W/C = 0.45 SRA admixed specimens
Measured moisture profiles of W/C = 0.45 paste specimens Measured moisture profiles of the W/C = 0.55 SRA one-half inch EIS specimens
The measured moisture profile for the W/C = 0.55 reference one-half inch paste EIS specimen
The measured EIS response of the W/C = 0.45 with a 7.5% silica fume and 5% SRA addition
The measured EIS response for the W/C = 0.45 with a 7.5% silica fume addition 95 96 97 98 99 100 100 101 102 105 106 107 107 108 109
LIST OF FIGURES
Figure 4.5.7 Figure 4.5.8 Figure 4.5.9 Figure 4.5.10 Figure 4.5.11 Figure 5.1.1 Figure Figure 5.2.1 5.2.2 Figure 5.2.3 Figure 5.2.4 Figure 5.3.1The measured changes in phase angle with time for the W/C = 0.45 reference one inch EIS specimen
The measured changes in phase angle with time for the W/C = 0.45 SRA admixed one inch EIS specimen
The measured changes in phase angle with maturity for the W/C = 0.45 two inch reference paste specimen
The measured changes in phase angle with maturity for the W/C = 0.45 two inch SRA specimen
The mass loss behavior of the EIS moisture profile samples, W/C = 0.45
Changes in moisture content through slab thickness due to uneven drying rates between top and bottom surfaces of slabs
The 7 day profile measured and calculated for the W/C = 0.45 mix The calculated moisture profiles for a 1/2" cement slab with varied values of diffusivity
Changes in the calculated moisture content at a particular depth of a 1/2" cement slab through time
Description of the shrinkage functional following diffusional behavior
The calculated moisture profiles for a 1/2" cement slab with a W/C = 0.45 110 110 112 112 113 115 126 127 128 130 137
Table 3.1 Mix designs used in the drying shrinkage study
Table 3.2 List of saturated salt solutions used in environmental chambers Table 5.1 Theoretical magnitudes of stress calculated using the Kelvin and
Laplace equations
Table 5.2 Comparison of model and experimental center-line deflections at 28 and 90 days for the W/C = 0.45 reference and 5% SRA admixed mixes. Table A. 1.1 Shrinkage values for the W/C = 0.65 Reference test series
Table A. 1.2 Shrinkage values for the W/C = 0.65 5% SRA test series Table A. 1.3 Shrinkage values for the W/C = 0.65 7.5% SF test series
Table A.1.4 Shrinkage values for the W/C = 0.65 7.5% SF & 5% SRA test series Table A. 1.5 Shrinkage values for the W/C = 0.55 Reference test series
Table A. 1.6 Shrinkage values for the W/C = 0.55 5% SRA test series
Table A.1.7 Shrinkage values for the W/C = 0.55 7.5% SF test series
Table A. 1.8 Shrinkage values for the W/C = 0.55 7.5% SF & 5% SRA test series Table A. 1.9 Shrinkage values for the W/C = 0.45 Reference test series
A. 1.10 Shrinkage values for the W/C = 0.45 A. 1.11 Shrinkage values for the W/C = 0.45 A. 1.12 Shrinkage values for the W/C = 0.45 A. 1.13 Shrinkage values for the W/C = 0.35 A.1.14 Shrinkage values for the W/C = 0.35
A. 1.15 Shrinkage values for the W/C = 0.35 A. 1.16 Shrinkage values for the W/C = 0.35 A. 1.17 Shrinkage values for the W/C = 0.25 A. 1.18 Shrinkage values for the W/C = 0.25 A. 1.19 Shrinkage values for the W/C = 0.25 A. 1.20 Shrinkage values for the W/C = 0.25
5% SRA test series
7.5% SF test series
7.5% SF & 5% SRA test series
Reference test series 5% SRA test series 7.5% SF test series
7.5% SF & 5% SRA test series Reference test series
5% SRA test series 7.5% SF test series
7.5% SF & 5% SRA test series 39 43 130 137 149 149 150 150 151 151 152 152 153 153 154 154 155 155 156 156 157 157 158 158
LIST OF TABLES
Table Table Table Table Tablie Table Table Table Table Table TableLIST OF TABLES
Table Table Table Table Table Table Table Table Table Table Table Table Table Table Table Table Table Table Table Table Table Table TableA. 1.31 Mass loss values for the W/C = 0.45 7.5% ST A. 1.32 Mass loss values for the W/C = 0.45 7.5% SI A. 1.33 Mass loss values for the W/C = 0.35 Referen A. 1.34 Mass loss values for the W/C = 0.35 5% SR, A. 1.35 Mass loss values for the WIC = 0.35 7.5% SF A. 1.36 Mass loss values for the W/C = 0.35 7.5% SF A. 1.37 Mass loss values for the W/C = 0.25 Referen, A. 1.38 Mass loss values for the W/C = 0.25 5% SR) A. 1.39 Mass loss values for the W/C = 0.25 7.5% SF A. 1.40 Mass loss values for the W/C = 0.25 7.5% SF A. 1.41 Summary of Cube Strength, All Mixes
A. 1.42 Compressive Moduli of Elasticity, All Mixes A. 1.42 Curling Center-Line Deflections, All Mixes
A. 1.21 A.1.22 A.1.23 A. 1.24 A. 1.25 A. 1.26 A.1.271 A.1.28 A. 1.29 A.1.30
Mass loss values for the W/C = 0.65 Referer Mass loss values for the W/C = 0.65 5% SR Mass loss values for the W/C = 0.65 7.5% Sl Mass loss values for the W/C = 0.65 7.5% S& Mass loss values for the W/C = 0.55 Referen Mass loss values for the W/C = 0.55 5% SR Mass loss values for the W/C = 0.55 7.5% S] Mass loss values for the W/C = 0.55 7.5% SI Mass loss values for the W/C = 0.45 Referen Mass loss values for the W/C = 0.45 5% SR
wce test series
ýA test series
F test series
F & 5% SRA test series ice test series
A test series F test series
F & 5% SRA test series ice test series
A test series F test series
F & 5% SRA test series
ce test series A test series F test series
S& 5% SRA test series ce test series
A test series
test series
& 5% SRA test series 159 159 160 160 161 161 162 162 163 163 164 164 165 165 166 166 167 167 168 169 170 171
Chapter 1
Introduction
1.1 Background
Deterioration experienced by infrastructure due to unforeseen modes of failure in concrete structures has significant social and economic implications. Durability is one of the most important considerations that an engineer must address when planning and designing new structural systems. Cyclic loadings due to mechanical and temperature effects can cause the initiation and propagation of cracks. These cracks then serve as rapid transport sites for external corrosive agents such as carbon dioxide, carbon monoxide, de-icing and/or marine salts, and sulfates. Once these agents penetrate the cover layer of concrete and reach the steel reinforcement corrosion may initiate and then propagate. Since the prod-ucts from the corrosion reaction occupy a greater volume than the original material hydraulic stresses develop further cracking the cover concrete. This may lead to unsightly cracking, staining, and at later stages spalling. Structural integrity may not be compro-mised, but serviceability certainly is. Therefore, designers should account for any sources of premature cracking of structural members.
One source of cracking typically not accounted for in conventional design practice are those cracks caused by excessive curling stresses due to restraint of curling deformations. These deformations arise due to non-uniform moisture and/or temperature profiles through the slab thickness. Although there have been several studies conducted with
regards to temperature related curling problems [Westergaard, 1926, Bradbury, 1938],
there is a gap in knowledge for curling in slabs due to moisture movement. Therefore the focus of this research is to study the fundamental mechanisms related to curling of cement slabs and use this information to develop an analytical model to predict curling deforma-tions due to moisture changes through the thickness of slab structures.
1.2 Problem Statement
The modeling of deformations of concrete slabs poured on grade due to external environ-mental conditions is a topic area of interest for the construction industry for the prevention of excessive cracking. Floor systems such as parking garages, industrial storage facilities, bridge decks, and even residential floors are affected by the early age curling deformations associated with moisture movement in slabs. Exposed surfaces dry at different rates than those insulated by subgrades. As drying proceeds a very non-uniform moisture profile occurs which results in differential shrinkage through the thickness of the slab.
The differential shrinkage occurs because the cement matrix in concrete expands slightly when saturated and shrinks when dried. Therefore in order to study the curling phenomenon, one must first understand the mechanisms of drying shrinkage and expand the knowledge gained from that field to curling. Recent advances in cement additive tech-nologies have occurred and several different types of shrinkage reducing admixtures (SRA's) have been developed. Hence, in order to fully address the problem of curling deformations this study will focus on both conventional as well as admixed neat cement slabs. Concrete is not addressed due to several complicating factors which arise due to the size, gradation, and quality of coarse and fine aggregate.
1.3 Need for Enhanced Modeling Approaches
The analysis of rigid pavements subjected to transverse loads and temperature variations has been conducted by many researchers [Westergaard 1926, Westergaard 1927, Bradbury 1938, Pickett 1946, Harr and Leonards 1959, Al-Nasara and Wang 1994, Mohamed and Hansen 1997], but the problem of variational moisture conditions through the thickness of the slab must still be addressed in detail. One of the earliest stress analysis for temperature effects on pavements was conducted by Westergaard in 1926. Later in 1938 Bradbury improved the analysis of Westergaard by developing a simple design chart to evaluate curling stresses in finite slabs with free edges. Moisture content was considered of second-ary importance in both analyses and nonlinear temperature effects were treated as equiva-lent linear distributions through the slab thickness. The stresses calculated with this assumption can grossly underestimate actual stresses [Mohamed and Hansen 1997]. Both
Westergaard and Bradbury modeled the slabs as plates fully supported on Winkler founda-tions which maintain full support during the lifetime of the structure. Many researchers have documented that full support of slabs does not occur [Harr and Leonards 1959]. Instead partial support is the rule, and the resulting stresses developed coupled with mechanical and temperature effects may be several orders of magnitude larger than those caused by simple wheel loads. Although Westergaard and Bradbury had to make the sim-plifying assumption of full contact and support, many designers to date use their theory as a design guideline to calculate curling stresses and deformations due to temperature effects.
There is insufficient research on the mechanisms of curling deformations caused by moisture, and there is a considerable need to fill this void of knowledge. There is also a need to take mechanistic work and translate it into readily available computational tools and guidelines so that the engineering community can address this important design prob-lem.
1.4 Objectives of the Research
Many modem designers have access to very sophisticated computational design tools, i.e. packaged finite element programs for the analysis of structural elements, but those in smaller design firms may not have the same access or expertise to use the available soft-ware. So these designers rely on the simplified theory postulated by Westergaard and Bradbury and most continue the practice of linearizing temperature distributions when conducting analyses and few bother to account for moisture effects at all. Therefore, the objective of this study is to develop in an evolutionary fashion a computational model to accurately predict curling deformations in cement slabs which may then be extrapolated to concrete slabs poured on grade.
Deformations are dramatically affected by the use of modern chemical admixtures that change the unrestrained drying shrinkage behavior of concrete. Therefore, a large portion of the study will address the basic mechanisms that these shrinkage reducing admixtures, (SRA), have on the microstructure of the cementitious composite, and how this then effects macroscopic response.
1.5 Research Approach
The planned course of study shall involve multiple phases conducted in parallel. The first phase is the study of the mechanisms involved in drying shrinkage and differential shrink-age induced by non-uniform moisture profiles in cement paste slabs. Cement paste was chosen as a simpler model than concrete which has natural variations in behavioral response due to the restraining components, i.e. type, quality, content, and grading of coarse and fine aggregate. The second phase provides the analytical modeling requisite to establish a computational tool to quantitatively predict changes in curling behavior as a function of mix design and time. The third and final phase is the implementation of the knowledge learned into the computational model. Comparisons are made between experi-mental and modeling results in this stage, and final conclusions drawn with suggestions for further research are given.
To address the drying shrinkage-curling problem from a phenomenological approach an extensive experimental program is designed with varied material parameters affecting bulk macroscopic properties such as compressive strength, modulus of elasticity, and modulus of rupture, as well as microstructural properties such as pore size distribution and permeability. Measurements are taken under varying environmental conditions to establish a relationship between moisture content and free shrinkage. Mass loss measurements will also be useful to determine rates of moisture flow from different mixes. To establish the shape of the moisture profiles for varying mixes, electrochemical impedance spectroscopy techniques will be used to establish trends on changes in cement dielectric properties as a function of curing condition, storage environment, and time. Curling deformations are induced in plate specimens by sealing five sides and allowing moisture movement only from the top surface. Measurements are taken in time and the specimens are stored in a constant environmental condition. The information obtained from the experimental pro-gram will be used to verify the analytical analysis to be conducted in the second phase.
The second phase of the study is to develop an analytical model of drying behavior of cement and correlate this information with drying shrinkage to calculate the residual stresses and deformations experienced slabs. Considerable work has been previously done in the area of uniform and linear temperature gradients in slabs to calculate induced
responses. Moisture effects are therefore modeled using similar assumptions, except non-uniform moisture profiles are accounted for. This portion of the study treats the slab response independent of restraint and boundary conditions due to subgrade reactions.
The final phase of the study is to use the analytical model as the basis for computa-tional model which can accurately predict the curling behavior of cement slabs accounting for mix design and the passage of time. The requisite comparisons with experimental results are conducted.
1.6 Thesis Organization
Chapter 2 of this thesis provides a succinct literature review of factors affecting drying shrinkage and curling deformations. Current analysis techniques will be presented and problems associated with the simplifying assumptions used for these techniques will be discussed.
Chapter 3 presents the experimental aspects of this work. New testing techniques for quantifying drying shrinkage as a function of moisture content, curling deformations, and moisture profiles as well as standardized testing for mechanical properties will be pre-sented. Chapter 4 discusses interesting trends found in the results for both conventional mixes and those admixed with SRA's.
Chapter 5 describes the analytical modeling of drying and the relations used to corre-late moisture content to shrinkage strains. The computational model will also be pre-sented. This Chapter also compares experimental results with the predicted curling behavior given by the computational model. Any discrepancies are discussed as well as further suggestions to obtain additional required data.
The final chapter will summarize the work accomplished, draws conclusions and makes recommendations concerning future work. Comments on further possible refine-ments of the newly developed testing techniques as well as possible applications of the moisture profile technique to field conditions are made.
Chapter 2
Literature Review
2.1 Introduction
This chapter presents the necessary background information. Basic definitions of technical terms are presented first. A discussion of general background information concerning con-crete and cement paste and then the key models proposed for drying shrinkage are pre-sented. A short discussion pertaining to shrinkage reducing admixtures is presented, and then correlation between drying shrinkage and curling deformations is discussed. Finally, some of the modeling assumptions and restrictions presented by previous researchers to predict curling deformations in plate structures are discussed.
2.2 Definitions
2.2.1 Curling
Curling, also called warping, is the distortion of an originally planar member into a curved surface. For concrete or cement slabs the curling deformations are induced by non-uni-form moisture or temperature profiles through the slab thickness [Ytterberg, B 1987]. 2.2.2 Shrinkage/Swelling
Neville defines shrinkage/swelling as the volumetric change in concrete or cement [Nev-ille 1996]. Drying causes a decrease in volume, i.e. shrinkage, while wetting causes in increase in volume, i.e. swelling. This volumetric change may be induced by several dif-ferent mechanisms and so is further subdivided as: autogeneous shrinkage, plastic shrink-age, chemical shrinkshrink-age, and drying shrinkage.
2.2.2.1 Autogeneous Shrinkage
Autogeneous shrinkage occurs due to the consumption of internal moisture content from hydration reactions also referred to as self-desiccation. According to the Power's model of cement paste, mixes with water-to-cement ratios greater than 0.38 contain sufficient water to completely hydrate [Soroka 1972]. For lower water-to-cement ratios Neville reports
that autogeneous shrinkage may increase depending on the rigidity of the microstructure. One can expect higher values of autogeneous shrinkage with increasing temperature, higher cement contents, finer ground paste, and pastes which contain high values of trical-cium aluminate and tetracaltrical-cium aluminoferrite. Due to the restraint of aggregate particles and the hydrated structure of paste the autogeneous shrinkage in concrete is often an order of magnitude lower than in paste [Czernin 1962]. Pickett addressed this problem in the early forty's and developed a the following relation:
S = So(1 -g)a (2.1)
where S is the shrinkage of the mortar or concrete, So is the shrinkage of the paste, g is the proportion by volume of aggregate in the unit volume of concrete, and finally oX is the con-stant derived from the compressive modulus of elasticity of the aggregate and the cement paste. Hence the model for shrinkage and curling deformations for paste should account for autogeneous shrinkage while for concrete it may be ignored.
2.2.2.2 Plastic Shrinkage
Plastic shrinkage describes the shrinkage that occurs prior to cement setting caused by moisture loss, i.e. bleeding and evaporation from the top surface of the slab and capillary suction in subgrades at lower moisture contents than the slab. The rate of moisture loss is affected by temperature, convective forces, anid ambient relative humidity. Plastic shrink-age occurs when the mix still acts like a very viscous liquid. As soon as the rigidity of the matrix is sufficiently high, plastic shrinkage ceases. Surface crazing or cracking may occur, but can be prevented if the structural member is wet cured. Dry subgrades should be avoided to prevent moisture loss from the bottom surface of the slab. The interest of this thesis is on the material behavior of cement after setting has occurred, so this type of shrinkage is not addressed in the modeling section.
2.2.2.3 Chemical Shrinkage
Chemical shrinkage is a blanket terms used to describe shrinkage or swelling changes resulting from chemical reactions, such as thermal shrinkage, dehydration shrinkage, crys-tallization shrinkage, and carbonation shrinkage. Since these types of shrinkage predomi-nately occur close to the setting time they also shall not be included in the analytical modeling section. Carbonation shrinkage will only effect the outermost layers of
mens and so plays a small role in typical sized specimens, however for very small speci-men it may play a larger role. The small scale specispeci-mens used in this study were not sealed in a CO2 free environment and hence may experience some problems due to this
phenom-enon.
2.2.2.4 Drying Shrinkage
The final type of shrinkage to be defined plays the largest role in the typical environments of interest for this study. The environment range of interest is between 40-100% relative humidity (RH). This type of environment is typical of moderate climates such as those experienced in the Eastern United States. Drying shrinkage is defined as the negative volu-metric change induced by the removal of moisture. Drying shrinkage is composed of two parts, reversible and irreversible drying shrinkage. Irreversible drying shrinkage is that portion of drying shrinkage is not recoverable. Most of the irreversible drying shrinkage occurs during the initial drying period, with subsequently smaller percentages from addi-tional wetting-drying-rewetting cycling [Neville 1996, Czernin 1972, Soroka 1979]. This may occur due to reorganization of microstructural bonds when gel particles come in close enough contact. Soroka comments that the reorganization of bonds occurs to reduce the free surface energy of the system [Soroka 1979]. This idea is also postulated by Scherer, but with respect to sol-gels [Scherer 1992, A, B]. For very low external relative humidity environments, the percentage of irreversible drying shrinkage increases. Reversible drying shrinkage is caused by the alternating storage of specimens under dry and wet conditions and is the portion of drying shrinkage which is recoverable. Figure 2.2.1 depicts the shrinkage behavior of a paste due to typical drying rewetting drying cycles [Adaptation of figure given by Soroka 1979, Neville 1996]. One should note that since a primary source of moisture movement in cement paste is diffusion, there is a size effect which must be accounted for when comparing data from different sized specimens.
Typical values of drying shrinkage for concrete are between 400 to 800 millionths [Ytterberg 1987, A]. Larger ranges are possible depending on a number of different fac-tors. The factors which affect shrinkage include water-to-cementitious ratio, water and cement content, the microstructure of paste, the use of chemical admixtures, aggregate content, type and quality, the degree of hydration, and the curing conditions [Soroka 1979,
Neville 1996]. These factors will be further discussed in the overview portion of this sec-tion.
I-> Q)
Figure 2.2.1. Shrinkage behavior due to drying then wetting cycles.
2.2.3 Cracking Stress
Cracking in cement takes place whenever the general state of stress exceeds the intrinsic strength of the matrix. Due to the heterogeneity of the paste structure, the failure envelope for cement is radically different than that of metals. Cement paste is able to carry signifi-cant loads in compression while its tensile strength is typically one-tenth of its compres-sive strength. From classical linear elastic fracture mechanics, the theoretical strength of a material is dependent on the strength and type of intermolecular forces and intermolecular spacing. This calculated value typically exceeds measured values by three orders of mag-nitude.
The difference in strengths is due to the presence of cracks or flaws in the material which experience very high stress concentrations when subjected to external loads [Grif-fith 1920]. Grif[Grif-fith developed a criterion for cracking of brittle materials based upon energy release rates. He considered an elliptical crack, and calculated the associated decrease in elastic strain energy in a plate due to the formation of this type of crack. Next he suggested that in order for a crack to propagate that a critical energy release rate must be reached, i.e. the strain energy release rate must equal the energy release rate associated with creating new crack surfaces. This is succinctly represented by the expression
'2
a cE=) __(4Ysva) (2.2)
which upon simplification results in the classic Griffith equation 2 a = :E (2.3) ?... _ M e P) 3 vl o, r r · C r vl
where a is the applied stress, a is the crack half size, E is the materials modulus of elasticity, and Ysv is the solid-vapor interfacial surface energy. Since the flaw size is in the denominator of the expression, it is expected that larger flaw sizes will decrease the strength of the material. Also, the solid-vapor interfacial energy should decrease as a func-tion of increasing internal relative humidity, thereby decreasing the strength of the mate-rial. The interfacial energy is measured indirectly by comparing the strengths of specimens subjected to different relative humidity environments. The failure criterion is clearly represented in Figure 2.2.2 [adapted from Soroka 1979].
Required Interfacial Surface :rgy =4aYsv
:leased Strain Energy (7a2a2)/E
Half Crack Size, a
Figure 2.2.2. Energy release rate failure criterion for a brittle material.
When the energy release rate becomes critical, that is at impending motion of the crack, the slope of the required interfacial energy equals the slope of the parabolic relation for critical strain energy release.
The significant difference between the strength in tension versus compression in cement paste is the fact that in tension the energy release rate increases with crack size, and the first activated crack is the critical crack. In compression, the release rate is con-stant and independent of crack length, so multiple cracks may grow in a stable manner until the multiple cracks grow and/or coalesce to a sufficient size to cause failure [Soroka 1979].
2.3 Overview
2.3.1 General Background
Concrete is a complex particulate composite composed of stones and sand (the aggregates up to 70% of composite) that are held together by an adhesive. This adhesive is generally a
~ p, E: W
Portland cement mixed with water and a few specialty admixtures added to obtain specific enhanced material properties. Portland cement is manufactured by firing a controlled mix-ture of chalk, CaCO3, and clay at high temperatures. The clay is made up of Alumina,
Sil-ica, and water.
To describe the processes and reactions more succinctly, a reduced nomenclature is introduced: Lime, CaO, is denoted by C, Alumina, A1203, by A, Silica, SiO, by S, Ferrite,
Fe203, by F, and water, H20, by H. When the Portland cement is mixed with water during
the batching process, a hydration reaction occurs that changes the microstructural charac-ter of the cement and binds the system together. The main constituents of cement clinker are tricalcium aluminate, C3A, Dicalcium Silicate, C2S, Tricalcium Silicate, C3S,
Tetra-calcium Aluminoferrite, C4AF, and gypsum, CS. The first hydration reaction involves the
constituents C3A, gypsum, and water. The reaction produces ettringite, C6AS3H32, in an
exothermal reaction. Ettringite is a crystalline structure and is responsible for the setting and early strength of concrete (first 2 -4 hours). Hydration reactions involving C2S, C3S,
and water produce calcium silicate hydrates, CSH, calcium hydroxide, Ca(OH)2 or CH,
and heat [Soroka 1979, Neville 1996, Czernin 1962]
Cement gel is what is responsible for the long term strength of the composite. It is the main bonding material and occupies approximately 70% of the solid matter in pure cement pastes specimens. The gels formed are covalently bonded in sheets and experience high surface forces between sheets. The gel pores are formed when fribillar rods grow from cement grains and interlock leaving areas with small microvoids exposed. Calcium hydroxide forms in small crystals that grow in interfacial regions. It can provide some strength to the composite, but usually orders of magnitude below the corresponding strength of gel particles.
What follows is a succinct review of the parameters which affect the microstructural character of typical mix designs. These same factors play roles in the response of mixes to drying shrinkage and hence curling deformations.
2.3.2 Water-to-Cement Ratio, Cement Content, and Water Content
Several authors have commented on the effects of water-to-cement ratio (w/c), cement content, and water content on shrinkage [Soroka 1979, Bazant and Whittmann 1982,
Nev-ille 1996] The trend for w/c ratios is that mix designs with higher values shrink more than those with smaller values at later time periods (in excess of 90, days). Mixes containing high cement contents usually experience increased shrinkage. Higher water content mixes also experience greater shrinkage values. All three factors have a profound impact on the microstructure.
2.3.3 Microstructure
The pore structure of the composite governs the effects of both bulk and microstructural properties. One of the most important measures of microstructure quality is permeability. Permeability is a measure of the ease or rate of transport of matter, solid, liquid, or gas, in a porous media. From electro-chemistry we know that the surface region of any body is, in a thermodynamic sense, more reactive than the interior. This fact is especially true where ratios of surface area to volume are very large, as in the porous networks of cementitious composites. Porosity is dependent on: curing temperatures, the size, shape and roughness of aggregate inclusions, the water to cementitious material ratio, the degree of hydration of the cementitious paste, and the uniformity of hydration products and inclusions in the mix after batching and setting [Neville 1996].
Three separate types of porous structures are generated during batching and setting: gel pores, capillary pores, and air voids. The state of water in the pores of a hardened cementitious composite matrix are described as: chemically bound, physically adsorbed, and/or free. Gel pores range in size from less than 0.5 nm to 10 nm. These micro-pores experience surface forces that intensely adsorb water and prevent it from forming a menis-cus. Capillary pores range in size from 10 nm to 15 lim. Water in these pores experience moderate surface forces. Finally macro-pores or air voids range in size from 15p.m and larger. The water in these pores have the properties of its body phase. Air voids and capil-lary pores affect the macro-mechanical properties of strength, shrinkage and permeability. Gel pores strongly affect shrinkage and creep of the cementitious composite [Neville 1996].
2.3.4 Chemical Admixtures
The addition of pozzolanic particles to the mix causes an additional set of hydration reac-tions to occur. The pozzolanic admixtures (fly ash and silica fume) react with calcium
hydroxide to form more CSH. Again, this reaction is exothermic and caution must be used to insure that excessive shrinkage and microcracking does not occur. Pozzolanic additives may be much finer particles than cement grains increasing the overall density of the matrix and reducing the size of the interfacial transition zone [Neville 1996].
Other admixtures generally used for manufacturing high performance cementitious composites are superplasticizers, air entraining agents, and recently drying shrinkage reducing admixtures. The data available for superplasticizers is indecisive. This may be due to the fact that the use of these admixtures allows mix designs to have decreased water and/or cement contents which increases shrinkage yet the rigidity of the microstructure matures quicker so it may be able to resist the higher tendencies to shrink. Air entrainment has little or no effect on shrinkage, because the pores size of these air voids are sufficiently large that when moisture is removed, surface forces of high intensity are not generated [Soroka 1979 Neville 1996]. However, excessively air-entrained mixes (i.e. > 10%) will have decreased rigidities which may allow for larger shrinkage values. Recent publica-tions on shrinkage reducing admixtures demonstrate that very significant reducpublica-tions are possible in the order of 20-50% depending on mix design [Berke et al. 1996]. That is why these types of admixtures are a key focus of the present study.
2.3.5 Aggregate Content, Type, and Quality
The aggregate particles in concrete or mortar serve as restraining agents against which the shrinking paste must conform. The content of and grading of both coarse and fine aggre-gates is important, because poorly graded mixes with low aggregate contents allow higher concentrations of free paste which may shrink and crack. Certain types of aggregates shrink less than others (i.e. granite, limestone, or quartz vs. dolerites, basalts, or mud-stones) and may also imbibe water from the mix further increasing volumetric shrinkage strains. The quality of the aggregates is dependent on the location from a quarry or other source that it is taken from and the weathering that it has been subjected to. Dirty aggre-gates, or aggregates covered with clay type materials will exhibit much greater shrinkage strains than equivalent cleaned aggregates since clay has a great propensity to shrink [Soroka 1979, Neville 1996].
2.3.6 Degree of Hydration
Soroka has reported a positive correlation between the degree of hydration and the amount of shrinkage that a given mix experiences. The higher the degree of hydration, the higher the gel content and the lower the capillary pore content. Since moisture loss from larger voids induce small or no shrinkage strains, the more mature microstructure shrinks greater [Soroka 1979]. Yet he cautioned that the effect is small since one requires a low relative humidity environment to empty the smallest pores and induce the shrinkage strains. Therefore the degree of hydration is of second order effects and may not need to be accounted for in an analysis.
2.3.7 Curing Conditions
The curing conditions and storage environments of mix designs play a major role in the development of microstructure, but a lesser role for drying shrinkage. Longer periods of curing delays drying shrinkage strains and allows the microstructure to mature by increas-ing matrix rigidity. Greater percentage content of gel pores in neat cement pastes due to longer curing periods may increase shrinkage values because there is less restraining material to resist the shrinkage, but these values may be offset by the fact that the matrix is quite rigid. So curing condition may also be of second order effects.
According to Neville, the length of curing is not important for concrete mixes. Steam curing dramatically reduces drying shrinkage values due to the increase in percentage of larger capillary and air pores. External storage environmental conditions affect drying rates and the ability of the generated stresses to be relieved by creep. Moist cured slabs exposed to very low ambient relative humidities may crack. The hygral conductivity in cement and concrete is very low and so for extended exposure conditions, evaporation due to convective currents plays a minimal role.
2.4 Shrinkage Models
There are four mechanisms which affect drying shrinkage [Soroka 1979]. These are: capil-lary tension, surface tension, swelling pressures, and the movement of interlayer water. The four most commonly referenced models associated with drying shrinkage and which make use of these mechanisms are attributed to: Power, Ishai, Feldman and Serada, and
Wittmann.
A succinct description of the four mechanisms and the relative humidity ranges of interest are first given then more detailed discussions as to a combination of the models for use in the course of this paper follows.
(1) Capillary tension [Taken from Soroka 1979]
The formation of a meniscus on drying results in tensile stresses in the capillary water. The tension in the water is balanced by compression in the solids causing, in turn, elas-tic decreases in the volume of the paste, i.e. shrinkage. This mechanism is reversible and is considered to be operative when the relative humidity exceeds 40%.
(2) Surface tension [Soroka 1979]
Surface tension may produce very high compressive stresses inside solid particles of colloidal size. Depending on the size and type of material of the particles, the effect of sur-face tension varies. It has been demonstrated that sursur-face tension is dependent on the amount of physically adsorbed water. Lower adsorption of water molecules induces higher surface tensions in gel particles while higher adsorption reduces the surface tension. This inverse relationship is due to the fact that the solid vapor interface is thermodynamically much more active, i.e. contains more energy, than the solid liquid or liquid vapor inter-faces. Therefore, on drying the compression in the gel particles increases causing shrink-age strains to occur. On rewetting, the surface tension decreases, and some of the compression in the solids is relieved, and the material swells.
(3) Swelling pressure [Soroka 1979]
The thickness of the adsorbed water layer is determined by the ambient vapor pressure and temperature. The interparticle spacing of gel plates may be less than the required thickness to accommodate adsorption of water layers, so a 'swelling' or 'disjoining' pres-sure is developed which tends to separate gel particles. When drying occurs this prespres-sure is relieved because the thickness of the adsorbed layer decreases.
(4) Movement of interlayer water [Taken from Soroka 1979]
Exit and re-entry of water into the layered structure of the gel particles causes volume changes due to resulting
changes in the spacing of layers, i.e. exit of water on drying causes volume decrease (shrinkage) and re-entry of water on wetting causes volume increase (swelling).
The dominant mechanisms related to the Power's shrinkage model are variations in swelling pressure augmented by the effects of capillarity. According to his model, these mechanisms covers the full range of relative humidity (0-100%). Ishai uses a different approach, applying variations in surface energy in the range of 0-40% RH and capillary tension affects from 40-100% RH. Feldman and Serada make use of the mechanisms of movement of interlayer water in the range of 0-35% RH and both capillary tension and variations in surface energy for relative humidities in excess of 35%. Finally Wittmann applies variations in surface energy and variations in swelling pressure in the ranges 0-40% RH and 40-100% RH respectively. For the purposes of this study, only those mecha-nisms which contribute to shrinkage behavior in relative humidity ranges exceeding 35-40% will be applied in the modeling section. For completeness of the discussion all
mech-anisms will be discussed further below.
The volumetric change in concrete has been partially attributed to the movement of water in gel and capillary pores. Cement paste that is subjected to a wet environment swells, whereas in drier conditions it shrinks. One mechanism that relates shrinkage to moisture movement is that of capillary tension (Please refer to Figure 2.4.1).
Figure 2.4.1. Representation of surface tension effects in the pore microstructure. The vapor pressure of a liquid is defined as the pressure at which liquid and vapor coexist in equilibrium. This means that the total number of molecules leaving the liquid phase into the vapor phase equals the total number of molecules leaving the vapor phase and entering the liquid phase. When evaporation takes place in a liquid, the total number of molecules leaving the liquid phase exceeds the number reentering it from the vapor. The
relative vapor pressure of a liquid is typically defined as the ratio of pressure over the liq-uid in its current state, P, over the saturated vapor pressure at the same temperature, P,.
When the liquid of interest is water, many researchers refer to the vapor pressure expressed as a percentile as relative humidity, RH. In cement systems, if the pore walls are exposed to the vapor phase of water, the energy state is higher than the associated liquid vapor surface energy. The system always tends towards the lowest energy state, and so a curved meniscus forms spreading the liquid phase across the exposed solid phase. The ten-sion in the liquid is related to the radius of the meniscus through the Laplace equation
a' = -2-Lv (2.4)
r
where the liquid tension is denoted by a', the radius of curvature of the meniscus is r, and yLV is the liquid/vapor interfacial energy. The form of the Laplace equation presented is that for right cylindrical pores with equi-sized in- and out-of-plane radii of curvature. The liquid is in tension when the radius of curvature is negative (which occurs during evaporation of pore liquid) and the pore water wets the solid phase surface. The relation between the radius of curvature, r, of the meniscus and the corresponding vapor pressure P is given by Kelvin's equation
In() - 2yv (2.5)
P(PO
RTpr
where Po is the saturation vapor pressure, yLV is the liquid/vapor interfacial energy or surface tension, R is the universal gas constant, T is the temperature in degrees Kelvin, and p is the density of the liquid. The Kelvin equation is applicable for pores in the ranges -5-5000 angstroms. For smaller pore sizes the concept of a meniscus breaks down, because the surface forces are so intense a meniscus cannot form. For larger pores sizes the Kelvin equation does not provide any useful information and BET techniques break down.
Returning to the expression, for a capillary pore experiencing no evaporation, the ratio P/Po = 1, and the surface of the water is flat, i.e. the system is fully saturated. Subsequent decreases in the vapor pressure occur when evaporation starts and the radius of the menis-cus becomes smaller until a critical point where it equals the radius of the pore. At that point it enters the pore and if further evaporation occurs the pore empties completely [Scherer 1992, Soroka 1979].
The relation helps describe why the large pores empty first and then progressively smaller pores as drying continues. Since drying rates are dependent on the pore sizes and distributions, this relation helps to explain, to a certain extent, why one would expect higher moisture loss as a function of increasing water-to-cement ratio early on.
The tensile stresses in the pore water are balanced by compressive stresses in the solid. These compressive stresses cause an elastic decrease in volume. The response of the solid network and subsequent elastic deformations are dependent on the skeletal rigidity. There-fore, for equi-distributed pore size distributions, pastes with higher elastic moduli will shrink less. This explains why pastes with lower water-to-cement ratios experience less shrinkage.
This mechanism can also explain why at early ages of drying there is a large amount of water lost with relatively little shrinkage. The large pores contribute little to shrinkage strains (see Laplace's equation above) and these are the pores that empty first. At later stages, the micropores become active and increased shrinkage is experienced with a decreased rate of moisture loss [Soroka 1979].
The forces experienced by the solid skeleton are related to the tensile force in the pore solution through the following expression:
fc = o'x Ac (2.6)
where fc is the compressive force, Y' is the tensile force in the liquid, and Ac is the
cross-sectional area of the water filled capillary pores. When a critical stage is reached during the drying process, a maximum value of shrinkage is obtained. Upon further drying some of the induced shrinkage strains should be recovered, and after complete drying full recovery must be expected if this mechanism holds. In general this behavior is not exhib-ited and so other mechanisms must be acting, because experimental results indicate that shrinkage continues until complete dehydration has taken place. The removal of water from interlayer CSH may account for the continued shrinkage strains observed.
The second major mechanism which affects drying shrinkage is attributed to the sur-face forces exerted by the colloidal particles. Sursur-face tension experienced by these parti-cles occurs due to the difference in electrostatic attraction of atoms or molecules at the surface versus the same type of atoms or molecules in the interior of the particle. The
inte-rior molecules are attracted/repulsed by their closest packed neighbors on all sides. Those on the surface have a complete plane where the attraction/repulsion of similar molecules does not occur, and the interaction between the solid surface and the gaseous interface is not in equilibrium. The surface contracts upon itself and so results in tensile forces. This 'surface tension' is defined as the force acting tangentially to the surface per unit length of surface. The units of surface tension are given as N/m. Energy must be applied to the sys-tem to increase the area of a surface. The units of surface energy are given as ergs/cm2.
Returning to the form of the Laplace equation, but applying it now to the solid surface, the solid vapor interfacial energy, y,., is related to the inverse of the radius of curvature of the particle. For simplified analysis, spherical particles are chosen with the relation then equal to
= 2y-
(2.7) r
For the colloidal size gel particles compressive forces can easily reach 250 N/mm'. This is of sufficient magnitude to induce reduction in volume of the solid gel. Adsorption
of water molecules on the surfaces of the gel reduce the interfacial tension and the gel expands elastically. A common expression relating changes in interfacial surface energies to shrinkage strains is [Soroka 1979]
Al= Esh= k(y - y,) (2.8)
where y and y,, are the solid-vapor interfacial energies at to different constant relative humidity environments.
This expression predicts a linear relationship between shrinkage strain and changes in solid-vapor interfacial energy. It is expected that this relationship will hold only for the adsorbed layers on the gel, and not for gels with excess moisture. As such it is only appli-cable to very dry specimens (stored in environments < 40%RH). For the purposes of this study, it will play a lesser role than a similar expression relating solid-liquid, liquid-vapor energies.
The third mechanism, swelling pressure is also commonly referred to as disjoining pressure. This pressure is generated when two gel particles are spaced close enough together that the number of adhered layers of water molecules typical of the given internal relative humidity are compressed. An easy way to picture this scenario is to imagine that
water adsorbed on a charged surface exhibits an ordered structure. When additional layers become adsorbed, the extent of order decreases further away from the solid surface. Typi-cal ordered ranges for cement gels are five molecular layers, or 13 angstroms. Because of the ordered nature of this water, if two parallel plates are spaced slightly under the thick-ness of the adsorbed layers (-26 angstroms) a pressure is generated. The ordered water is capable of bearing 'load'. The chemical potential of this water is then at a higher state then free water and diffusion towards the lower chemical potential water may take place. Some researchers use this idea as one of the basic mechanisms for creep. Higher relative humid-ities result in greater numbers of adsorbed layers and hence increase swelling. Lowers rel-ative humidities cause shrinkage. This is the primary mechanism involved in Powers model. Feldman and Serada discount this argument.
The final mechanism to be discussed is that of movement of interlayer water. Powers discounts the importance of this mechanism, while Feldman and Serada insist that this a governing mechanism for moisture movement at very low relative humidity environments, i.e. <35% RH). Movement of the interlayer water in the Feldman and Serada model is pos-sible both outwards during drying and inwards during re-saturation. The other models pre-sented consider the spacing between the CSH sheets fixed and once interlayer water leaves it cannot return. Hence the shrinkage is irreversible [Soroka 1979].
This concludes the discussion on the mechanisms which contribute to drying shrink-age. The most important one of interest in the range of environmental conditions applica-ble to this study is that of capillary tension. The next section presents a simplified explanation of how the shrinkage reducing admixture works. This information will then be applied and tested in the analytical modeling section.
2.5
Shrinkage Reducing Admixtures
Several new types of shrinkage reducing admixtures have been proposed both in Japan as well as in the United States [Ogawa et al., 1993, Fujiwara et al., 1994, Shah et al., 1992, Shah et al., 1997, Shoya et al., 1990, A, B, Tomita et al., 1986, Uchikawa 1994 ]. These admixtures are direct applications of the dominant mechanism described above. They are surfactants which reduce the solid-liquid, liquid-vapor interfacial surface energies in the