HAL Id: hal-03189522
https://hal.univ-lorraine.fr/hal-03189522
Submitted on 3 Apr 2021
HAL is a multi-disciplinary open access
archive for the deposit and dissemination of sci-entific research documents, whether they are pub-lished or not. The documents may come from teaching and research institutions in France or abroad, or from public or private research centers.
L’archive ouverte pluridisciplinaire HAL, est destinée au dépôt et à la diffusion de documents scientifiques de niveau recherche, publiés ou non, émanant des établissements d’enseignement et de recherche français ou étrangers, des laboratoires publics ou privés.
Transverse isotropic modelling of left-ventricle passive
filling: mechanical characterization for epicardial
biomaterial manufacturing
Jean-Philippe Jehl, Pan Dan, Arnaud Voignier, Nguyen Tran, Thierry
Bastogne, Pablo Maureira, Franck Cleymand
To cite this version:
Jean-Philippe Jehl, Pan Dan, Arnaud Voignier, Nguyen Tran, Thierry Bastogne, et al.. Transverse isotropic modelling of left-ventricle passive filling: mechanical characterization for epicardial biomate-rial manufacturing. Journal of the mechanical behavior of biomedical matebiomate-rials, Elsevier, 2021, 119, pp.104492. �10.1016/j.jmbbm.2021.104492�. �hal-03189522�
Transverse isotropic modelling of left-ventricle passive filling:
mechanical characterization for epicardial biomaterial manufacturing
Jean-Philippe Jehl1; Pan Dan1,3; Arnaud Voignier1; Nguyen Tran4; Thierry Bastogne2,5;
Pablo Maureira3,4; Franck Cleymand1.
1Université de Lorraine, CNRS, IJL, F- 54000 Nancy;
2Université de Lorraine, CNRS, CRAN, F- 54500 Vandœuvre-lès-Nancy; 3CHRU de Nancy, Department of Cardio-Vascular Surgery, F- 54000 Nancy; 4Université de Lorraine, INSERM, U961, F- 54000 Nancy;
5INRIA BIGS, F- 54000 Nancy.
Abstract
Biomaterials applied to the epicardium have been studied intensively in recent years for different therapeutic purposes. Their mechanical influence on the heart, however, has not been clearly identified. Most biomaterials for epicardial applications are manufactured as membranes or cardiac patches that have isotropic geometry, which is not well suited to myocardial wall motion. Myocardial wall motion during systole and diastole produces a complex force in different directions. Membrane or cardiac patches that cannot adapt to these specific directions will exert an inappropriate force on the heart, at the risk of overly restricting or dilating it. Accurately characterizing the mechanical properties of the myocardial wall is thus essential, through analysis of muscle orientation and elasticity. In this study, we investigated the Hertz contact theory for characterizing cardiac tissue, using nanoindentation measurements to distinguish different patterns in the local myocardium. We then evaluated the predictive accuracy of this model using Finite Element Analysis (FEA) to mimic the diastolic phase of the heart. Our results, extracted from instrumented nanoindentation experiments in a liquid environment using five pig hearts, revealed variations in elasticity according to the local orientation of the myocardial tissue. In addition, applying the Finite Element Method (FEM) in our model based on transverse isotropy and local tissue orientation proved able to accurately simulate the passive filling of a left ventricle (LV) in a representative 3D geometry. Our model enables improved understanding of the underlying
mechanical properties of the LV wall and can serve as a guide for designing and manufacturing biomedical material better adapted to the local epicardial tissue.
Keywords: cardiac tissue, muscular fibers, transverse isotropic behavior,
biomechanical modeling, finite element method.
1. Introduction
Biomedical materials for epicardial application have been extensively investigated over the past decades, with several different types of these materials having become clinically available (Gaetani et al., 2015; Pattar et al., 2019). Epicardial biomedical materials are usually designed as thin membranes containing diverse biological or mechanical properties and applied directly onto the target epicardial region. In general, these epicardial biomaterials can be used as hemostatic patches, creating an interface to prevent severe tissue adhesion following cardiac surgery, or as cardiac patches delivering cell therapy following myocardial infarction. However, research in this field has focused primarily on the biological or therapeutic behavior of these biomaterials, largely ignoring analysis of how they interact mechanically with the heart.
Once the biomedical material is adhered to the epicardium, however, it sustains the same cyclic strain and shear stress caused by the heart beating as the epicardium. The muscle fiber structure also differs from one area to another, thus exerting mechanical force in different directions during heart circulation, as well as at different locations (Bayer et al., 2012; Lombaert et al., 2012). However, only a few biomaterials are designed considering the myofiber orientation and structural specificity of cardiac tissue (Cui et al., 2020). Most epicardial biomaterials are manufactured as isotropic membranes, which cannot adapt to the specific muscle fiber structure of the heart, thus potentially applying inappropriate force to the epicardium, which could eventually cause a restriction or dilation effect on the heart.
Characterizing the mechanical properties of the heart wall, and particularly of the left ventricle, is thus of major importance for epicardial biomaterial design (Weinberger et
al., 2017). The fibrous nature of the heart has long been known, and the spatial
variation within the heart’s fibers has already been described, with computational models established accordingly. It is also well known that the muscle fascicles of the myocardium are arranged in three main directions, forming three muscle layers within the ventricular wall from the epicardium to the endocardium (Sánchez-Quintana et al., 1994). The combined effect of these differently-oriented fibers on the ventricular wall
can generate an average direction, and this direction varies from the apex to the aortic root (Freeman et al., 1985).
An ideal epicardial biomaterial should, instead, expand in the same way as the local epicardium. Due to the complex wall motion in play here, epicardial biomaterials should closely match the target zone of the heart, which means offering a similar elasticity and fiber structure. Thus, understanding the mechanical performance of the diastolic ventricle can guide advances in the design and manufacturing of epicardial biomaterials. For this purpose, a heart model with mechanical characterization during diastole could serve as an invaluable tool.
Furthermore, heart simulation models are also of great importance in medical research and training. Given the complex composition of the heart on both macroscopic and microscopic scales, it is hard to establish a model that can perfectly simulate all aspects of the heart, including the mechanical movement, electric activity, and pump function. Studies from the literature have so far focused on only one aspect of the heart, primarily contributing to advances in cardiology (Niederer et al., 2019).
Woods was a pioneer in using models to understand cardiac physiology and mechanics. In his study, the stress in the heart wall was considered as a thin-walled spherical shell (Woods, 1892). Modelling has since progressed to simulate in detail the anatomical and physiological complexities of the heart, and geometric models have been developed containing multiscale information of the heart (Chabiniok et al., 2016). It is now well known that cardiac muscle fibers run in parallel and form a 3D network enabling the heart wall’s complex motion during the cardiac cycle. Thus, for a better understanding of heart function, the anatomical architecture of these cardiac fibers should first be described. Three-dimensional models of myocardial architecture have been built up from detailed histological studies in the 1990s (Guccione et al., 1995; LeGrice et al., 1995). Since then, the development of invasive and non-invasive imaging techniques, such as CT and magnetic resonance imaging, has made it possible to construct patient-specific models of the beating heart to simulate its dynamics (Gilbert et al., 2012; Plank et al., 2009). However, the lack of detailed tissue structure information in significant amounts of image data still constitutes a significant failing in computational models and could influence model results.
Various numerical frameworks of heart architecture have been described in previous studies, based on different modeling methods(Chabiniok et al., 2016; Niederer et al., 2019). Benefitting from 3-dimensional cardiac imaging techniques, many authors have been able to build 3D models of the heart illustrating detailed fiber structures (Wang et
al., 2021). Furthermore, powerful numerical tools now enable the construction and
evaluation of models based on collected data. These numerical models are widely used in clinical and educational settings. For example, Finite Element Analysis (FEA) is a popular method for building and evaluating heart models with more detailed mechanical characterization (Martonová et al., 2021; Morgan et al., 2016). However, no study has yet presented the physical results of such simulations, such as overall local elasticity of the spatial arrangement of cardiac fibers. In this study, we evaluated the average fiber orientation and elasticity of the lateral part of the left ventricular wall in healthy pig hearts. We then built a numerical 3D model based on the obtained results, providing a simplified illustration of the complex fiber arrangement. We evaluated the method’s accuracy by simulating the diastole phase of a left ventricle.
2. Materials and methods:
2.1 Pig cardiac tissue sample preparation:
The samples used in this study were extracted from five healthy pig hearts provided by the School of Surgery of the University of Lorraine. Ethical approval for the study was obtained from our university’s ethics committee (committee number: 201922016556026) and then further validated by the French Ministry of Higher Education. The hearts were explanted during diastole for this study. One pig’s heart was fully filled with 0.9% sodium chloride and sealed to mimic the end of passive filling during diastole. We then performed computed tomography (CT) and 3D reconstruction of the heart. To prevent the cardiac tissue from drying out, the samples were rapidly immersed in a protective medium (optimal cutting temperature compounds) and frozen at −80°𝐶. For each heart, the lateral region of the left ventricular wall was selected for obtaining reproductive data (Figure 1A) and a 0.5-cm wide slice was extracted from the long axis (Figure 1B). The extracted tissue was then cut into 16 cytological slices, horizontally from the base to the apex of the heart, in two different thicknesses (100 µm and 10 µm, eight slices each) using a cryomicrotome, and stored frozen. The thicker slices were used later for mechanical characterization while the thinner ones served for muscle fiber structure observation.
Figure 1: A. A 0.5-cm wide slice was extracted from the lateral region of the left ventricle of each heart (green dash). B. Eight 100-µm and eight 10-µm slices were obtained from the longitudinal axis of the left ventricle, from the base to the apex. Slices of 100-µm thickness were used for indentation testing, 13x6 points were detected on each sample following the above planning and indentation parameters
2.2 Microscopic observation of muscle fiber orientation
Heart samples cut to 10-µm thickness were stained with DAPI (D9542, Sigma-Aldrich), for the nuclei, and Phalloidin (P5282, Sigma-Aldrich), for the actin, as per manufacturer’s instructions. Imaging was performed using fluorescent microscopy (Moticam 3000, Motic).
2.3 Indentation evaluation at different levels of the left ventricle:
The mechanical properties of the specimen were determined using a depth sensing indentation test. An ultra nanoindenter was used (ANTON-PAAR, Peseux, Switzerland), affording a penetration range of a few nanometers to 100 µm, using loads of 10 µN to 100 mN. The depth and load resolution were 0.003 nm and 0.01 μN, respectively. This tool is well suited to testing on biological materials in liquid medium, incorporating a sample holder adapted for biological tissue slices. This technique involves indenting the tissue using a spherical indenter of 100-μm radius (R). Just before we commenced mechanical tests to determine the properties of the cardiac tissues, the specimens were thawed then soaked in physiological serum to avoid any
dryness or premature destruction. To ensure that the tissue remained properly hydrated, the sample was kept in physiological serum during the entire depth-sensing procedure. The experiments were carried out at room temperature (21°𝐶). A 13x6 matrix of indentations was systematically performed on each specimen (78 measures). Each indented site was identified and microscopically analyzed. The contact surface disc generated by indentations did not exceed a radius of 30 μm.
The load and unload
speeds were intentionally kept low so as to guarantee the elasticity behavior of the
cardiac tissue.
Our previous experimental protocol showed that indentation speed
inferior or equal to 0.5mN/min allow a measurement of elasticity behavior other than
viscoelasticity behavior.
Furthermore, a 500-μm distance was maintained betweeneach indentation to avoid any interference from neighboring indentations (Figure 1B).
2.4 Measurement of Young’s modulus and sample fiber orientation
For the heart samples cut to 100-μm thickness, Young’s modulus was calculated based on the Hertz theory formula outlined below. We designed a strategy enabling us to define the range of values on commencing the load for which the Hertz theory can be applied. As a brief reminder, this theory establishes the relationship between the force applied (𝐹), the relative approach distance of the two elements (ℎ), and the radius of the disc contact area (𝑎) (1). These formulae also involve the radius of the indenter’s curve (𝑅!) and the mechanical characteristics of the sample and indenter,
i.e. their Young’s moduli and Poisson ratios, using the reduced elasticity modulus,
defined by Formula (3). ℎ = 1 "∙$! %&∙'"∙(∗!2 % ) * (1) with the bend radius 𝑅! defined as: %
'"= %
'$+
%
'% (2)
and the reduced Young’s modulus 𝐸∗ given by: % (∗= %,-! ( + %,-$! ($ (3)
In these equations, 𝐸, 𝜈, 𝑅., 𝐸/, 𝜈/, and 𝑅/ are the Young’s moduli, the Poisson ratios,
and the bend radius of the sample and the indenter, respectively.
Given that all samples had a defined thickness, the variation in Young’s modulus was caused by variations in the fiber orientation. According to the mechanism of cardiac muscle contraction, the Young’s modulus is minimal when the fibers are orientated
vertically and maximal when horizontally. Thus, the fiber orientation is calculated according to the measured Young’s modulus.
With a spherical indenter radius Ri<<Rs (plane sample), the equation (2) became Rc=Ri. Moreover, the diamond indenter’s Young’s modulus was higher than that of the sample (Ei≫E). Thus, equation (3) became 𝐸∗= 𝐸/(1 − 𝜈0).
Given the liquid medium used and the uncertainties associated with measurement using very low loads, we developed a strategy for exploring the initial moments of indentation. It enabled us to define the range of validity of (4) (contact point and end point of the applied Hertz Theory) while simultaneously determining the reduced Young’s modulus E*. For each test, data pairs (𝐹, ℎ) were first generated then equation (4) was used to identify the material’s characteristics. This equation is a Hertz logarithmic formulation that enables identification of the parameters of a linear function (Figure 2). ln(𝐹) =) 0ln(ℎ) + % 0ln 1 " %&.'.(∗!2. (4)
Figure 2. Example of optimization of indentation on one detected point. (A) Charging indentation curve obtained from detection.The initial point was determined once an elasticity behavior was detected. (B) Transformation of the experimental data of (A) into logarithmic curve (black), with a linear regression (red) obtained by applying Formula (4). (C) Reversal of the logarithmic curve issued from (B, red) into classical curved and crossmatch with experimental curve (black) to determine the optimized parameters
The indenter output a continuous value of elasticity within the indentation depth, the initial point was determined once an elasticity behavior was detected. As too deep detection was influenced by the underlying glass support (F increased sharply while H was beyond 15µm), the indentation had to be optimized. In order to obtain the optimal detection parameter, the experimental indentation curve of every point of detection was crossmatched with the theoretical curve (applying Hertz theory) to determine the individual hmax (8 µm as indicated by the cross point, in the case of Figure 2). A regular
2.5 Finite Element Analysis of left ventricle model
The 3D-reconstructed image of the heart from CT was transferred to Abaqus software. In brief, the 3D image was decomposed into 8 stratums with a cylindrical landmark on each stratum. A local rotation landmark, the mean orientation angle of fiber arrangement were also input into each stratum in the radial axis. The isotropic matrix was thus output for each point of mesh, in which the axis z correspond to the mean direction of fiber orientation, axis x for radial direction of left ventricle, axis y for longitudinal direction of left ventricle. Based on the measured Young’s modulus and average fiber orientation, FEA was applied to obtain the left ventricle (LV) model for the diastole simulation (LV passive phase). A tetrahedral quadratic mesh with 122170 nodes, of global size 4, and 83949 linear elements, was applied.
In order to test the feasibility of this numerical model’s mechanical evaluation, a simplified model was also constructed according to the CT measurement: the left ventricle was represented by a hollow cylinder with internal and external radii equal to 20 mm and 40 mm, respectively. The tubular height was 110 mm. A tetrahedral quadratic mesh with 94433 nodes, of global size 4, and 66492 linear elements, was applied.
2.6 Mechanical evaluation of a transverse isotrope model by FEM
The volume in the left ventricle increases during diastole phase and is correlated with the internal pressure. This heart cycle is known as the pressure-volume loop. Using the two numerical left-ventricle models, we progressively increased the internal pressure until a level equivalent to the end of passive diastole filling in order to evaluate the change in volume. The diastolic movement of the left-ventricle wall was also recorded.
3. Results
3.1 Young’s modulus and fiber orientation of left-ventricle lateral region
The Young’s modulus detected in the samples revealed the minimum value was 1´104
Pa, and maximum value 2.5.´105 Pa. The fiber orientation was thus defined as vertical
Fiber variations caused variation in Young’s modulus between 𝐸2 , 𝐸3 and Ei (El stands
for longitudinal Young’s modulus where fibers orientate parallelly to indenter, ET
stands for transversal Young’s modulus where fibers orientate perpendicularly to indenter and Ei is the measured Young’s modulus which is related to the fibers
orientation angle to be calculated). Where an ellipse can be considered representative of this evolution, Relation (5) can be determined and the local fiber orientation, 𝜃/, estimated as follows:
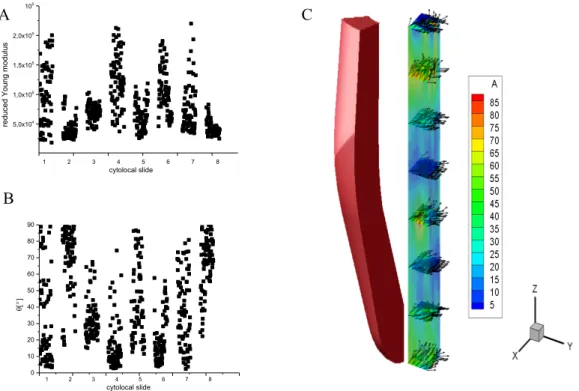
The Young’s modulus in the same sample was dependent of the location (Figure 3a). These variations were the result of mixed muscle fiber orientation and were calculated according to the measurement of the local Young’s modulus and based on the equation (5) (Figure 3b, c).
Figure 3. (A) Young’s modulus detected on eight heart samples cut into 100 µm; the value varied at different detection points. (B) Variation in fiber orientation between samples, according to Young’s modulus. (C) Representative figure of fiber orientation on different levels of left-ventricle lateral region, result issued from one pig heart out of five, the color-scale represent the fibers orientation angle.
5,0x10⁴ 1,0x10⁵ 1,5x10⁵ 2,0x10⁵ 2,5x10⁵ 1 2 3 4 5 6 7 8 cytolocal slide re du ced Youn g m od ulus 0 10 20 30 40 50 60 70 80 90 1 2 3 4 5 6 7 8 cytolocal slide q[°]
tan 𝜃
!=
𝐸
"((𝐸
!#− 𝐸
"#)
.
((𝐸
$#− 𝐸
!#)
𝐸
$(5)
A B CTo confirm the accuracy of the calculated fiber orientation, fluorescent microscopic images were taken of the same level. At the basal level of the heart, the general value of Young’s modulus was lower than the apex one. Accordingly, the calculated fiber orientation was more vertical at the basal (Figure 4A) than that found at the apex (Figure 4B). This calculated orientation was in accordance with the microscopic fluorescent observation. From the two-dimensional microscopic image, at the basal level, cell arrangement was predominantly in the “Y” direction, which was vertical to the indenter (Figure 4C). At the apex level, cell arrangement was in the “Z” direction, which was parallel to the indenter (Figure 4D).
Figure 4. Confirmation of calculated fiber orientation by microscopic fluorescent observation.
Representative image of Young’s modulus and individual fiber orientation at the basal (A) and apex (B) levels of the heart. Fluorescent microscopic images taken of the basal (C) and apex (D) levels
demonstrated a vertical (C) and horizontal (D) arrangement of muscle fiber arrangement. Muscle cells were stained with DAPI for nuclei and with Phalloidin for actin visualization. Scale bar: 100 µm
3.2 Construction of whole left-ventricle model using Finite Element Method
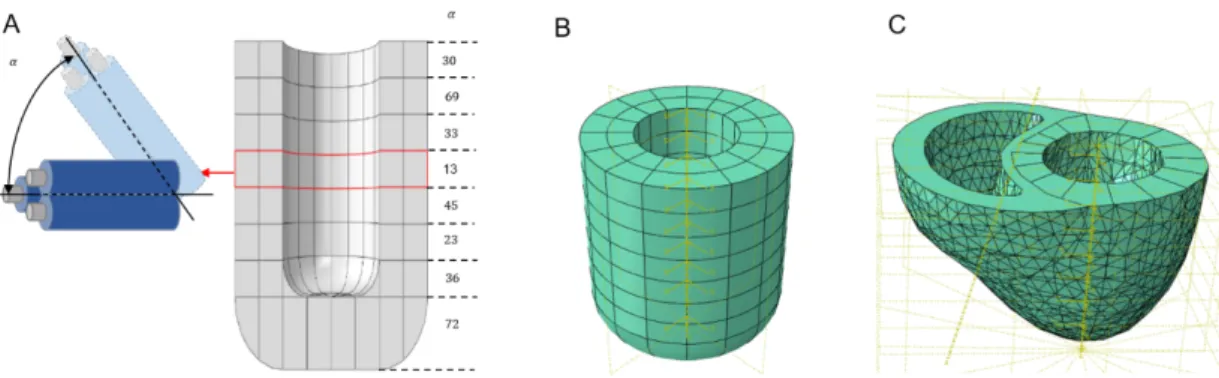
In order to construct the whole left-ventricle model, we assumed that the entire ventricular wall expanded in the same manner as the lateral region. Consequently, the transverse isotropic matrix (5) and average fiber orientation detected (Figure 5A) on eight different levels were introduced as parameters into an FEA. Thus, we constructed a simplified cylindrical model (Figure 5B) and a CT-based model (Figure 5C).
D B A C Z Y X Z Y X
Figure 5. Construction of 3D transverse isotropic model of left ventricle. (A) Average fiber orientation calculated from eight different levels of detected cardiac tissue. (B) Simplified cylindrical model based on average fiber orientation and tissue elasticity. (C) CT-based model constructed with average fiber orientation, tissue elasticity, and 3D abaqus data transferred from CT imaging of the same heart
We defined the transversely isotropic matrix using five independent coefficients: the longitudinal and transverse Young’s moduli, noted 𝐸4 and 𝐸3, respectively; the Poisson ratio in the isotropic plane, 𝜈33, and transverse plane, 𝜈43; a longitudinal-transverse shear modulus, 𝐺43 (6).
𝐶,%= ⎝ ⎜ ⎜ ⎜ ⎜ ⎜ ⎛ % (& − -&& (& − -'& (' 0 0 0 −-&& (& % (& − -'& (' 0 0 0 −-&' (& − -&' (& % (' 0 0 0 0 0 0 0(%6-'&) (' 0 0 0 0 0 0 𝐺43 0 0 0 0 0 0 𝐺43⎠ ⎟ ⎟ ⎟ ⎟ ⎟ ⎞ (6)
The symmetry of the stress tensors of the medium implies:
−-'&
(' = −
-&'
(& (7)
The transverse strain could not be measured using nanoindentation. In this work, we assume 𝜈43 = 𝜈33 ≃ 0.49 to the deformability of the fibers. The shear modulus, 𝐺43, is determined by the following empirical expression, taken from Lekhnitskii (1981):
𝐺43 =( ('(&
'(%60-'&))(& (8)
This formula was established for transversely isotropic rocks, also developed by Van Loocke for skeletal muscles (Van Loocke et al., 2006), and is applied here as a first approximation. All things considered equal, the elasticity matrix of the LV wall was
defined as follows in Table 1:
C1111 C1122 C2222 C1133 C2233 C3333 C1212 C1313 C2323
value 0.35 0.176 0.35 0.00137 0.00137 0.00138 0.0874 0.00226 0.00226
Table 1: transversely isotropic stiffness tensor
3.3 Mechanical evaluation of the numerical model of the left ventricle
To evaluate the diastole phase of the numerical model, progressively increasing pressure was applied to the ventricular cavity. The simulated ventricular pressure was increased from 5.5 mmHg to 11 mmHg, while the ventricular volume was accordingly increased to 112 mL in the CT-based model and 113 mL in the cylindrical model. This pressure-volume change was compared to a known Pressure-Volume loop issued from a healthy pig heart (Raake et al., 2019). The simulation demonstrated a linear change regression between pressure and volume, which was compatible with the detected P-V loop (Figure 7). This result indicated that the numerical model was capable of simulating the passive filling process of the left ventricle.
Figure 6: In a detected Pressure-Volume loop (black curve), the left-ventricle volume increased progressively with the ventricular pressure caused by passive filling of blood from the left atrium. The simulated curve (red dot) demonstrated a similar Pressure-Volume relationship, which was a linear trend
100 105 110 115 6 8 10 12 14 Pressu re [m mHg] Volume [mL]
During the increase in ventricular pressure, the wall motion was also recorded. In the cylindrical model, displacement was most significant in the basal and apex regions of the heart (3.5 mm). In the CT-based model, the most significant displacement was observed in the apex (4.9 mm), lateral free wall (5.11 mm), and septum (3.5 mm) of the heart. Due to the differently-arranged fibers from the base to the apex, the heart rotation could also be observed during the passive-filling phase, mimicking a real heart (Figure 8 and online video).
Figure 7. Left-ventricle wall motion during diastole simulation. Wall motion of cylindrical model (A-C) and CT-based model (D-F) during diastole revealed differing wall displacement. U1 represents wall motion in the X axis, U2 for the Y axis, and U3 for the Z axis
Figure 8. Ventricular rotation during passive filling phase. A, at the beginning of simulation. B, at the end
of simulation. Ventricular rotation can be observed with ventricular cavity filling. Color-scale represent fiber displacement, unite in millimeter. Online video is available for this rotation process.
4 Discussion
In the study presented herein, we characterized the elasticity and fiber orientation of the lateral region of a healthy pig left ventricle. Based on this data and the scanning image of this heart, we constructed a model using FEM.
Cardiac muscle contraction was induced by sarcomeres, adapted according to this anatomic structure, with the indentation test demonstrating that the tissue was less stiff when the indentation tip was parallel to the fibers, meaning the muscle fiber was oriented vertically, at 90°. Since the cardiac muscle fibers are oriented differently from endocardium to epicardium, as well as from the base to the apex of the heart, it is difficult to obtain a complete map of the heart. Our results on eight different levels revealed the change in overall fiber orientation. They were aligned more toward the LV longitudinal axis at the base and apex of the heart than in the middle. This fiber arrangement was further confirmed by microscopy, and corresponded to findings in other studies (Holzapfel and Ogden, 2009; Lombaert et al., 2012; Sánchez-Quintana
et al., 1994). As a result, the formula that we proposed can adequately explain the
relationship between fiber elasticity and overall fiber orientation. To the best of our knowledge, this is the first study to describe the relationship between fiber orientation and resulting elasticity.
While the fiber elasticity and orientation varies depending on measurement location, the wall motion direction is the result of average fiber orientation and the fibers’ elasticity response to ventricular pressure (Wong and Kuhl, 2014). Our results revealed similar average fiber orientation to that shown by Lombaert et al. (Lombaert et al., 2012). By using an average fiber orientation value, we were able to simplify the data input for the model construction and functional simulation. In this study, the measurements were taken on eight slices. Despite these measurements not containing all layers of cardiac tissue, the continuous fiber orientation change they revealed enabled our prediction of mechanical properties on locations between those histological cuts. Nevertheless, more slices would be needed if one sought to enrich the mechanical information in the model.
Our mechanical simulation based on measured fiber elasticity and orientation confirmed the accuracy of the model. By simulating the P-V loop, our results showed that the numerical model demonstrated a progressive increase in volume caused by internal pressure, which was compatible with a measured P-V loop (Raake et al., 2019).
Furthermore, changes in fiber angle distribution are known to alter fiber stress–strain distribution on the LV wall (Palit et al., 2015), and the simulation approach containing fiber angle distribution also revealed a rotation process, which is an important dynamic characteristic of the beating heart (Nakatani, 2011).
All these results together demonstrated that our computational model based on mechanical measurement and imaging data can represent the passive filling course of the left ventricle during diastole. By simulating the change in volume and wall displacement, it also enables detailed information about LV motion to be acquired. This detailed information is especially useful for the manufacturing of biomedical materials for epicardial applications.
The principal novelty of this study is that we found a simple method describing representative fiber orientation calculated within detected Young’s modulus. In fact, the existing computational models describing fiber orientation are based on imaging observation (CT, RMI or histology), while the mechanical behavior detection was apart. These two major characteristics were thus lack of relation. Furthermore, the structural characteristics of myocardium, such as the local orientation of the myo- and collagen fibers, are spatially heterogeneous and vary with position throughout the tissue from base to apex and from endocardium to epicardium. Therefore, the myocardium does not actually possess structural uniformity, which is essential to define a representative tissue element for an inhomogeneous specimen(Avazmohammadi et al., 2019). Appling the overall fiber elasticity and calculated mean fiber orientation on different location of the specimen, we are thus able to construct a computation model that contain both the geometric and mechanical properties of myocardium, which were inherently related.
Study Limitations
First, the data used for this study was acquired from explanted hearts that were arrested during diastole. Thus, the model described solely the inactive diastole status. Though the systolic phase was not investigated in this study, systolic wall motion is not the key factor influencing the mechanical performance of epicardial biomaterial. Secondly, the cardiac tissue used in this study was from the lateral region of the LV, and mechanical testing was effectuated in eight slices from different levels. Even though numerous points were detected on each sample, any information from between slices was thus missed. More histological cuts are therefore needed to better represent the smooth variation of fiber orientation. Furthermore, we built the whole LV using the mechanical information obtained from the lateral region of the LV, and the authors are
aware that the different regions of the LV vary in how they expand. Given this, every part of the LV should be measured individually to establish a complete numerical model. Thirdly, an elasticity matrix was defined by instrumented indentation tests using a spherical tip, yet the Poisson ratio was obtained from the literature. In order to obtain it, other tests are needed. In this study, we consider a linear elastic model. Moreover, the fibers of the heart tissue have directional sensitivity and symmetry. We can thus consider them to be a material with transverse isotropic behavior.
In this study, the orientation of the fibers was defined as constant and an elasticity matrix was established for each layer of the left ventricle. The first simulation showed that this configuration seems to be a good candidate for simulating ventricular diastole. This paves the way for a second study consisting in taking into account the variation in fiber density, viscoelastic behavior, and large deformations.
4. Conclusion
The mechanical performance of cardiac tissue is related to local fiber structure. The formula that we propose outlines, for the first time, a way to describe the elasticity of cardiac tissue and underlying fiber orientation. Building off CT imaging, we created a computational model that can accurately simulate the diastole phase of the LV. By modelling LV wall motion during passive diastole filling, our understanding of volume changes and the local deformation of the epicardium will be vastly improved, which will guide advances in the manufacturing of biomaterials for epicardial applications.
Acknowledgments
The authors wish to acknowledge the Nancy Lorraine School of Surgery, France, for their valuablecollaboration.
Funding
This work was supported by the CARE & ASCATIM FEDER PROJECTS (University of Lorraine).
References:
2019. A Contemporary Look at Biomechanical Models of Myocardium. Annu Rev Biomed Eng 21, 417–442. https://doi.org/10.1146/annurev-bioeng-062117-121129
Bayer, J.D., Blake, R.C., Plank, G., Trayanova, N.A., 2012. A novel rule-based algorithm for assigning myocardial fiber orientation to computational heart models. Ann Biomed Eng 40, 2243–2254. https://doi.org/10.1007/s10439-012-0593-5
Chabiniok, R., Wang, V.Y., Hadjicharalambous, M., Asner, L., Lee, J., Sermesant, M., Kuhl, E., Young, A.A., Moireau, P., Nash, M.P., Chapelle, D., Nordsletten, D.A., 2016. Multiphysics and multiscale modelling, data-model fusion and integration of organ physiology in the clinic: ventricular cardiac mechanics. Interface Focus 6, 20150083. https://doi.org/10.1098/rsfs.2015.0083
Cui, H., Liu, C., Esworthy, T., Huang, Y., Yu, Z., Zhou, X., San, H., Lee, S., Hann, S.Y., Boehm, M., Mohiuddin, M., Fisher, J.P., Zhang, L.G., 2020. 4D physiologically adaptable cardiac patch: A 4-month in vivo study for the treatment of
myocardial infarction. Science Advances 6, eabb5067.
https://doi.org/10.1126/sciadv.abb5067
Freeman, G.L., LeWinter, M.M., Engler, R.L., Covell, J.W., 1985. Relationship between myocardial fiber direction and segment shortening in the midwall of the canine left ventricle. Circ Res 56, 31–39. https://doi.org/10.1161/01.res.56.1.31 Gaetani, R., Feyen, D.A.M., Verhage, V., Slaats, R., Messina, E., Christman, K.L.,
Giacomello, A., Doevendans, P.A.F.M., Sluijter, J.P.G., 2015. Epicardial application of cardiac progenitor cells in a 3D-printed gelatin/hyaluronic acid patch preserves cardiac function after myocardial infarction. Biomaterials 61, 339–348. https://doi.org/10.1016/j.biomaterials.2015.05.005
Gilbert, S.H., Benoist, D., Benson, A.P., White, E., Tanner, S.F., Holden, A.V., Dobrzynski, H., Bernus, O., Radjenovic, A., 2012. Visualization and quantification of whole rat heart laminar structure using high-spatial resolution contrast-enhanced MRI. Am J Physiol Heart Circ Physiol 302, H287-298. https://doi.org/10.1152/ajpheart.00824.2011
Guccione, J.M., Costa, K.D., McCulloch, A.D., 1995. Finite element stress analysis of left ventricular mechanics in the beating dog heart. J Biomech 28, 1167–1177. https://doi.org/10.1016/0021-9290(94)00174-3
Holzapfel, G.A., Ogden, R.W., 2009. Constitutive modelling of passive myocardium: a structurally based framework for material characterization. Philosophical Transactions of the Royal Society A: Mathematical, Physical and Engineering Sciences 367, 3445–3475. https://doi.org/10.1098/rsta.2009.0091
LeGrice, I.J., Smaill, B.H., Chai, L.Z., Edgar, S.G., Gavin, J.B., Hunter, P.J., 1995. Laminar structure of the heart: ventricular myocyte arrangement and connective tissue architecture in the dog. Am J Physiol 269, H571-582. https://doi.org/10.1152/ajpheart.1995.269.2.H571
Lombaert, H., Peyrat, J.-M., Croisille, P., Rapacchi, S., Fanton, L., Cheriet, F., Clarysse, P., Magnin, I., Delingette, H., Ayache, N., 2012. Human atlas of the cardiac fiber architecture: study on a healthy population. IEEE Trans Med Imaging 31, 1436–1447. https://doi.org/10.1109/TMI.2012.2192743
Martonová, D., Holz, D., Duong, M.T., Leyendecker, S., 2021. Towards the simulation of active cardiac mechanics using a smoothed finite element method. J Biomech 115, 110153. https://doi.org/10.1016/j.jbiomech.2020.110153
Morgan, A.E., Pantoja, J.L., Weinsaft, J., Grossi, E., Guccione, J.M., Ge, L., Ratcliffe, M., 2016. Finite Element Modeling of Mitral Valve Repair. J Biomech Eng 138, 021009. https://doi.org/10.1115/1.4032125
Nakatani, S., 2011. Left Ventricular Rotation and Twist: Why Should We Learn? J Cardiovasc Ultrasound 19, 1–6. https://doi.org/10.4250/jcu.2011.19.1.1
Niederer, S.A., Lumens, J., Trayanova, N.A., 2019. Computational models in cardiology. Nat Rev Cardiol 16, 100–111.
https://doi.org/10.1038/s41569-018-0104-y
Palit, A., Bhudia, S.K., Arvanitis, T.N., Turley, G.A., Williams, M.A., 2015. Computational modelling of left-ventricular diastolic mechanics: Effect of fibre orientation and right-ventricle topology. Journal of Biomechanics 48, 604–612. https://doi.org/10.1016/j.jbiomech.2014.12.054
Pattar, S.S., Fatehi Hassanabad, A., Fedak, P.W.M., 2019. Application of Bioengineered Materials in the Surgical Management of Heart Failure. Front Cardiovasc Med 6, 123. https://doi.org/10.3389/fcvm.2019.00123
Plank, G., Burton, R.A.B., Hales, P., Bishop, M., Mansoori, T., Bernabeu, M.O., Garny, A., Prassl, A.J., Bollensdorff, C., Mason, F., Mahmood, F., Rodriguez, B., Grau, V., Schneider, J.E., Gavaghan, D., Kohl, P., 2009. Generation of histo-anatomically representative models of the individual heart: tools and application. Philosophical Transactions of the Royal Society A: Mathematical,
Physical and Engineering Sciences 367, 2257–2292.
https://doi.org/10.1098/rsta.2009.0056
Raake, P.W.J., Barthelmes, J., Krautz, B., Buss, S., Huditz, R., Schlegel, P., Weber, C., Stangassinger, M., Haberkorn, U., Katus, H.A., Most, P., Pleger, S.T., 2019. Comprehensive cardiac phenotyping in large animals: comparison of pressure-volume analysis and cardiac magnetic resonance imaging in pig post-myocardial infarction systolic heart failure. Int J Cardiovasc Imaging 35, 1691– 1699. https://doi.org/10.1007/s10554-019-01610-z
Sánchez-Quintana, D., Climent, V., Garcia-Martinez, V., Rojo, M., Hurlé, J.M., 1994. Spatial arrangement of the heart muscle fascicles and intramyocardial connective tissue in the Spanish fighting bull (Bos taurus). J Anat 184, 273– 283.
Van Loocke, M., Lyons, C.G., Simms, C.K., 2006. A validated model of passive muscle
in compression. Journal of Biomechanics 39, 2999–3009.
https://doi.org/10.1016/j.jbiomech.2005.10.016
Wang, D.D., Qian, Z., Vukicevic, M., Engelhardt, S., Kheradvar, A., Zhang, C., Little, S.H., Verjans, J., Comaniciu, D., O’Neill, W.W., Vannan, M.A., 2021. 3D Printing, Computational Modeling, and Artificial Intelligence for Structural Heart
Disease. JACC Cardiovasc Imaging 14, 41–60.
https://doi.org/10.1016/j.jcmg.2019.12.022
Weinberger, F., Mannhardt, I., Eschenhagen, T., 2017. Engineering Cardiac Muscle Tissue: A Maturating Field of Research. Circ Res 120, 1487–1500. https://doi.org/10.1161/CIRCRESAHA.117.310738
Wong, J., Kuhl, E., 2014. Generating fiber orientation maps in human heart models using Poisson interpolation. Comput Methods Biomech Biomed Engin 17, 1217–1226. https://doi.org/10.1080/10255842.2012.739167
Woods, R.H., 1892. A Few Applications of a Physical Theorem to Membranes in the Human Body in a State of Tension. J Anat Physiol 26, 362–370.