Birds have peramorphic skulls, too: anatomical
network analyses reveal oppositional
heterochronies in avian skull evolution
Olivia Plateau
1
& Christian Foth
1
✉
In contrast to the vast majority of reptiles, the skulls of adult crown birds are characterized by
a high degree of integration due to bone fusion, e.g., an ontogenetic event generating a net
reduction in the number of bones. To understand this process in an evolutionary context, we
investigate postnatal ontogenetic changes in the skulls of crown bird and non-avian
ther-opods using anatomical network analysis (AnNA). Due to the greater number of bones and
bone contacts, early juvenile crown birds have less integrated skulls, resembling their
non-avian theropod ancestors, including Archaeopteryx lithographica and Ichthyornis dispars.
Phy-logenetic comparisons indicate that skull bone fusion and the resulting modular integration
represent a peramorphosis (developmental exaggeration of the ancestral adult trait) that
evolved late during avialan evolution, at the origin of crown-birds. Succeeding the general
paedomorphic shape trend, the occurrence of an additional peramorphosis re
flects the
mosaic complexity of the avian skull evolution.
https://doi.org/10.1038/s42003-020-0914-4
OPEN
1Department of Geosciences, University of Fribourg, Chemin du Musée 6, CH-1700 Fribourg, Switzerland. ✉email:christian.foth@gmx.net
123456789
B
irds represent highly modified reptiles and are the only
surviving branch of theropod dinosaurs. In contrast to their
non-avian theropod ancestors, which possess a typical
diapsid skull morphology
1, adult crown birds have highly
apo-morphic skulls, characterized by a toothless beak, enlarged round
orbits, an enlarged and highly pneumatized chrondrocranium,
the loss and fusion of bones and skull openings, and a complex
kinetic system that allows the simultaneous motion of both jaws,
which magnitude is, however, restricted by the morphology and
articulation of the quadrate and palate
2,3. In contrast, Mesozoic
Avialae outside the crown, such as the Late Jurassic
Archae-opteryx lithographica or the Late Cretaceous Ichthyornis dispars,
still retain numerous ancestral theropod characters
4–6. A recent
comparison of ontogenetic series of non-avian theropods and
extant crown birds using geometric morphometrics demonstrated
that avian skull shape is the result of a sequence of at least four
paedomorphic events in the evolution of Eumaniraptora,
mean-ing that the shape of adult bird skulls retain juvenile features like
the enlarged orbit and associated brain regions
7,8. Another recent
application of geometric morphometrics showed that the avian
cranium has extensive variational modularity, consisting of seven
to eight semi-independent regions evolving in a mosaic pattern
9.
However, when compared to their non-avian theropod ancestors,
the number of modules is significantly reduced
10. Although less
drastic, a similar relationship was found for the connectivity
modularity in the skull of the non-avian theropod Tyrannosaurus
rex and crown bird Gallus gallus, which based on anatomical
network analysis (AnNA)
11(Fig.
1
a, b).
The cranial and mandibular bone fusion that characterizes the
skull of adult crown birds mainly occurs during postnatal
development, when existing sutures between neighbouring bones
are fully closed
12,13. Consequently, the skull bone configuration of
extant bird hatchlings resembles, to a certain degree, that of
non-avian theropods, implying a less integrated skull network with
high connectivity modularity (Fig.
1
c). To test this hypothesis, we
investigated the contact and fusion patterns of skull bones and
their impact on modularity during ontogeny in 41 extant birds
and compared them with those of non-avian archosaurs
(including 15 adult and two juvenile non-avian dinosaurs and an
ontogenetic pair of Alligator mississippiensis; see Supplementary
Data 1 and 2
file), using AnNA and phylogenetic comparative
analyses (see the
“Methods” section).
Our analyses show that early juvenile crown birds have less
integrated skulls than adult birds in terms of connectivity due to
the greater number of bones and bone contacts, but integration
increases continuously with the net reduction of bones during
maturation due to fusion. The skulls of early juvenile crown birds,
however, resemble those of non-avian theropods, including
Archaeopteryx lithographica and Ichthyornis dispars. In this
context, phylogenetic comparisons indicate that the highly
inte-grated adult bird skull evolved late during avian evolution, at the
origin of crown-birds, and are a result of a peramorphosis
(developmental exaggeration of the ancestral adult trait), which
might be related to the origin of cranial kinesis. The sequential
occurrence of oppositional heterochronies (i.e., a trended skull
shape paedomorphosis within Coelurosauria followed by
per-amorphic skull bone fusion in the last common ancestor of crown
birds) reflects the mosaic complexity of avian skull evolution,
facilitating shape and ecological diversity.
Results
Anatomical network analysis. The skulls of adult non-avian
archosaurs, including Archaeopteryx and Ichthyornis, differ
sig-nificantly from adult crown birds in the number of bones (N) and
bone contacts (K), density of connections (D), mean shortest path
length (L), quality of identified modular partition (Q
max),
par-cellation (P), and number of S-modules (identified using
statis-tical significance based on a two-sample Wilcoxon rank-sum test)
and Q-modules (identified based on the cutting of the
dendro-gram at the optimization function Q), (Fig.
2
; Table
1
; all
para-meters are defined in the method section). In particular, the
number of Q-modules ranges from
five to eight in non-avian
archosaurs, while adult crown birds possess only two to
five skull
modules, showing a much higher integration of the skull (see
Supplementary Data 2
file). In general, non-avian archosaurs
possess a preorbital, suborbital (zygomatic arch), braincase
(including the skull roof), and a left and right mandibular module
(Fig.
3
). In some taxa, however, the suborbital module forms a
unit with the preorbital (e.g., Archaeopteryx lithographica,
Erli-kosaurus andrewsi) or braincase module (e.g., Majungasaurus
crenatissimus), while in Allosaurus fragilis and Gallimimus
bul-latus for instance, the suborbital module is expanded, including
the quadrate and squamosal. The palatal bones are either part of
the preorbital or suborbital module. While the number and
dis-tribution of modules vary between species, the assignment of
single bones to a certain module can vary, too, often showing a
left-right asymmetry within a species. In many taxa, for instance,
the premaxilla represents its own module on the one side, while it
is integrated with the maxilla, nasal and lacrimal into the
pre-orbital module on the other side (see Supplementary information;
Supplementary Fig. 1).
In contrast, adult crown birds possess usually a suborbital,
braincase, and a single mandibular module. The bones forming
the beak are either integrated into the suborbital or braincase
module. The suborbital module, however, can be independent
(e.g., Gyps fulvus, Milvus milvus, Ptychoramphus aleuticus, Rhea
americana) or partly integrated into the braincase module (e.g.,
Bubulcus ibis, Phoenicopterus ruber). In extreme cases, the skull
consists of only two modules, one represented by the mandible
and the other by the cranium (e.g., Nycticorax nycticorax, Platalea
leucorodia). As in their ancestors, module integration of some
crown birds shows a left-right asymmetry, but to a lesser degree
(see Supplementary information).
All three juvenile non-avian archosaurs (Alligator
mississip-piensis, Tarbosaurus bataar, and Scipionyx samniticus) fall into
the range of adult non-avian archosaurs, indicating only minor
changes in bone contacts, fusion patterns, and modularity during
ontogeny. Interestingly, the early juvenile theropod S. samniticus
and the early Avialae A. lithographica show a very similar
distribution of skull modularity (Fig.
3
). Furthermore, T. bataar
shows an ontogenetic shift in the module identity of skull roof
and temporal bones, which is in concert with the fusion of the
frontal bones and a reduction of the number of modules.
With the exception of connectivity (C), all network parameters
of juvenile crown bird skulls fall between those of non-avian
archosaurs and adult crown birds. Although juveniles differ
significantly from the latter two groups (see Table
1
), the network
parameters correlate significantly with relative skull size, shifting
towards the adult condition with increasing skull size (see
Supplementary Fig. 2). In other words, hatchlings and early
juveniles are closer to non-avian theropods/archosaurs, while
subadults are closer to adult crown birds. As the same parameters
(except for parameter D) fail to correlate with relative skull size in
adult crown birds (see Supplementary Fig. 2; Table
2
), these
correlations represent a true ontogenetic signal. Due to their
different ontogenetic growth stages, the modular organization of
juvenile bird skulls is not uniform. However, some general
patterns can be extracted. In many cases, premaxilla, maxilla,
nasal, lacrimal, and ectethemoid/mesethmoid form a preorbital
module, while the skull roof and the temporal bones form a single
braincase module. The zygomatic bones (jugal and quadratojugal)
are often united in the suborbital module, which can also include
the maxilla (Larus ridibundus) or the quadrate (e.g., Pica pica, B.
ibis, G. fulvus). However, in other cases, the zygomatic bones are
part of the preorbital (e.g., Aythya ferina, Ciconia ciconia) or
braincase module (e.g., Otis tarda, Theristicus caudatus). In most
cases, the frontal is part of the braincase module, but in some
juveniles (e.g., Gypaetus barbatus, Recurvirostra avosetta, T.
caudatus) it is part of the preorbital module or associated with the
nasal and lacrimal forming a separate module (e.g., Tyto alba, A.
ferina). In the latter case, the preorbital module consists of the
premaxilla and is usually merged with the suborbital module.
However, the frontal can also form its own module with the
squamosal, laterosphenoid, quadrate, and the zygomatic bones
(e.g., Grus japonensis, O. tardas). In other species, the nasal and
lacrimal form with the ectethemoid/mesethmoid a second
preorbital module (e.g., Anser anser, Cygnus olor). Here, the
primary preorbital module is formed only by the premaxilla,
maxilla, and the palatal bones. The quadrate can be linked either
to the braincase (e.g., Egretta garzetta, Podiceps cristatus) or the
suborbital module (e.g., B. ibis, P. pica) and the palatal bones
Fig. 1 Hierarchical organization of anatomical networks in extinct and extant theropod dinosaurs. a UPGMA cluster of anatomical network and skull modularity of an adult Tyrannosaurus rex (skull reconstruction modified from Carr72) modified after Werneburg et al.11.b UPGMA cluster of anatomical
network and skull modularity of an adult Gallus gallus (skull reconstruction modified from Jollie12) modified after Werneburg et al.11.c Ward.2D cluster of
anatomical network, anatomical network and skull modularity of a juvenile Gallus gallus (skull reconstruction modified from Jollie12) from the recent study.
Horizontal dashed lines mark the partition into Q-modules, while circles at nodes mark the statistical significance of S-modules (white, p-value < 0.05; grey, p-value < 0.01; black, p-value < 0.001). All silhouettes are fromhttp://www.phylopic.org/.
either form an independent module (e.g., Ardea purpurea) or are
part of the preorbital (e.g., Spheniscus megellanicus), suborbital
(e.g., Upupa epops, P. leucorodia), or braincase modules (e.g., T.
caudatus). The skull networks for all specimens included in this
study are illustrated in the Supplementary information (see Skull
network analysis results).
Macroevolutionary tests and ancestral state reconstruction.
The PCo1 and PCo2 of the network parameters (see principal
coordinates analysis in the
“Methods” section; Supplementary
Data 2
file), which together account for over 75% of total
varia-tion, correlate significantly with the relative skull size of juvenile
crown birds, revealing an ontogenetic signal as described above
(Fig.
2
b–d). Based on the pFDA, juvenile and adult crown birds
are correctly identified with an error of 2.4%, indicating a
sig-nificant separation between juveniles and adults in terms of skull
network structure. While most non-avian theropods resemble
Alligator (Group 1), a comparison to juvenile and adult crown
birds only (Group 2) identifies all stem-line representatives as
juveniles (Fig.
2
e, f; Tables
3
,
4
; see Supplementary Data 2
file) as
indicated by PCo1 (Fig.
2
d). These results are supported by the
PERMANOVA: juvenile (n
= 41) and adult birds (n = 41) are
significantly separated from each other (F value: 6.837; p value:
<0.001), in which the adult avian stem-line representatives (n
=
15) are closer to A. mississippiensis (n
= 1) (F value: 0.284;
Fig. 2 Results of the anatomical network analysis (AnNA), principal coordinate analysis (PCoA) and phylogeneticflexible discriminant analysis (pFDA). a Range in the number of skull bones N in non-avian archosaurs (n= 19), juvenile and adult crown birds (both n = 41). For juvenile crown birds, the range of N is plotted against relative skull size (ratio of skull box volume). Results of ordinary least square regression analysis (OLS) describing the correlation between N and relative skull size of juvenile and adult crown birds are given in the box.b, c Same as a, showing the range of PCo1 and PCo2 in non-avian archosaurs and juvenile and adult crown birds.d PCoA morphospace and biplot based on network parameters showing the distribution of juvenile and adult extant archosaurs and non-avian dinosaurs (Group 1).e pFDA plot showing the separation between juvenile and adult extant archosaurs (Group 1) and the distribution of non-avian dinosaurs.f pFDA plot showing the separation between juvenile and adult crown birds (Group 2) and the distribution of non-avian dinosaurs and Alligator missippisensis.
p value: 1.00) and juvenile birds (F value: 4.108; p value: 0.001)
than to adult birds (F value: 7.935; p value: <0.001).
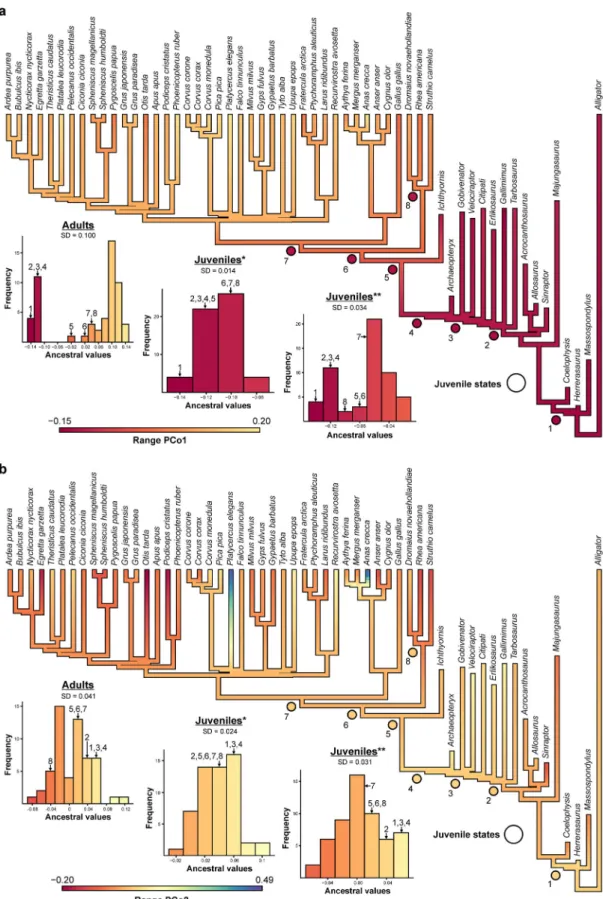
Character evolution of PCo1 shows a distinct bimodal
distribution for the ancestral values of stem and crown
representatives with a large gap between Avialae and Aves,
positioning Ornithurae (incl. I. dispars) closer to Aves. Such
distribution indicates a severe shift in the skull network topology
from Avialae towards the crown. A hypothetical substitution of
adult crown birds with their juvenile counterparts (see ancestral
state reconstruction in the
“Methods” section) results in a more
parsimonious evolution (see Supplementary Data 2
file), in which
ancestral values show a unimodal distribution, reflecting a
trended evolution towards the crown, but without severe shifts
(Fig.
4
a). Although less pronounced, the same signal is also
present for PCo2 (Fig.
4
b) and the single network parameters (see
Supplementary Figs. 3, 4). Together with the previous results, this
discrepancy reveals that the apomorphic skull morphology of
crown birds is primarily driven by postnatal ontogeny (realized in
a short period of somatic growth that is characterized by an
accelerated growth rate
14,15) and not a result of a continuous
evolution along the stem lineage.
Discussion
Besides the skull, the skeleton of adult crown birds is generally
characterized by a high degree of bone fusion to the axial skeleton
(e.g., cervical vertebrae with cervical ribs, neural spines of the
dorsal vertebrae forming a notarium, the synsacrum, and the
pygostyle) and to the appendicular skeleton (e.g., the
scapulo-coracoid, carpometacarpus, pelvic bones, and the
tarsome-tatarsus)
16,17. Tracing the evolutionary history of bone fusion in
the manus and pelvis along maniraptoran theropods indicates
that these features evolved many times independently across
non-avialan theropods, Enantiornithes, and Ornithuromorpha, while
bone fusion events within different body regions are uncoupled
from each other and furthermore do not correlated with the
growth pattern, i.e. neither duration nor speed of somatic growth
impact bone fusion patterns
18.
While the skull network of early juvenile crown bird skulls
recapitulates the condition of adult non-avian theropods, the
intensive bone fusion during bird ontogeny exaggerates the
ancestral adult traits of non-avian theropods, leading to a
stronger modular integration in terms of connectivity.
Interest-ingly, this ontogenetic pattern is paralleled to a lesser degree in
Tarbosaurus, where the fusion of the frontal bones causes a
reduction in the number of modules. Because bone fusion
gen-erally requires a previous contact of bones in form of a suture, it
represents the more derived state with respect to the suture, both
at the ontogenetic
13,19and evolutionary level
18,20. Therefore, we
hypothesize that the intense fusion in the skull ontogeny of crown
birds represents a peramorphic heterochrony (i.e., the
develop-mental exaggeration of the ancestral adult trait) with respect to
their non-avian theropod ancestors that evolved very late during
avian evolution, at the origin of crown-birds.
Heterochrony was previously proposed to play a key role in
theropod skull evolution leading to the avian skull
7,8,21,22. A
sequence of paedomorphic events in coelurosaurs, for instance,
manifested juvenile traits of more basal theropods in the shape of
the maxilla, nasal, orbit and brain of adult birds
7,8,21. However,
the relative increase of the premaxilla in Pygostylia, for instance,
was already identified as localized peramorphosis
7. In this regard,
our
finding highlights that the origin of bird skulls was much
more complex, including opposite heterochronies acting at
dif-ferent levels (i.e., overall shape, local shape and bone network),
but also at different phylogenetic entities.
While the initial phase of paedomorphosis in avian skull
evo-lution is probably related to a trend of body size reduction in
coelurosaurs
7,21,23caused by the truncation of the growth
period
14,15, we speculate that the peramorphic bone fusion in
crown birds is related to the origin of cranial kinesis.
Finite-element-analyses on extant bird skulls indicate that the fused
areas of the premaxillae and the braincases are regions of low
strain, while most stress acts on the mobile nasal-frontal hinge
and the zygomatic arch
24,25, which are the key components in
avian skull kinesis
2. Thus, we speculate that the fusion-induced
immobility of the braincase and the premaxillary tip constrains a
Table 1 Comparison of network parameters and principal coordinates between non-avian archosaurs (n
= 19), juvenile and adult
crown birds (both n
= 41) using the Mann–Whitney U (z) and the Kolmogorov–Smirnov (D) test.
Adult birds vs. NA-archosaurs Juvenile birds vs. adult birds Juvenile birds vs. NA-archosaurs z (p) D (p) z (p) D (p) z (p) D (p) N 6.213 (0.000) 1.000 (0.001) 7.743 (0.000) 0.927 (0.001) 6.182 (0.000) 0.976 (0.001) K 6.188 (0.000) 1.000 (0.001) 7.687 (0.000) 0.976 (0.001) 6.184 (0.000) 1.000 (0.001) D 6.185 (0.000) 1.000 (0.001) 7.579 (0.000) 0.902 (0.001) 5.651 (0.000) 0.853 (0.001) C 0.858 (0.395) 0.386 (0.026) 0.886 (0.384) 0.341 (0.021) 0.493 (0.622) 0.225 (0.427) L 6.183 (0.000) 1.000 (0.001) 7.485 (0.000) 0.927 (0.001) 5.451 (0.000) 0.805 (0.001) H 5.340 (0.000) 0.850 (0.001) 4.290 (0.000) 0.488 (0.001) 3.083 (0.001) 0.505 (0.002) S 6.859 (0.000) 1.000 (0.001) 7.476 (0.000) 0.805 (0.001) 4.513 (0.000) 0.537 (0.002) Q 5.948 (0.000) 0.902 (0.001) 5.750 (0.000) 0.659 (0.001) 2.501 (0.012) 0.266 (0.464) Qmax 6.182 (0.000) 1.000 (0.001) 7.587 (0.000) 0.878 (0.001) 5.268 (0.000) 0.720 (0.001) P 5.795 (0.000) 0.902 (0.001) 6.294 (0.000) 0.756 (0.001) 1.335 (0.183) 0.216 (0.503) PCo1 6.182 (0.000) 1.000 (0.001) 7.707 (0.000) 0.927 (0.001) 5.880 (0.000) 0.846 (0.001) PCo2 2.972 (0.004) 0.517 (0.002) 0.751 (0.456) 0.195 (0.310) 2.574 (0.010) 0.367 (0.047) PCo3 0.779 (0.433) 0.334 (0.085) 1.493 (0.135) 0.293 (0.053) 0.509 (0.615) 0.268 (0.262) PCo4 0.334 (0.737) 0.208 (0.511) 0.482 (0.632) 0.195 (0.361) 0.111 (0.913) 0.139 (0.931) PCo5 1.701 (0.091) 0.347 (0.077) 0.769 (0.445) 0.146 (0.759) 2.559 (0.011) 0.420 (0.006) PCo6 0.858 (0.388) 0.291 (0.160) 2.105 (0.033) 0.268 (0.094) 2.1463(0.015) 0.439 (0.008) PCo7 0.445 (0.654) 0.209 (0.530) 0.269 (0.787) 0.146 (0.742) 1.143 (0.881) 0.212 (0.509) PCo8 1.669 (0.096) 0.343 (0.059) 1.308 (0.0187) 0.244 (0.182) 2.988 (0.002) 0.440 (0.006) PCo9 0.222 (0.819) 0.317 (0.108) 0.288 (0.773) 0.220 (0.265) 0.175 (0.868) 0.220 (0.454)
controlled kinetic dorsoventral movement of the avian beak
during biting/picking.
Although resembling juvenile theropods in shape
7(Fig.
3
), our
study confirms that Archaeopteryx lithographica possesses a
rather theropod-like skull, lacking cranial kinesis
5,26. This
aki-netic condition is also present in Confuciusornis sanctus,
Sapeornis chaoyangensis and basal Enantiornithes
4,27,28, although
the reduction of the jugal-postorbital bar in some Enantiornithes
may indicate primitive kinesis in some species
4. As indicated by
the palatal morphology and the lack of a jugal-postorbital bar, the
first definite evidence for simple cranial kinesis is present in Late
Cretaceous Ornithurae like Ichthyornis dispars and Hesperornis
regalis
6,29. Although the frontal-parietal suture is still open, I.
dispars shows a partial fusion between the premaxillae, frontals
and possibly the parietals
30. Thus, the fossil record supports the
hypothesis that the late origin of cranial kinesis and bone fusion
in the history of birds may be linked. However, the skull network
of I. dispars is still different from adult crown birds and resembles
the condition of juveniles instead. In contrast, phylogenetic
reconstructions of the palatal morphology
21and cranial network
(this study) indicate that the last common ancestor of grown
birds had a strongly fused skull with a kinetic motion. While
palaeognaths still have an intermediate stage, the most advanced
skull kinesis is realized in neognath birds
28. If skull bone fusion is
further related with the short, accelerated growth mode of crown
birds still need to be tested, but examples from other body regions
indicate that bone fusion and growth strategy are not necessarily
linked with each other
18.
Beside the ontogenetic signal in network parameters, many
taxa in our sample, including non-avian theropods, show a
left-right asymmetry in modularity, which is caused when paired
bones are assigned to different modules or unpaired bones do not
form their own module, but are assigned either to a left or right
module. Similar asymmetries were previously found in skull
network analyses of amniote and synapsid skulls
11,31and the
skull muscularity of primates and deformed humans
32,33. On the
Fig. 3 Distribution of skull modules in some non-avian theropods, and ontogenetic pairs of Gallus gallus and Struthio camelus from the left and right (mirrored) side. The modularity of non-avian theropods is very similar between different species (including non-avian Avialae), but also throughout ontogeny (see ontogenetic pair of Tarbosaurus bataar). Juvenile crown birds resemble the ancestral condition in number and distribution of modules, while adult crown birds show a severe reduction of modules due to ontogenetic bone fusion. Colours highlight different skull modules within species, but do not necessarily imply homology between species. Original sources of modified skull reconstruction: Scipionyx samniticus73, Allosaurus fragilis1, juvenile
Tarbosaurus bataar74, adult Tarbosaurus bataar75, Archaeopteryx lithographica5, Ichthyornis dispar6, Gallus gallus12, Struthio camelus76(see Supplementary
one hand, this could be a methodological artefact caused by the
dichotomous nature of the cluster analysis, which is not able to
produce fully symmetric topologies when paired bones possess an
equal probability of being part of one module or another
34. This
effect is amplified by the presence of non-paired elements (e.g.,
basisphenoid, basioccipital, supraoccipital), which impose an
artificial asymmetry onto the network, as the cluster algorithm
cannot decide whether these elements are linked to the left or the
right. To test this, we deleted all unpaired elements from the
dataset of A. lithographica and repeated the anatomical network
analysis. This modification results in a more or less symmetrical
cluster, where the distribution of modules for A. lithographica is
Table 2 Comparison of correlations of network parameters and principal coordinates against relative skull size (ratio of skull box
volume) in juvenile and adult crown birds (both n
= 41).
Juvenile birds Adult birds ANCOVA Slope R2(p) slope R2(p) F (p) N −16.290 0.436 (0.000) 2.881 0.041 (0.204) 25.930 (0.000) K −37.930 0.454 (0.000) 4.985 0.030 (0.280) 27.380 (0.000) D 0.054 0.258 (0.001) −0.092 0.058 (0.120) 6.123 (0.002) C 0.018 0.005 (0.6720) −0.052 0.009 (0.570) 0.538 (0.466) L −0.690 0.347 (0.000) 0.187 0.026 (0.317) 13.830 (0.000) H 0.165 0.297 (0.000) 0.055 0.021 (0.363) 2.363 (0.128) S −2.179 0.348 (0.000) −0.149 0.006 (0.620) 12.44 (0.000) Q −2.068 0.286 (0.000) 1.086 0.076 (0.084) 15.550 (0.000) Qmax −0.130 0.325 (0.000) 0.060 0.033 (0.253) 10.300 (0.002) P −0.092 0.221 (0.002) 0.115 0.082 (0.073) 9.892 (0.002) PCo1 0.106 0.487 (0.000) −0.039 0.047 (0.174) 19.570 (0.000) PCo2 −0.095 0.118 (0.028) −0.112 0.045 (0.172) 0.035 (0.852) PCo3 −0.010 0.091 (0.056) 0.037 0.006 (0.642) 0.243 (0.138) PCo4 0.038 0.013 (0.475) −0.097 0.040 (0.206) 2.125 (0.149) PCo5 −0.035 0.010 (0.516) 0.051 0.011 (0.499) 0.894 (0.347) PCo6 −0.029 0.006 (0.617) −0.081 0.043 (0.183) 0.369 (0.545) PCo7 −0.082 0.042 (0.200) −0.006 0.000 (0.933) 0.715 (0.400) PCo8 −0.036 0.011 (0.511) −0.099 0.052 (0.151) 0.535 (0.467) PCo9 −0.020 0.003 (0.748) −0.018 0.002 (0.813) 0.000 (0.983)
Using ordinary least square regression analysis (OLS), the correlation between trait and size is shown by the coefficient of determination R2and a p-value for the slope. The equality of slopes for the juvenile and adult regression was tested with ANCOCA. Tests with significant differences are shown in bold.
Table 3 Results of the phylogenetic
flexible discriminant analysis (pFDA) based on the PCoA data, comparing the separation
between juvenile and adult crown birds and Alligator mississippiensis (Group 1).
Training data (extant archosaurs) AA AJ CA CJ Aves-Adult (n= 41; AA) 40.000 1.000 0.000 0.000 Aves-Juvenile (n= 41; AJ) 1.000 40.000 0.000 0.000 Crocodylia-Adult (n= 1; CA) 0.000 0.000 1.000 0.000 Crocodylia-Juvenile (n= 1; CJ) 0.000 0.000 0.000 1.000 Error of identification 0.024 0.024 0.000 0.000
Test data (extinct archosaurs) P(AA) P(AJ) P(CA) P(CJ) Prediction Massospondylus 0.000 0.040 0.950 0.010 Crocodylia-Adult Herrerasaurus 0.000 0.000 0.010 0.990 Crocodylia-Juvenile Coelophysis 0.000 0.000 0.965 0.035 Crocodylia-Adult Majungasaurus 0.000 0.195 0.796 0.009 Crocodylia-Adult Sinraptor 0.000 0.000 0.000 1.000 Crocodylia-Juvenile Allosaurus 0.000 0.000 1.000 0.000 Crocodylia-Adult Acrocanthosaurus 0.000 0.000 0.016 0.984 Crocodylia-Juvenile Tarbosaurus (adult) 0.000 0.009 0.123 0.868 Crocodylia-Juvenile Tarbosaurus (juvenile) 0.000 0.002 0.998 0.000 Crocodylia-Adult Gallimimus 0.000 0.549 0.406 0.045 Aves-Juvenile Erlikosaurus 0.000 0.218 0.774 0.008 Crocodylia-Adult Citipati 0.000 0.385 0.071 0.544 Crocodylia-Juvenile Velociraptor 0.000 0.007 0.000 0.993 Crocodylia-Juvenile Gobivenator 0.000 0.793 0.200 0.007 Aves-Juvenile Archaeopteryx 0.000 0.000 0.000 1.000 Crocodylia-Juvenile Ichthyornis 0.000 0.133 0.863 0.004 Crocodylia-Adult
The phylogenetic strengthλ is 0.01 and the error for the correct identification of extant taxa to their original group is 0.024. Non-avian dinosaurs were mostly identified as juvenile or adult Alligator mississippiensis. Only the ornithomimosaur Gallimimus and the troodontid Gobivenator were identified as close to juvenile crown birds. Values in italics highlight the group specific error of identification. Values in bold highlight the predicted group based on the highest probability.
identical on the left and right side (see Supplementary
informa-tion). However, Powell et al.
32described an increase of module
asymmetry within the head and neck muscles of simiiform
pri-mates, which they interpreted to be related to more complex,
asymmetrical facial expressions. Diogo et al.
33further found that
developmental deformation during embryogenesis increase
module asymmetry. These two examples indicate that left-right
asymmetry may not entirely be a methodological artefact, but
could have a true biological meaning. Thus, it could be possible
that the left-right asymmetry results from developmental (only
for juveniles) and biomechanical (for juveniles and adults)
con-straints, indicating a more complex modular hierarchy that
cannot be resolved with the current methodology. This has to be
tested in the future studies in more detail using different
meth-odologies for calculating modularity, like OSLOM (Order
Statis-tics Local Optimization Method)
34,35. Nevertheless, as all network
parameters apart from the connectivity (C) show the same
ontogenetic and evolutionary trend (see Supplementary Figs. 2,
3), modular asymmetry apparently has no impact on our
inter-pretation of the results (see Supplementary Fig. 5, see
Supple-mentary Data 2
file).
In summary, our study demonstrates that the
final step towards
highly modular integrated skulls evolved in the last common
ancestor of the bird crown, caused by rather abrupt peramorphic
bone fusion at the origin of crown-birds that adds to the
underlying skull shape paedomorphosis in the evolution of
coe-lurosaurs, highlighting the mosaic evolution of the bird skull.
Further events of opposite heterochronies along the stem-line of
birds may have occurred in dental evolution. The tooth
mor-phology of small-bodied adult coelurosaurs, like dromaeosaurids
and compsognathids, is probably paedomorphic with respect to
their ancestors, as it resembles that of juvenile basal tetanurans
36.
In contrast, the ontogenetic increase in the number of teeth in
troodontids probably represents a peramorphic heterochrony
37.
Oppositional heterochronies can be further found in the growth
evolution of birds, in which the somatic growth of crown birds is
characterized by a short duration, but high speed
14,15. When
compared with the mode of their ancestors
38,39, the former
growth pattern represents a progenetic paedomorphosis, while
the latter is an accelerated peramorphosis
40,41. Finally,
opposi-tional heterochronies have been further suggested for arthropod
heads
42and human skull evolution
43. Together with recent
embryological studies on the artificial induction of ancestral snout
and tooth morphologies
44,45and the verification of temporary
ossification centres of bones that are absent in hatched birds
46,47,
our study shows that the genotype and the phenotypic
develop-ment of crown birds still contains relics from their theropod
ancestors, while modifications in the timing, location and
inten-sity of developmental processes result in the evolutionary novelty
that is the avian skull.
Methods
Sampling. The sampling includes 41 extant birds for which both juvenile and adult specimens were available for study (see Supplementary Data 2file). Juvenile spe-cimens were identified as such based on the presence of skull sutures on the skull roof, which is a reliable proxy for determining maturity in birds13. Although
skeletal material of early juvenile birds is generally limited in osteological collec-tions, species representing all major bird lineages could be sampled, but due to fast skeletal growth, the exact age of juvenile birds cannot usually be determined. As a consequence, the juveniles sampled herein do not necessarily represent the same ontogenetic stage (i.e., hatchlings or subadults). Skulls of adult birds are much more frequent in osteological collections and can be identified easily as such by means of their high degrees of bone fusion in the skull. Thus, each bird species is represented by an ontogenetic pair, including a juvenile and an adult.
In addition, we sampled the skulls of twelve non-avialan theropod dinosaur species, two avialan stem birds (Archaeopteryx lithographica and Ichthyornis dispars) and two outgroup taxa (Massospondylus carinatus and Alligator mississipiensis). Finally, to explore ontogenetic modularity in non-avian archosaurs, we added three juvenile specimens: Scipionyx samniticus, Tarborausaurus bataar and Alligator mississippiensis (see Supplementary Data 2file). Because AnNA, which sources the contact/non-contact of biological structures, requires complete
Table 4 Results of the phylogenetic
flexible discriminant analysis (pFDA) based on the PCoA data, comparing the separation
between juvenile and adult crown birds (Group 2).
Training data (extant birds) NeoA NeoJ PA PJ Neognathae-Adult (n= 38; NeoA) 37.000 1.000 2.000 0.000 Neognathae-Juvenile (n= 38; NeoJ) 1.000 36.000 0.000 3.000 Palaeognathae-Adult (n= 3; PA) 0.000 0.000 1.000 0.000 Palaeognathae-Juvenile (n= 3; PJ) 0.000 1.000 0.000 0.000 Error of identification 0.026 0.053 0.667 1.000
Test data (extinct archosaurs+ Alligator) P(NeoA) P(NeoJ) P(PA) P(PJ) Prediction
Alligator (adult) 0.000 0.787 0.000 0.213 Aves-Juvenile (NeoJ) Alligator (juvenile) 0.000 0.967 0.000 0.033 Aves-Juvenile (NeoJ) Massospondylus 0.000 0.009 0.000 0.991 Aves-Juvenile (PJ) Herrerasaurus 0.000 0.000 0.000 1.000 Aves-Juvenile (PJ) Coelophysis 0.000 0.003 0.000 0.997 Aves-Juvenile (PJ) Majungasaurus 0.000 0.858 0.000 0.142 Aves-Juvenile (NeoJ) Sinraptor 0.000 0.994 0.000 0.006 Aves-Juvenile (NeoJ) Allosaurus 0.000 0.687 0.000 0.313 Aves-Juvenile (NeoJ) Acrocanthosaurus 0.000 0.990 0.000 0.010 Aves-Juvenile (NeoJ) Tarbosaurus (adult) 0.000 0.991 0.000 0.009 Aves-Juvenile (NeoJ) Tarbosaurus (juvenile) 0.000 0.825 0.000 0.175 Aves-Juvenile (NeoJ) Gallimimus 0.000 0.369 0.000 0.631 Aves-Juvenile (PJ) Erlikosaurus 0.000 0.660 0.000 0.340 Aves-Juvenile (NeoJ) Citipati 0.000 0.973 0.000 0.027 Aves-Juvenile (NeoJ) Velociraptor 0.000 0.905 0.000 0.095 Aves-Juvenile (NeoJ) Gobivenator 0.000 0.590 0.000 0.410 Aves-Juvenile (NeoJ) Archaeopteryx 0.000 0.941 0.000 0.059 Aves-Juvenile (NeoJ) Ichthyornis 0.000 0.764 0.000 0.236 Aves-Juvenile (NeoJ)
The phylogenetic strengthλ is 0.11 and the error for the correct identification of extant taxa to their original group is 0.098. Non-avian dinosaurs were always identified as juvenile birds. Values in italics highlight the group specific error of identification. Values in bold highlight the predicted group based on the highest probability.
Fig. 4 Ancestral state reconstruction of PCoA data for adult and juvenile crown birds. a PCo1. b PCo2. Based on ancestral values, skull network evolution shows a severe shift from Avialae (4) to Ornithurae (5) and Aves (6) as indicated in the histogram. Substituting adult crown birds with juveniles (see circles; histogram: *residual values; **original values) results in a more parsimonious evolution (see standard deviation SD), where the change from Avialae (4) to Aves (6) is rather continuous (see Supplementary Data 2file). (1) Theropoda; (2) Coelurosauria; (3) Eumaniraptora; (4) Avialae; (5) Ornithurae; (6) Aves; (7) Neognathae; (8) Palaeognathae.
skulls, where each bone contact can be reconstructed, only a small fraction of fossil stem-line representatives could be sampled. This is especially true for juvenile specimens, which have a smaller likelihood of preservation and discovery48.
All crown-group birds were scored based onfirst-hand observations, while the scoring of the stem-line representatives and outgroup taxa sources from a combination offirst-hand observations and the scientific literature (see Supplementary Data 2file).
Anatomical network analysis. Based on the recent publication of Werneburg et al.11, we used AnNA to analyse the skulls in our sample in terms of modularity.
The anatomical network matrix is based on a symmetric unweighted and undir-ected adjacency matrix34, where the nodes (N) represent bones and connections
(K) represent the presence of a link between two bones. Bones that are clearly separated from each other by a suture (e.g., the suture between the frontal and parietal) or represent an articulation (e.g., the articulation between the quadrate and articular) were treated as independent units. In contrast, fused bones were treated as one unit (see Esteve-Altava et al.20). All bones or units that are not linked
with each other were scored as“0” whereas sutures or articulations between bones or units were scored as“1” (see Supplementary Data 1 file).
Following the script of Werneburg et al.11, the data matrix of each specimen
was analysed with the help of the software R-3.5.249and the package igraph50.
These analyses determined the following network parameter for each specimen: number of nodes (N), of connections (K), density of connections (D), mean clustering coefficient (C), mean shorted path length (L) and variance of connectivity (H)51. Here, parameters N and K represent the number of bones and
their physical contacts with each other, respectively. D measures the existing number of connections (K) divided by the maximum number of connections possible. C is the arithmetic mean of the ratio of a node’s neighbours that connect among them in a triangular manner. L measures the average of the shortest path length between all pairs of bones. H is the standard deviation and the mean of the number of connections of all nodes in the network51,52. Modules were identified by
the hierarchical clustering of the generalized topological overlap similarity matrix among nodes (GTOM), generated from the primary data matrices of each species, which assumes that nodes connecting to the same other nodes (i.e., shared neighbours) more likely belong to the same module. However, in contrast to Werneburg et al.11we did not use UPGMA, but Ward.D2 for cluster analysis as this
method minimizes variance53,54. The number of modules was determined from the
clusters using the optimization function modularity Q55, which evaluates if the
modules identified are better supported than what is expected at random. Accordingly, these modules are called Q-modules, in which the quality of the identified modular partition is expressed by the parameter Qmax, which quantifies
the number of connections between nodes within the same module minus the expected number of connections if they were distributed at random among the same modules for the best of the possible partitions. Furthermore, we estimated S-modules, which are based on a two-sample Wilcoxon rank-sum test on the internal vs. external connections of each module. In addition, we also calculated the parcellation (P), which measures the extent to which the nodes of a network are divided into balanced modules. The theoretical background of these module analyses are described, among others, in Werneburg et al.11, Rasskin-Gutman and
Esteve-Altava51, Esteve-Altava et al.52,56and Clauset et al.55.
Statistics and reproducibility. For comparing the range of each network para-meter between juvenile and adult crown birds (both n= 41) and the outgroup taxa (i.e., non-avian theropods, Massospondylus carinatus and Alligator mississippiensis; n= 19) (see Supplementary Fig. 2), the nonparametric Mann–Whitney U and Kolmogorov–Smirnov tests were applied, which are more robust against the non-normal distribution of data57. The Mann–Whitney U test calculates whether two
univariate samples are taken from populations with equal medians, while the Kolmogorov–Smirnov test compares whether the shape of two univariate dis-tributions is similar or not57.
As the juveniles do not have the same ontogenetic stage (see above), the network parameters were plotted against relative skull size (not total size), which is expressed as the percentage of the adult bird skull box volume (length × width × height) for each species, respectively. By standardizing size this way, it is possible to document how the network parameters change during growth. Correlations between network parameters and relative skull size were tested with ordinary least square (OLS) regression analysis. To assure that these correlations represent a true ontogenetic, and not just an allometric signal, the same correlations were tested for adult birds. Here, relative size was expressed as the percentage of the skull box volume of the largest bird (Pelecanus occidentalis) sampled. The equality of the regression slopes of both analyses were compared to each other using a one-way ANCOVA based on an F test in PAST v. 3.0558.
Next, we log-transformed the resulting network parameters (N, K, D, C, L, H, S-Modules, Q-S-Modules, Qmax) and applied PCoA using the Gower index59,60, which
is the default measure for using mixed data types (see Supplementary Data 2file). Similar to principal component analysis (PCA), PCoA reduces a multivariate dataset down to a small set of dimensions (principal coordinates, PCo’s) associated with a measure of the variance (eigenvalue) for each PCo, and allows comparing the distribution of juvenile and adult birds with each other and with respect to their non-avian ancestors and Alligator mississippiensis in a multivariate space. In order
to test for an ontogenetic/allometric signal, we performed an OLS and one-way ANCOVA between the single PCo’s and relative skull size for both juvenile and adult birds as described above.
Two time-calibrated supertrees were created, which served as the phylogenetic framework for various statistical analyses and character evolution analyses. The supertrees differ from each other in terms of the crown-group topology, as one is based on that of Hackett et al.61, the other on that of Ericson et al.62. To assess
temporal uncertainty, we downloaded a set of 1000 relaxed-clock trees for each topology from the webpage birdtree.org63,64, which summarize the range of
uncertainties in terms of time calibration of ancestral nodes from molecular clock estimations. From those trees, we computed a temporal consensus for each topology, using the function consensus.edges in the phytools package65of R. The
final topologies were completed by the addition of the sampled stem line representatives and Alligator mississippiensis following the general consensus on non-avian theropod phylogeny1,66(see Supplementary Data 3file). To explore how
differences in the crown bird topology can affect the outcome, all phylogenetic-based methods (see below) were run with both supertrees and compared with each other, while the presentation of the results is based on the topology of Hackett et al.61.
To test for the statistical overlap between the different ontogenetic groups in the crown (i.e., juvenile vs. adult) and their relation to stem line representatives in the multivariate morphospace (see PCoA), we applied a phylogeneticflexible discriminant analyses (pFDA)67,68in R. This version of classical discriminant
analysesfirst estimates Pagel’s lambda testing how the grouping correlates with phylogeny, and then applies this assessment for controlling for phylogenetic non-independence during the actual discriminant analyses. To apply this method for ontogenetic series, all crown-group birds in the supertree were split into two OTUs (one representing the juvenile and the other the adult specimen), each having a branch length of one year. Although the ontogenetic growth of birds is not equal, this value had to be standardized, as pFDA requires an isometric tree. The same was done for the ontogenetic pairs of Alligator mississipiensis and Tarbosaurus bataar, each with a branch length of ten years, taking the longer ontogenetic growth of both species into account when compared to birds. Afterwards, we divided the extant OTUs into four groups: (1) juvenile and (2) adult birds (both n= 41), and (3) juvenile and (4) adult Alligator mississippiensis (both n = 1). pFDA tests if the extant groups can be separated from each other or not, and assigns all fossil taxa to one of the groups based on their original position in the morphospace. In a second run, we divided only birds into four groups: (1) juvenile and (2) adult Palaeognathae (both n= 3), and (3) juvenile and (4) adult Neognathae (both n = 38). The degree of overlap between the different groups was additionally tested using a permutational multivariate analysis of variance (PERMANOVA)69in
PAST. The PERMANOVA was run with 10,000 replications, Euclidean distance as the distance measure and Bonferroni correction, in which the p values were multiplied with the number of comparisons to decreases the impact of multiplicity and the probability of rejecting incorrectly the null hypothesis70.
Finally, we explored how skull modularity changed through bird evolution. Using a maximum likelihood-based ancestral state reconstruction with a Brownian motion model having a constant rate of diffusion, PCo1 and PCo2 of adult birds, non-avian dinosaurs and Alligator mississippiensis were mapped onto the two supertrees. This was done using Ace function in the R package Ape71. As this
ancestral state reconstruction reflects the true evolution for adult semaphoronts, we wanted to further know, how much of this evolution is actually affected by bird ontogeny. Therefore, we repeated the analysis by substituting the adult birds with their juvenile counterparts. However, as the juvenile birds in our sample do not represent the same ontogenetic stages, trait changes along the branches are potentially affected by ontogenetic signals included in the data. To reduce this effect, we estimated the residuals from the OLS regression of PCo1 and PCo2 against relative skull size and standardized these values with the youngest individual in our sample (Struthio camelus), transforming all juveniles to hypothetical hatchlings (see Supplementary Data 2file). For comparing the trait evolution of both analyses with each other, we estimated the standard deviation from all ancestral values, which quantifies the amount of variation and can be used as a proxy for parsimony. Likewise, parsimony was determined by the log-transformed product of all ancestral values. Finally, we compared the ancestral values of selected clades with each other, including Theropoda, Coelurosauria, Eumaniraptora, Avialae, Ornithurae, Aves, Neognathae and Palaeognathae.
Reporting summary. Further information on research design is available in the Nature Research Reporting Summary linked to this article.
Data availability
All data for the anatomical network analyses is part of the Supplementary information (Supplementary Data 1file).
Code availability
The R code for the anatomical network analyses is part of the Supplementary information (Supplementary Data 4file). The R code for the phylogenetic flexible discriminant analysis are provided by Schmitz and Motani67.
Received: 30 October 2019; Accepted: 25 March 2020;
References
1. Rauhut, O. W. M. The interrelationships and evolution of basal theropod dinosaurs. Spec. Pap. Palaeontol. 69, 1–213 (2003).
2. Zusi, R. L. in Patterns of Structural and Systematic Diversity (eds. Hanken, J. & Hall, B. K.), Vol. 2, 391–437 (University of Chicago Press, 1993).
3. Smith-Paredes, D. & Bhullar, B.-A. S. in Heads, Jaws, and Muscles (eds Zimmermann, J. M., Diaz R. E. Jr, & Diogo, R.) 229–251 (Springer Nature, 2019).
4. O’Connor, J. K. & Chiappe, L. M. A revision of enantiornithine (Aves: Ornithothoraces) skull morphology. J. Syst. Palaeontol. 9, 135–157 (2011). 5. Rauhut, O. W. M. New observations on the skull of Archaeopteryx. Pal. Z. 88,
211–221 (2014).
6. Field, D. J. et al. Complete Ichthyornis skull illuminates mosaic assembly of the avian head. Nature 557, 96–100 (2018).
7. Bhullar, B.-A. S. et al. Birds have paedomorphic dinosaur skulls. Nature 487, 223–226 (2012).
8. Bhullar, B.-A. S. et al. How to make a bird skull: major transitions in the evolution of the avian cranium, paedomorphosis, and the beak as a surrogate hand. Integr. Comp. Biol. 56, 389–403 (2016).
9. Felice, R. N. & Goswami, A. Developmental origins of mosaic evolution in the avian cranium. Proc. Natl Acad. Sci. USA 115, 555–560 (2018).
10. Felice, R. N. et al. Evolutionary integration and modularity in the archosaur cranium. Integr. Comp. Biol. 59, 371–382 (2019).
11. Werneburg, I., Esteve-Altava, B., Bruno, J., Ladeira, M. T. & Diogo, R. Unique skull network complexity of Tyrannosaurus rex among land vertebrates. Sci. Rep. 9, 1520 (2019).
12. Jollie, M. T. The head skeleton of the chicken and remarks on the anatomy of this region in other birds. J. Morphol. 100, 389–436 (1957).
13. Bailleul, A. M., Scannella, J. B., Horner, J. R. & Evans, D. C. Fusion patterns in the skulls of modern archosaurs reveal that sutures are ambiguous maturity indicators for the Dinosauria. PLoS ONE 11, e0147687 (2016).
14. Starck, J. M. & Ricklefs, R. E. Avian Growth and Development (Oxford University Press, 1998).
15. Scheyer, T. M., Klein, N. & Sander, P. M. Developmental palaeontology of Reptilia as revealed by histological studies. Semin. Cell Dev. Biol. 21, 462–470 (2010).
16. Starck, D. Vergleichende Anatomie der Wirbeltier auf evolutionsbiologischer Grundlage. Bd. 2: Das Skeletsystem (Springer, 1979).
17. Baumel, J. J. & Witmer, L. M. in Handbook of Avian Anatomy (eds Baumel, J. J., King, A. S., Breazile, J. E., Evans, H. E. & Vanden Berge, J. C.) 45–132 (Nuttall Ornithological Club, 1993).
18. Wang, M., Li, Z. & Zhou, Z. Insight into the growth pattern and bone fusion of basal birds from an Early Cretaceous enantiornithine bird. Proc. Natl Acad. Sci. USA 114, 11470–11475 (2017).
19. Hone, D. W. E., Farke, A. A. & Wedel, M. J. Ontogeny and the fossil record: what, if anything, is an adult dinosaur? Biol. Lett. 12, 20150947 (2016). 20. Esteve-Altava, B., Marugán-Lobón, J., Botella, H. & Rasskin-Gutman, D.
Random loss and selective fusion of bones originate morphological complexity trends in tetrapod skull networks. Evol. Biol. 41, 52–61 (2014).
21. Foth, C., Hedrick, B. P. & Ezcurra, M. D. Cranial ontogenetic variation in early saurischians and the role of heterochrony in the diversification of predatory dinosaurs. PeerJ 4, e1589 (2016).
22. Wang, S. et al. Extreme ontogenetic changes in a ceratosaurian theropod. Curr. Biol. 27, 1–5 (2017).
23. Benson, R. B. J. et al. Rates of dinosaur body mass evolution indicate 170 million years of sustained ecological innovation on the avian stem lineage. PLoS Biol. 12, e1001853 (2014).
24. Soons, J. et al. Mechanical stress, fracture risk and beak evolution in Darwin’s groundfinches (Geospiza). Philos. Trans. R. Soc. Lond., Ser. B 365, 1093–1098 (2010).
25. Cuff, A. R., Bright, J. A. & Rayfield, E. J. Validation experiments on finite element models of an ostrich (Struthio camelus) cranium. PeerJ 3, e1294 (2015).
26. Rauhut, O. W. M., Foth, C. & Tischlinger, H. The oldest Archaeopteryx (Theropoda: Avialiae): a new specimen from the Kimmeridgian/Tithonian boundary of Schamhaupten, Bavaria. PeerJ 6, e4191 (2018).
27. Chiappe, L. M., Ji, S., Ji, Q. & Norell, M. A. Anatomy and systematics of the Confuciusornithidae (Theropoda: Aves) from the Late Mesozoic of northeastern China. Bull. Am. Museum. Nat. Hist. 242, 1–89 (1999). 28. Hu, H. et al. Evolution of the vomer and its implications for cranial kinesis in
Paraves. Proc. Natl Acad. Sci. USA 116, 19571–19578 (2019).
29. Bühler, P., Martin, L. D. & Witmer, L. M. Cranial kinesis in the Late Cretaceous birds Hesperornis and Parahesperornis. Auk 105, 111–122 (1988). 30. Clarke, J. A. Morphology, phylogenetic taxonomy, and systematics of
Ichthyornis and Apatornis (Avialae: Ornithurae). Bull. Am. Mus. Nat. Hist. 286, 1–179 (2004).
31. Navarro-Díaz, A., Esteve-Altava, B. & Rasskin-Gutman, D. Disconnecting bones within the jaw-otic network modules underlies mammalian middle ear evolution. J. Anat. 235, 15–33 (2019).
32. Powell, V. et al. Primate modularity and evolution:first anatomical network analysis of primate head and neck musculoskeletal system. Sci. Rep. 8, 2341 (2018).
33. Diogo, R. et al. First use of anatomical networks to study modularity and integration of heads, forelimbs and hindlimbs in abnormal anencephalic and cyclopic vs normal human development. Sci. Rep. 9, 7821 (2019).
34. Esteve-Altava, B. Challenges in identifying and interpreting organizational modules in morphology. J. Morphol. 278, 960–974 (2017).
35. Lancichinetti, A., Radicchi, F., Ramasco, J. J. & Fortunato, S. Finding statistically significant communities in networks. PLoS ONE 6, e18961 (2011). 36. Rauhut, O. W. M., Foth, C., Tischlinger, H. & Norell, M. A. Exceptionally
preserved juvenile megalosauroid theropod dinosaur withfilamentous integument from the Late Jurassic of Germany. Proc. Natl Acad. Sci. USA 109, 11746–11751 (2012).
37. Bever, G. S. & Norell, M. A. The perinate skull of Byronosaurus (Troodontidae) with observations on the cranial ontogeny of paravian theropods. Am. Mus. Novit. 3657, 1–51 (2009).
38. Erickson, G. M. et al. Was dinosaurian physiology inherited by birds? Reconciling slow growth in Archaeopteryx. PLoS ONE 4, e7390 (2009). 39. Wang, J. et al. Bone tissue histology of the Early Cretaceous bird Yanornis:
evidence for a diphyletic origin of modern avian growth strategies within Ornithuromorpha. Hist. Biol.https://doi.org/10.1080/08912963.2019.1593405
(2019).
40. Alberch, P., Gould, S. J., Oster, G. F. & Wake, D. B. Size and shape in ontogeny and phylogeny. Paleobiology 5, 296–317 (1979).
41. Klingenberg, C. P. Heterochrony and allometry: the analysis of evolutionary change in ontogeny. Biol. Rev. 73, 79–123 (1998).
42. Gerber, S. & Hopkins, M. J. Mosaic heterochrony and evolutionary modularity: the trilobite genus Zacanthopsis as a case study. Evolution 65, 3241–3252 (2011).
43. Mitteroecker, P., Gunz, P., Weber, G. W. & Bookstein, F. L. Regional dissociated heterochrony in multivariate analysis. Ann. Anat. 186, 463–470 (2004).
44. Chen, Y. et al. Conservation of early odontogenic signaling pathways in Aves. Proc. Natl Acad. Sci. USA 97, 10044–10049 (2000).
45. Bhullar, B.-A. S. et al. A molecular mechanism for the origin of a key evolutionary innovation, the bird beak and palate, revealed by an integrative approach to major transitions in vertebrate history. Evolution 69, 1665–1677 (2015).
46. Nemeschkal, H. L. Zum Nachweis eines Os coronoideus bei Vögeln - Ein Beitrag zur Morphologie des Sauropsiden-Unterkiefers. Zool. Jahr.ücher, Abt. f.ür. Anat. und Ontog. der Tiere 109, 117–151 (1983).
47. Smith-Paredes, D. et al. Dinosaur ossification centres in embryonic birds uncover developmental evolution of the skull. Nat. Ecol. Evol. 2, 1966–1973 (2018).
48. Brown, C. M., Evans, D. C., Campione, N. E., O’Brien, L. J. & Eberth, D. A. Evidence for taphonomic size bias in the Dinosaur Park Formation (Campanian, Alberta), a model Mesozoic terrestrial alluvial‐paralic system. Palaeogeogr. Palaeoclimatol. Palaeoecol. 372, 108–122 (2013).
49. R Development Core Team. R: a language and environment for statistical computing.http://www.r-project.org(2018).
50. Csárdi, G. & Nepusz, T. The igraph software package for complex network research. InterJournal, Complex Syst. 1695, 1–9 (2006).
51. Rasskin-Gutman, D. & Esteve-Altava, B. Connecting the dots: anatomical network analysis in morphological EvoDevo. Biol. Theory 9, 178–193 (2014). 52. Esteve-Altava, B. et al. Evolutionary parallelisms of pectoral and pelvic
network-anatomy fromfins to limbs. Sci. Adv. 5, eaau7459 (2019). 53. Ward, J. H. Jr. Hierarchical grouping to optimize an objective function. J. Am.
Stat. Assoc. 58, 236–244 (1963).
54. Murtagh, F. & Legendre, P. Ward’s hierarchical agglomerative clustering method: which algorithms implement Ward’s criterion? J. Classif. 31, 274–295 (2014).
55. Clauset, A., Newman, M. E. J. & Moore, C. Finding community structure in very large networks. Phys. Rev. E 70, 066111 (2004).
56. Esteve-Altava, B., Molnar, J. L., Johnston, P., Hutchinson, J. R. & Diogo, R. Anatomical network analysis of the musculoskeletal system reveals integration loss and parcellation boost during thefins-to-limbs transition. Evolution 72, 601–618 (2018).
57. Hammer, O. & Harper, D. A. T. Paleontological Data Analysis (Blackwell Publishing, 2006).
58. Hammer, O., Harper, D. A. T. & Ryan, P. D. PAST: paleontological statistics software package for education and data analysis. Palaeontol. Electron. 4, 1–9 (2001).
59. Gower, J. C. Some distance properties of latent root and vector methods used in multivariate analysis. Biometrika 53, 325–338 (1966).
60. Gower, J. C. A general coefficient of similarity and some of its properties. Biometrics 27, 857–874 (1971).
61. Hackett, S. J. et al. A phylogenomic study of birds reveals their evolutionary history. Science 320, 1763–1768 (2008).
62. Ericson, P. G. P. et al. Diversification of Neoaves: integration of molecular sequence data and fossils. Biol. Lett. 2, 543–547 (2006).
63. Jetz, W., Thomas, G. H., Joy, J. B., Hartmann, K. & Mooers, A. O. The global diversity of birds in space and time. Nature 491, 444–448 (2012). 64. Jetz, W. et al. Global distribution and conservation of evolutionary
distinctness in birds. Curr. Biol. 24, 1–12 (2014).
65. Revell, L. J. phytools: an R package for phylogenetic comparative biology (and other things). Methods Ecol. Evol. 3, 217–223 (2012).
66. Turner, A. H., Makovicky, P. J. & Norell, M. A. A review of dromaeosaurid systematics and paravian phylogeny. Bull. Am. Mus. Nat. Hist. 371, 1–206 (2012).
67. Schmitz, L. & Motani, R. Nocturnality in dinosaurs inferred from scleral ring and orbit morphology. Science 332, 705–708 (2011).
68. Motani, R. & Schmitz, L. Phylogenetic versus functional signals in the evolution of form-function relationships in terrestrial vision. Evolution 65, 2245–2257 (2011).
69. Anderson, M. J. A new method for non-parametric multivariate analysis of variance. Austral Ecol. 26, 32–46 (2001).
70. Abdi, H. in Encyclopedia of Measurement and Statistics (ed Salkind, N. J.) 103–107 (Sage, 2007).
71. Paradis, E., Claude, J. & Strimmer, K. APE: analyses of phylogenetics and evolution in R language. Bioinformatics 20, 289–290 (2004).
72. Carr, T. D. Craniofacial ontogeny in Tyrannosauridae (Dinosauria, Coelurosauria). J. Vertebr. Paleontol. 19, 497–520 (1999). 73. Dal Sasso, C. & Maganuco, S. Scipionyx samniticus (Theropoda:
Compsognathidae) from the Lower Cretaceous of Italy. Mem. della Soc. Ital. di Sci. Nat. e del. Mus. Civ. di Stor. Nat. di Milano 37, 1–281 (2011). 74. Tsuihiji, T. et al. Cranial osteology of a juvenile specimens of Tarbosaurus
bataar (Theropoda, Tyrannosauridae) from the Nemegt Formation (Upper Cretaceous) of Bugin Tsav, Mongolia. J. Vertebr. Paleontol. 31, 497–517 (2011).
75. Hurum, J. H. & Sabath, K. Giant theropod dinosaurs from Asia and North America: skulls of Tarbosaurus bataar and Tyrannosaurus rex compared. Acta Palaeontol. Pol. 48, 161–190 (2003).
76. Cuff, A. R. Functional Mechanics of Ornithomimosaurs (University of Bristol, 2014).
Acknowledgements
We thank Michel Beaud (Musée d’Histoire Naturelle Fribourg), Christine Lefèvre (Museum National d’Histoire Naturelle Paris), Hans-Martin Berg (Naturhistorisches Museum Wien), Manuel Schweizer and Reto Hagmann (Naturhistorisches Museum Bern) for access to their ornithological collections. Walter Joyce, Serjoscha Evers, Felix Quade and Kévin Le Verger are thanked for discussions and comments on the manu-script. This study was funded by the Swiss National Science Foundation
(PZ00P2_174040) and the German Science Foundation (FO 1005/2-1) (to C.F.).
Author contributions
C.F. designed the research project; O.P. and C.F. collected and analysed the data; and O.P. and C.F. wrote the paper and prepared allfigures.
Competing interests
The authors declare no competing interests.
Additional information
Supplementary information is available for this paper at https://doi.org/10.1038/s42003-020-0914-4.
Correspondence and requests for materials should be addressed to C.F.
Reprints and permission information is available athttp://www.nature.com/reprints
Publisher’s note Springer Nature remains neutral with regard to jurisdictional claims in published maps and institutional affiliations.
Open Access This article is licensed under a Creative Commons Attri-bution 4.0 International License, which permits use, sharing, adaptation, distribution and reproduction in any medium or format, as long as you give appropriate credit to the original author(s) and the source, provide a link to the Creative Commons license, and indicate if changes were made. The images or other third party material in this article are included in the article’s Creative Commons license, unless indicated otherwise in a credit line to the material. If material is not included in the article’s Creative Commons license and your intended use is not permitted by statutory regulation or exceeds the permitted use, you will need to obtain permission directly from the copyright holder. To view a copy of this license, visithttp://creativecommons.org/licenses/by/4.0/.